
As I write this post Gold is consolidating after another $12 oz rise yesterday, currently off $1.70 at $912.00. Today’s post has some must read articles if you are or are about to invest in Gold. Demand is experiencing a strong resurgence, and all the factors are lining up for a spectacular rally! Time to get aboard the Gold Train! – Good Investing – jschulmansr
======================================
This is where I am buying my Gold Bullion…
==========================================
Gold Demand Resurges – Seeking Alpha
By: Nicholas Jones of Bourbon and Bayonets
We love to analyze gold in issues of Bourbon and Bayonets, especially with a focus on the macroeconomic issues that are extremely bullish for our favorite yellow metal. The economic crisis and complete lack of competence from our leaders has resulted in a current financial climate that will result in the most fantastic run the price of gold has ever experienced. The quantitative easing around the globe is definitely the greatest single bullish fundamental that will drive gold going forward. It’s not the only reason gold will rise in price, but it definitely carries the most weight.
The thing is, gold is a sort of hybrid investment vehicle. Essentially it’s part commodity part currency. When I discuss things like monetary inflation and the stimulus package, I’m referring to the aspect of gold that acts as a monetary vehicle. I absolutely don’t want to downplay that importance of this notion, but it’s not the whole story. Gold, like all other assets, is affected by supply and demand fundamentals. Monetary issues may be the driving force behind gold, but looking at supply and demand figures can be very telling, especially in the short run. In this article I am going to dig through the recent 3Q global S&D figures released by the World Gold Council. The numbers are very interesting.
Gold Demand Resurges
Gold demand in the 3Q of 2008 was very strong after being weak for several quarters. Identifiable demand was 1,133.4 tonnes. That figure was up 170.1 tonnes or 18% year over year. Valued in U.S. dollars gold demand was $31.8 billion and up 51% year over year. That number is a record and marks a 45% increase from the record numbers set in the 2Q.
The sector experiencing the largest increase was identifiable investment which was up 137.5 tonnes or 56% year over year. Breaking down the identifiable investment, the largest increase in that subset was net retail investment. Net retail investment increased 121% to 232.1 tonnes.
Leading the growth in demand was Switzerland, Germany, India, and the U.S. At this point in the report, the authors made a statement that there were noticeable shortages of bars and coins around the world. We’ve discussed this story extensively at Bourbon & Bayonets. A result of the dealer shortages has been the divergence between the spot and futures price of gold. Please refer to past issues for a more extensive explanation.
Gold ETFs also had a record net quarterly inflow of 150 tonnes. The report mentions that peak inflows occurred after the collapse of Lehman. In the 5 days following the debacle inflows increased by 111 tonnes ($7 billion). Once the treasury market collapses, gold will revert back to its rightful place as the number one flight to safety asset in the world. I would like to put a precaution on using ETFs. When using ETFs to buy gold, you remove one very important element. Physical gold has no counterparty risk. ETFs do. This will become more important going forward from here, but in the mean time just think of what the Hunt Brothers would have to say about PM ETFs.
Moving back to the WGC report, early demand in the 4Q has picked up where it left off in the 3Q. They also mention that gold shortages are expected to continue, de-hedging will continue to abate, and central bank sales will be weak.
[All figures provided by the World Gold Council 3Q Gold Demand Trends report.]
Monetary forces may be the driver in the gold market, but we can use these reports to help with short term expectations. Demand is strong, really strong. There were record figures across the board. On the other side of the story, supplies are tight and will continue to be tight. The players are coming back to the game and this will provide strong underlying support in the gold market going forward. I still hold to my views that gold may test $1000 in the near term, but I believe we’re one correction back to $850 away before we make a run up to $1500.
=================================
My Note: If demand is still increasing then fundamentally upward pressure remains intact. We have probably seen most of the cash starved stock investors, hedge funds, and etc. have already sold their positions to raise cash to offset their losses. Yes, I agree we will see a retest of the $850 level but not until we have made new all time highs in the Gold Markets. Then at that point we will retrace and then I think the next rally will be to $1500 – $2000 oz. level. This is without any major flare-ups in the Middle East or a U.S. debt default. One other potential trouble spot is a small war between China and India over the disputed border areas, especially with India being distracted by growing tensions with Pakistan. If any of those scenarios happen, then Gold can and will easily go to well over $2000-$3000. You heard it here first folks!-jschulmansr
===================================
Gold’s Performance Relative to Dollar, Yen and Euro – Seeking Alpha
As gold receives headlines, let’s look at it relative to the three key global currencies – Dollar, Yen and Euro.
Gold is sometimes viewed more as a commodity for jewelry and electronic applications, and at other times more as a quasi-currency. It has an ancient history for both roles. As of late, gold has been taking on more of the alternative currency role.
Paper currencies pay interest, but physical gold does not. As the interest rate on paper currency approaches zero, the short-term opportunity cost of holding gold versus paper currencies becomes minimal (noting, however, that there are storage and security or management costs with gold).
Reasonable proxies for gold and currencies are: gold (GLD), Dollar (UUP), Yen (FXY) and Euro (FXE).
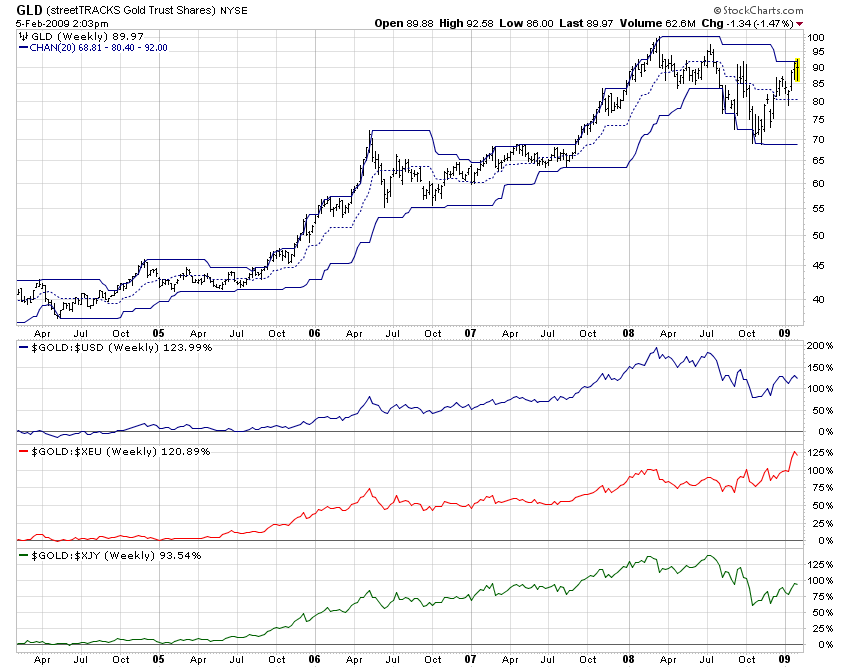
The 3-year weekly chart below uses “price channels” to identify the highest highs and the lowest lows for the twenty prior periods. It also presents a Fibonacci study that essentially marks the levels for an approximate 1/3, 1/2 and 2/3 retracement of the most recent peak-to-bottom price range.
click images to enlarge
3-Year Chart with Fibonacci Study
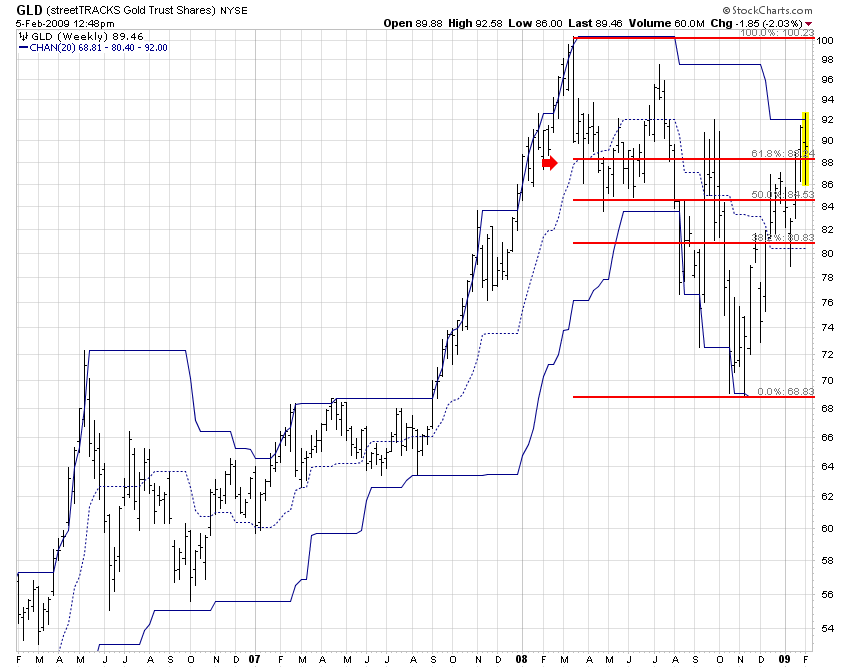
Theory would say that having retraced 2/3 of the prior peak-to-bottom, the current move is more likely to persevere than not.
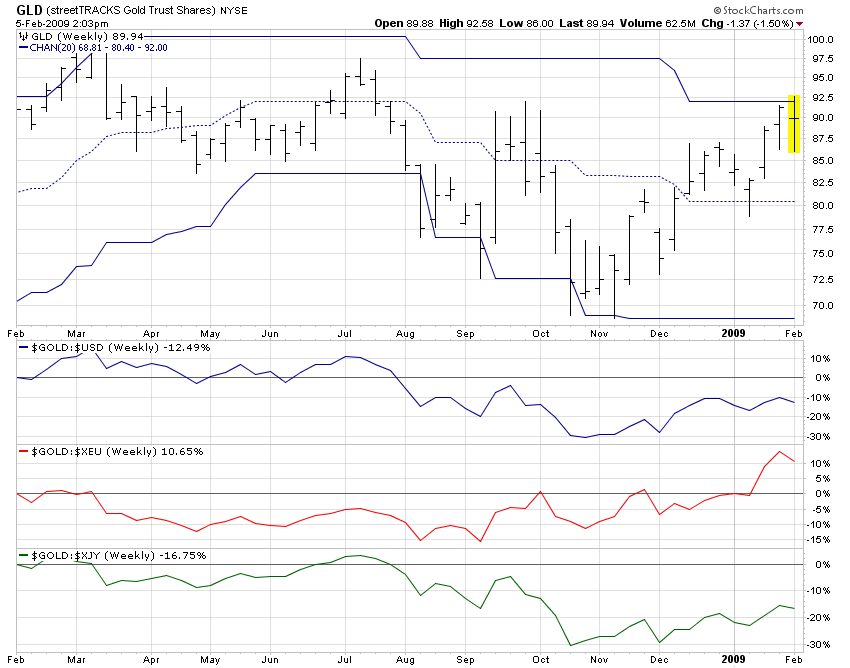
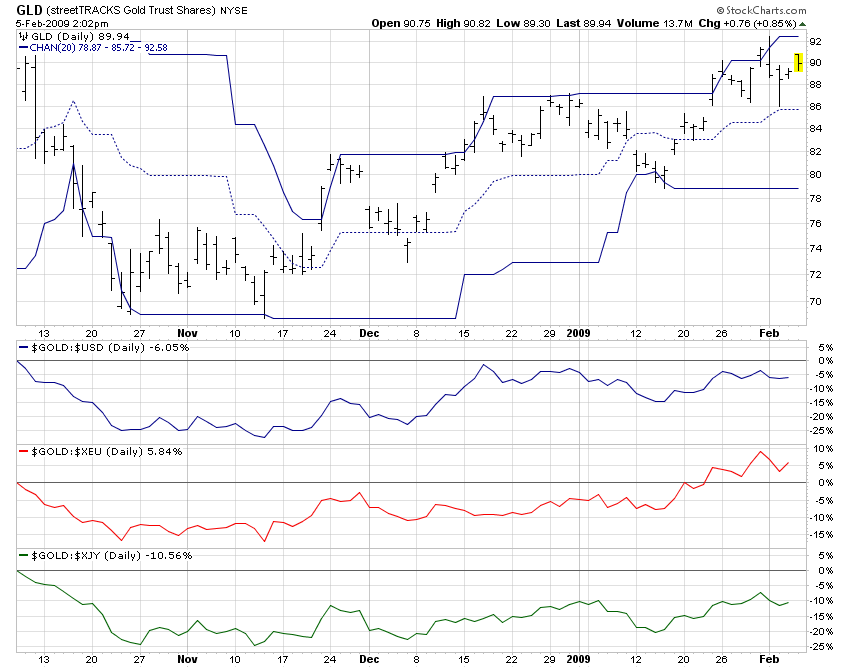
One approach to identifying resistance and support levels is to find prior highs and prior lows. Price channels are one way to have a computer generate visual queues to resistance and support levels automatically. Just be sure the historical period for the price channels is what you want. Note also that prior consolidation areas tend to create resistance or support levels. This daily study uses price channels over 20 trailing periods as does the 3-year weekly chart above.
1-Year Chart with Resistance Levels and Trend Lines
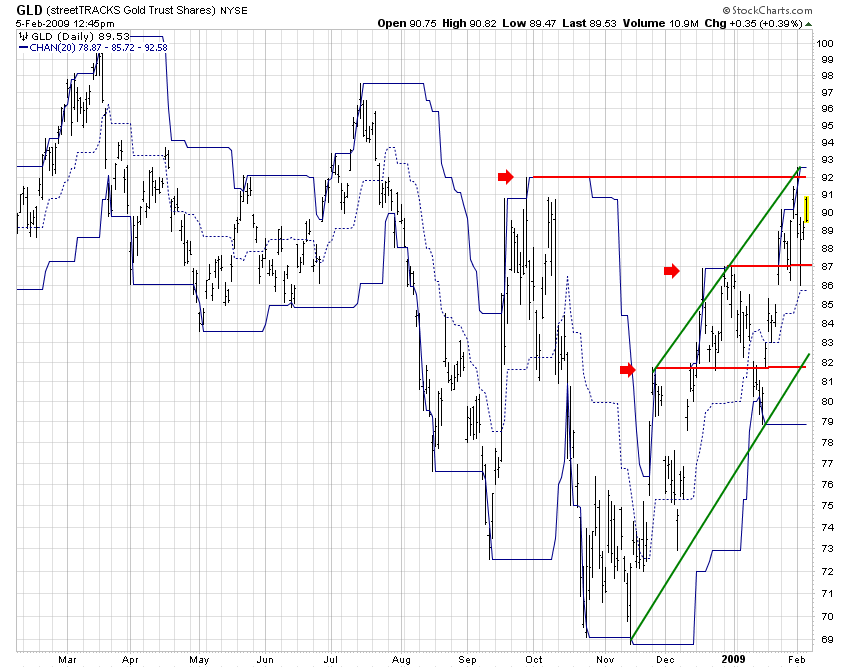
Having pierced two resistance levels and flirting with a third shows great strength. The higher bottoms and higher tops is a favorable indication.
Gold is near twenty-year highs, having pierced several key resistance levels since its slide in Q4 2008. Some predict new highs ahead.
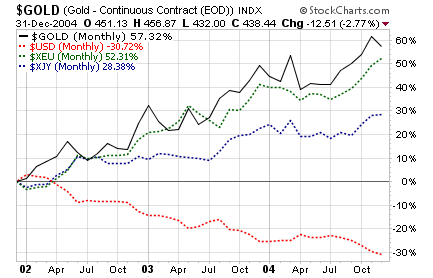
Here is a twenty-year monthly chart showing how gold performed on a percentage basis relative to the Dollar, Yen and Euro.
20 years
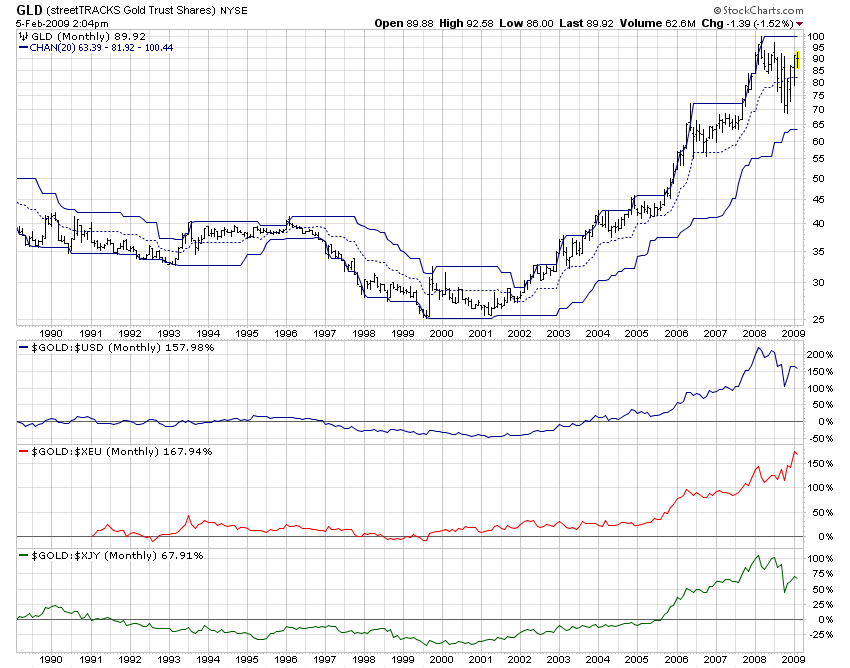
Gold may reach new twenty-year highs. A trend is a trend, until it is not a trend. On the other hand, every rubber band can only stretch so far.
Investor sense of success in the multi-national recovery programs may divert investor money flows to other asset categories, possibly slowing or capping the advance of gold. Alternatively, investor sense of failure by recovery programs would likely direct more money flows to gold, possibly extending its advance.
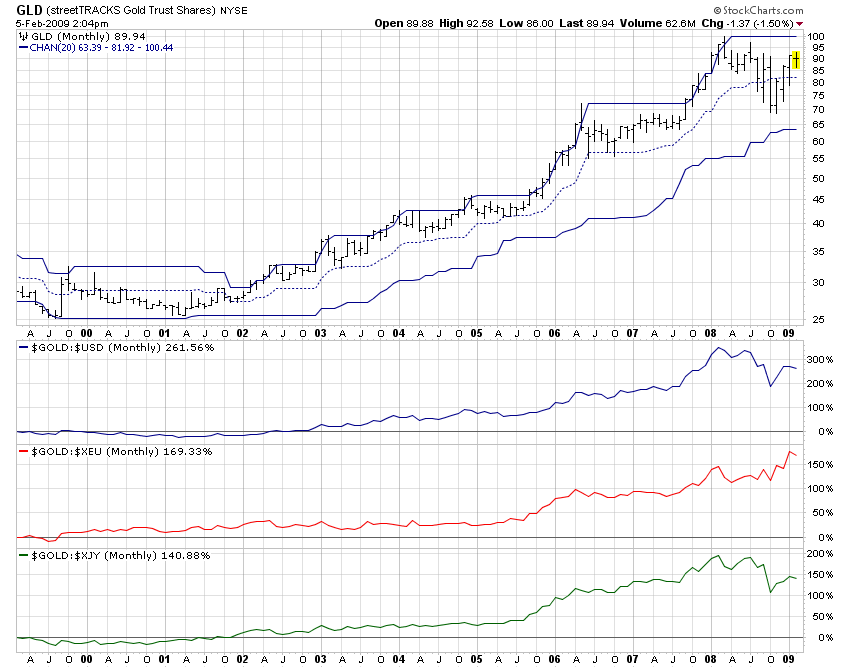
10 years
5 Years
1 Year
4 Months
Sometimes it is more informative to look at discrete periods of time, such as successive individual calendar years or groups of years, rather than cumulative periods of time. That is because of the persistent impact by past periods on cumulative returns, whereas discrete periods start fresh without the quantitative effect of the past.
The following charts show 3-year monthly performance for eight successive discrete periods beginning with 1999. Gold has been the superior performer in seven of the eight periods. The question remains, when has it gone high enough. So much may depend on the conduct of governments in the near-term.
3 Years Beginning 1999

3 Years Beginning 2000

3 Years Beginning 2001

3 Years Beginning 2002
3 Years Beginning 2003

3 Years Beginning 2004

3 Years Beginning 2005

3 Years Beginning 2006

Disclosure: The author holds a small allocation in gold via the ETF, symbol GLD, with a 10% persistent trailing stop.
================================
My Note: Can’t forget Silver!
Long-Term Trend in Investment Demand for Silver – Seeking Alpha
By: Michael Zielinski of Gold and Silver Blog
In a previous post, I reviewed the amount of silver bullion sold by the United States Mint during 2008. With this post, I will take a longer term look at silver demand, which highlights the absolute explosion in demand which has occurred in recent years.
The supporting data for the charts included with this post comes from a new section of Gold and Silver Blog which collects the US Mint Silver Bullion Sales data since the inception of the program in 1986. You can visit the page to find the monthly sales figures for any date from 1986 to present. The section also calculates the approximate silver bullion value of each period’s sales based on the average monthly price of silver.
Silver Bullion Sales in Ounces
Here’s a chart summarizing the total ounces of silver bullion sold by the US Mint each year since 1986. (Click on the chart for a larger version.)

During 2008, the US Mint sold 19,583,500 ounces of silver through its bullion program. As explored previously, this marks an all time high for the program. It represents an increase of more than 98% from the prior year, and an increase of 92% from the previous all time high reached in 2002.
One important thing to note when considering the magnitude of the increase for 2008 is that the number of ounces sold could have been much greater. The US Mint suspended silver bullion sales during February before resuming sales on a rationed basis. When the rationing first began, one dealer claimed that he could have sold 500,000 ounces of silver per week, but was only allocated 100,000 ounces.
2008 Silver Bullion Sales in Dollars
Here’s a second chart which illustrates the explosion in demand for silver in even more dramatic fashion. The chart shows the approximate dollar value of silver bullion sold by the US Mint each year. As mentioned, this was calculated based on monthly silver bullion sales and the average monthly price of silver. (Click on the chart for a larger version.)

During 2008, The US Mint recorded silver bullion sales of approximately $286,451,715. This marks an all time high and an increase of 114% from the prior year, which was also the prior all time high.
The magnitude of the increase is more pronounced when compared to silver bullion sales from earlier years of the program. Throughout the majority of the 1990’s, the US Mint was selling less than $30 million worth of silver each year. The year for the lowest value of silver bullion sold was 1996 with $17,434,050. During 2008, the US Mint recorded monthly sales exceeding this level for ten out of twelve months.
Silver Bullion Sales and the Price of Silver
But what about the price of silver amidst this explosion in demand?
Here’s a third chart which plots the value of US Mint silver bullion sales from the last chart, together with the average annual price of silver for each year. (Click on the chart for a larger version.)
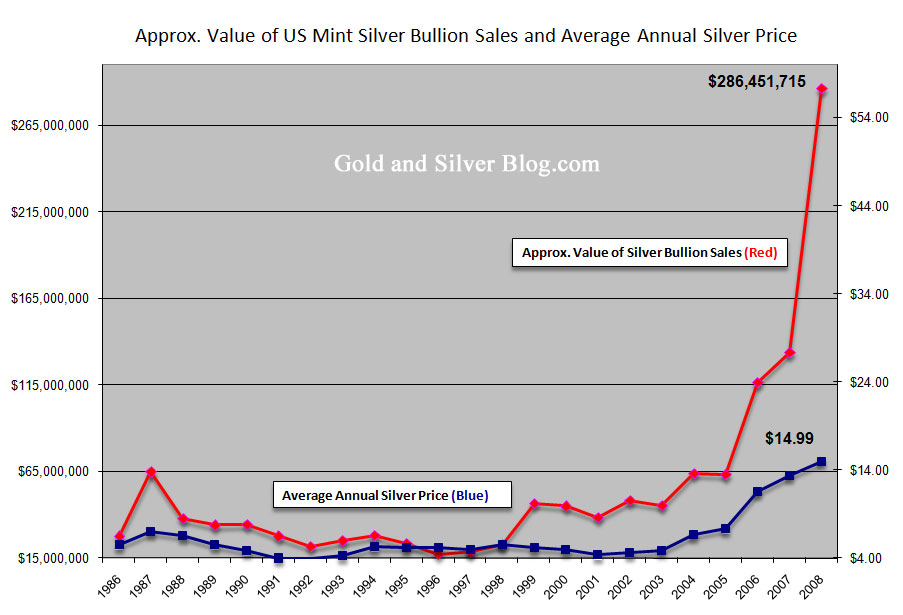
Silver bullion sales increased from a low of $17,434,050 to last year’s high of $286,451,715 representing an increase of 1,543%. The average annual price of silver increased from a low of $3.95 per ounce to last year’s high of $14.99 representing an increase of 203%. While this is a respectable gain, it pales in comparison to the increase in demand.
Everyone has been waiting for the disconnect between the demand for silver and the price of silver to resolve itself. Will it finally happen in 2009?
Disclosure: Long physical silver.
===================================
My Note: Me too! Long Physical Silver Too!-jschulmansr
===================================
Now from Peter Grandich:

I spend almost no time on conspiracy theories. However, a couple events today made me feel that 1 + 1 = 3 today.
We start the day with horrific economic news. Retails sales fall sharply and the weekly unemployment number comes in higher than any forecasts. The stock market falls over 100 points in the first hour and once again is testing key support around 7900 (I’ve mention this area as key several times recently). Just when it appears we’re going to break support, Tout-TV “reports” the government may be suspending the “mark to market” rule and there will be a big announcement Monday from the Treasury. The “Don’t Worry, Be Happy” crowd did their thing and Tout-TV filled the air with “Happy” people praising this expectation and how well the market is handling bad news today.
So how did 1 + 1 = 3 today? It was publicly announced that the “Working Group on Financial Markets“, better known as the Plunge Protection Team (PPT) met for the first time today under the new administration. After seeing the horrific economic news and believing tomorrow’s unemployment numbers could be real bad, one could envision a sharp sell off today that could have been followed be another one tomorrow. That could have left the stock market teetering going into Monday’s “big” announcement. Hmmm….
Despite poor economic news, the treasury market continued to weaken. As any one asked how all the governments around the world are going to fund all the debt being created for their bail-outs and stimulus packages? Hmmm…
There are two things you can’t keep down these days, a good man and gold. If we can clear $940 on a closing basis, I think we’re off to the races. Gold rises on up days in the U.S. Dollar and falls on days the dollar is down. Hmmm…
Oil – For three straight weeks we’ve had bad supply numbers for oil but it still manages to keep its head above $40. This has to be frustrating for the bears. Next Wednesday’s inventory number should be big as if we continue to build more than expected, oil may not hold. But if we see a drawdown, we could see a rally of $5 to $10 in rather short order.
U.S. Dollar – Sideways despite rising U.S. interest rates. I love the Canadian dollar (its people but not the Vancouver Canucks).
Northern Dynasty Minerals has run up sharply but is very overbought short term. Some profit-taking and consolidation would be healthy.
======================================
Bipolar Gold – Nichols onGold.com
By: Jeffrey Nichols of NicholsonGold.com
With the price of gold lurching first one way then the other, it looks like the market has been suffering from bipolar disorder. I expect this split-personality behavior, characterized by extreme price volatility, to continue for some time to come with big swings up and down — but, importantly, around a rising trend with support levels moving up step-wise over time.
 In short, gold is heading much higher, but not without more struggle and occasional disappointment for those looking for a speedy ascent. Further out — over the next year or two — I have no doubt that gold will move to new historic highs well above the $1030 level touched a year ago March.
The principal engine of gold’s ultimate ascent is the continuing rapid pace of monetary expansion – in part necessitated by a trillion-dollar stimulus program in the United States — and the acceleration in U.S. price inflation will surely follow sometime in the next year or two.
There are at least three other less certain but entirely possible developments any one of which could touch off a real panic in the gold market and carry the metal’s price to levels most would consider unimaginable:
- First, another large-scale financial catastrophe in which one or more financial institutions seemingly suddenly need hundreds of billions of dollars more in government bail-out funds.
- Second, a growing reluctance on the part of foreign central banks and other major investing institutions to continue underwriting the U.S. federal budget deficit without a significant rise in nominal U.S. interest rates.
- Third, a run on the U.S. dollar, though it is hard to imagine where dollar holders would run since other currency markets (and certainly the gold and other precious metals markets) are not large or deep enough to absorb a major shift in currency preferences and when other major currencies are also losing creditability as reliable stores of value.
History Lesson
It is instructive to examine the forces that held gold back during the past year for clues to the metal’s future path.
Much of gold’s weakness during the past year and its inability to sustain periodic price advances was due to the indiscriminate selling of commodities-related investments by hedge funds, other institutional players and some wealthy families in order to raise cash, increase liquidity, cover big losses in equity and other asset markets.
Often these institutional sellers were not holding individual commodities but baskets or indexes that included gold – so gold got dumped along with everything else. In other words, gold was sold not because it was singled out as an unworthy holding but because it was a component in the indexed baskets of commodities held by many hedge funds and institutional traders.
In addition, the decline in inflation and inflation expectations due to the fall in oil and other commodities prices and the increasingly gloomy economic outlook dampened demand for gold among some who look to the metal as an inflation hedge.
Despite all of this, one must still acknowledge the yellow metal’s staying power and relative performance as a store of value during a tumultuous period for the world economy and the sizable loss of value in other asset classes.
Indeed, gold has done rather well compared to the $30 trillion loss in world equity market capitalization, the unfathomable loss in real estate values, and the $1.2 trillion of losses and write-downs on worthless assets held by banks worldwide (IMF estimates). Measured in U.S. dollars, gold is now up a few percent from the end of 2007 – but it is at all-time highs against nearly all of the major currencies.
Bipolar Investment Demand
By late 2008, the wave of commodity disinvestment had come to an end. Simply put, the commodity holdings of hedge funds and other large-scale players had been largely depleted — and, to the extent that these were actual physical positions, the gold has moved to stronger hands.
Recent data from commodity futures exchanges confirm that the liquidation of long gold futures positions has not only ended but has been replaced with some fresh buying. In the week ending January 27th the net long position increased by 49 metric tons to reach a total of 564 metric tons (18.1 million ounces). This compares with a net long position of 516 tons (16.6 million ounces) at the end of last year and a recent low point of 213 tons (6.85 million ounces) in mid-November.
An even more encouraging indicator of gold’s future price is the continuing strength of investor interest among retail investors and conservative institutional investors wishing to hold physical metal. Importantly, these buyers are not traders looking for quick gains but many are simply scared individuals, families, and prudent institutional investors seeking to protect their wealth, their savings, and their retirement nest eggs (for themselves or their clients).
One need only look at the holdings of exchange-traded funds (or ETFs) such as the SPDR Gold Shares ETF traded on the New York Stock Exchange. Holdings of gold bullion on behalf of SPDR Gold Shares investors reached an all-time high of 859.5 tons (27.6 million ounces) on February 4th. This compares with 780.23 tons (25 million ounces) at the end of last year and 630 tons (20.3 million ounces) in early 2008.
Without doubt, the introduction of SPDR Gold Shares just over four years ago (along with a number of smaller exchange-traded gold funds in other global markets) has been an important structural change in the gold market facilitating the participation of individual investors as well as institutions, some of which have prohibitions from direct purchase and ownership of physical metal. Importantly, ETF gold investors have become a force in the market with total ETF holdings now exceeding the COMEX net long position.
Great Expectations
I remain bullish on gold because — even as the global economic recession deepens — governments will find the only way out of this mess is to print more money.
It’s not just the U.S. monetary authorities pumping up the money supply, though that would be enough to boost the U.S. dollar price of gold. Their counterparts in every major economy – including the United Kingdom and the Euro zone, China, Russia, Japan and on and on – are doing likewise.
We have never in the history of money seen such an expansion in its supply without, after a period of time, a rapid deterioration in its value. More than any other factor influencing the gold market, it is the inevitable devaluation of money and the corresponding rise in price inflation that will propel gold skyward in the next few years.
As sure as day follows night, reflationary monetary policies — however necessary — have long-term implications for global inflation. Typically, monetary creation affects price inflation with a lag of six months to a couple of years or more . . . so it may be some time before inflation is recognized as a serious problem. But gold prices have shorter lags and, in fact, have already begun moving up long before rising inflation becomes apparent or worrisome.
As I have said before, with the right confluence of economic and geopolitical developments we could see gold break through $1500, then $2000, and possibly still higher round numbers in the next few years.
Not Without Risk
Despite expectations of much higher gold prices this year and beyond, it would be wise to remember that gold remains volatile and vulnerable. We are in an unprecedented environment with daily evidence of a deteriorating U.S. and global economy, where policy makers are employing powerful, yet untested, tools to repair a broken economy, and politicians cannot be trusted to do all the right things. In this environment, we could still get a quick sell-off that would bring us back to support levels well below recent prices.
That said, there are some specific factors that could trigger a sizable correction in gold prices in the next few months:
First and foremost, a temporarily stronger U.S. dollar vis-à-vis the euro: The European Central Bank is a few steps behind the Federal Reserve in lowering short-term interbank lending rates. As the ECB catches up by lowering interest rates in two or three steps over the next few months, the dollar will likely pop up briefly each time – and, each time, a stronger dollar could precipitate a sell-off in gold as it did in January and several times last year.
Second, weakness in Indian gold demand: India, the world’s largest gold-consuming country with imports last year of 720 metric tons (23.1 million ounces), has seen a sharp decline in gold imports. The Bombay Bullion Association reports that gold imports plunged more than 90 percent to roughly 1.8 tons in January from 24 tons a year earlier. Imports are down largely in response to the record-high rupee-denominated price of gold. High prices are discouraging demand and eliciting large-scale sales of old jewelry from profit takers, sales that are refined locally into bars and re-enter the market displacing imported metal.
Sources in India say the recent data exaggerates the situation and expect at least a partial recovery as gold buyers adjust to the high and rising price for the yellow metal. They also say that holiday and wedding-related demand, which is an important component of total consumption should pick up shortly. In addition, the new government program of offering small gold coins at rural post offices could be a spur to gold buying.
But if Indian buying does not pick up soon, there could be more metal available in world markets to satisfy the rise in U.S. and European investment demand and correspondingly less upward pressure on the price of gold.
Coming Soon to a Blog Near You
In subsequent posts, I will take a look more closely at some of the other variables that could influence gold – for better or worse — in the months ahead: Central bank and IMF gold policies and prospects, the economic and political situations in China, Russia, and Saudi Arabia – and, of course, we’ll continue to comment on the unfolding economic crisis and policy response in the United States.
=============================================
GLD Working While S&P Is Floundering – OTC Journal
Earlier this week I published two buy recommendations- GLD at $88.47 (the ETF for Gold, which is the easiest way to own it), and EZA- the ETF of the Dow like stocks of South Africa.
My view- GLD is probably headed to $100 in pretty short order, which equates to $1,000 per ounce in gold. EZA should mirror the movement in Gold as South Africa industry is very mining focused, and has the longest established and some of the most prolific producers. And, as importantly, EZA pays a cash dividend of 6%, which significantly enhances your total return opportunity.
The S&P and DOW are both stuck in trading ranges since coming off the November lows. There’s lot of talk about the DOW being skewed. 9 of the 30 DOW stocks are trading below $10 per share which has never happened – courtesy of the financials. Remove the financials from the DOW and the S&P 500, and you have a much healthier picture. Tech is trading up along with Small Cap Value. There is more underlying strength than the major indexes are indicating.

I want to take another look at my published ideas from earlier this week. Here’s a longer term look at GLD, the ETF for Gold. Gold made the $1,000 level last March, and then fell all the way be to $700 as the recession gained strength.
Since making it’s bottom in November along with all the equities, Gold has behaved like a champion. It’s made a serious of higher lows and higher highs for the last 3 months. More importantly, Gold is butting up against the downtrend line from the top made last March. A solid break above $92 would suggest a major breakout, and we’re very close right now.
So, let’s turn to my arbitrage idea if you like Gold. EZA- the South Africa ETF. South Africa is one of the largest and longest established mining centers in the world. Nearly 50% of the holdings in the ETF are basic materials companies. The average PE ratio in the portfolio is 8.79.

EZA is not as close to a breakout relative to GLD, which suggests a bit of a lag factor in the idea. I recommended this South Africa fund made in December at $34. Yesterday, it closed at $34.36, which isn’t bad when one considers both the DOW and S&P 500 took 10% hits in the month of January. Factored into the total return on EZA is the 6% dividend. This idea is starting to work, but hasn’t really broken out yet.
It probably needs to eclipse the $36.50 to really get into breakout mode. As Gold appreciates, I’m hypothesizing EZA will follow it up. Owning EZA gets you both the dividend and the appreciation.
If you like these ideas, but don’t want to pledge the kind of capital it takes to own a $34 stock or a $90 stock, you might want to consider the options. They are much riskier, but offer a lot of leverage for a little money.
For GLD- the April $90 calls are trading at $6.25- it’s a big time premium, but if GLD finds its way to $100 you’re likely to enjoy a 50% to 100% return. The calls trade under the symbol GLD.DL. If you’re more sophisticated and have a lot of capital, you should consider shorting the puts. It’s a bit trickier and takes a lot of money.
For EZA- The April 35 Calls are trading at about $2.25. That’s a pretty reasonable premium. A $2250 investment gets you 10 calls, and you control 1,000 shares. This call trades under the symbol EZA.DG. With EZA, shorting the puts might be a good strategy as well. If you’ve never done it and don’t understand it, now is not the time to educate on this strategy.
Own either or both- in my view money is flowing to Gold. The dollar is losing steam, and the US is going to have to print a lot of money to spend our way out of this recession, which is favorable for gold. Here’s two ways to make money on that trend.
Home Page : www.otcjournal.com
Email Questions or Comments To: editor@otcjournal.com
======================================
Analysts Pile On The Gold Bull – Gold and Silver Blog
By: Michael Zielinski of Gold and Silver Blog
 Gold’s recent move above $900 has analysts scrambling to increase their price targets.
The last time I looked at gold price targets from analysts was in early December, when a similar flurry of activity took place. Morgan Stanley got the ball rolling by saying that gold could reach $1,000 in three years, Merrill Lynch followed with a price of $1,500 at an unspecified date, and Citigroup topped them all by mentioning $2,000.
This time around started in the same way with Morgan Stanley making a timid call for $1,075 gold in three years. From their report: “A globally synchronous and aggressive fiscal and monetary stimulus may be needed to re-inflate the global economy, and we think this continues to present significant upside to gold prices.” For their rhetoric, their target price is ridiculous, unless you consider “significant upside” to be an average 6% gain over three years.
Merrill Lynch chimed in next with their Chief Investment Officer reiterating their prediction of $1,500 gold, but this time with a time frame of 12 to 15 months. Quote from the CIO: “With confidence in currencies shaken to the core, the yellow metal is increasingly assuming the role of “the most trusted currency. We have never seen such a rush to buy gold. It’s bringing in security and it’s still affordable.”
A few days following, both UBS and Goldman Sachs updated their previously underwater gold price targets. UBS raised their 2009 price target from $700 to $1,000. Goldman Sachs raised its forecast of $700 to $1,000 within a three month time frame.
As expressed before, I do not think we have reached the point where these periodic analyst pile ons can be used as a contrary indicator for gold. Analysts are still showing restraint, and for the most part raising their targets simply to keep up with the rising price of gold.
======================================
That’s All for Now- Good Investing! – jschulmansr
Nothing in today’s post should be considered as an offer to buy or sell or as a recommendation for any securities or other investments; it is presented for informational purposes only. As a good investor, consult your Investment Advisor, Do Your Due Diligence, Read All Prospectus/s and related information carefully before you make any investments. – jschulmansr

Hey,
Cool blog, I just came across it and I’m already a fan
I hope it’s not too brash but I have just begun blogging
my own weight loss(I shed 30 pounds in a month, so I’m happy
, and I was wondering if you could share
the weight loss plan I used for your blog readers.
My latest post is
weight loss supplement
If you want to do a link exchange
that would be great as I want to share my weight loss success
with everyone. If I can lose weight then
anyone can. Whatever you do, never give up and you WILL
meet all your weight loss goals!
much thanks for reading,
Joan
LikeLike