• Recommended Sites & Links
  • About

Dare Something Worthy Today Too!

~ FreeCryptoBitCoins, Cryptocurrency, BitCoin, Ethereum, BitCoin Cash, Ethereum Classic, LiteCoin, DogeCoin, Gold & Precious Metals, Investing & Investments, Stocks and Stock Markets, Financial Markets & Market Timing, Technical Analysis, Oil and Energy Markets, Hard Assets Investing, BlockChain, Airdrops, Earn Free Bitcoin…

Dare Something Worthy Today Too!

Category Archives: Currency and Currencies

Can a Dubai Silver ETF Send Global Spot Prices Higher?

18 Tuesday Nov 2008

Posted by jschulmansr in capitalism, commodities, Copper, Currency and Currencies, deflation, Finance, gold, hacking, inflation, Investing, investments, Latest News, Markets, precious metals, silver, Today, U.S. Dollar, Uncategorized

≈ Comments Off on Can a Dubai Silver ETF Send Global Spot Prices Higher?

Tags

agricultural commodities, alternate energy, Austrian school, banking crisis, banks, bear market, Bollinger Bands, bull market, capitalism, central banks, China, Comex, commodities, communism, Copper, Currencies, currency, deflation, depression, diamonds, dollar denominated, dollar denominated investments, economic, economic trends, economy, financial, Forex, futures, futures markets, gold, gold miners, hard assets, heating oil, India, inflation, investments, market crash, Markets, mining companies, Moving Averages, natural gas, oil, palladium, physical gold, platinum, platinum miners, precious metals, price, price manipulation, prices, producers, production, protection, rare earth metals, recession, risk, run on banks, safety, Saudi Arabia, silver, silver miners, socialism, sovereign, spot, spot price, stagflation, Technical Analysis, timber, U.S. Dollar, volatility, warrants, Water

Can a Dubai Silver ETF Send Global Spot Prices Higher? – Seeking Alpha

By: Peter Cooper of  Arabian Money.net

The Dubai Multi Commodities Center is understood to be putting the finishing touches to an exchange traded fund for silver with a launch likely next month as demand for silver has surged in the past six months.

Local bullion dealers are having to fly heavy silver bullion bars in from around the globe to meet demand as traditional sources closer to Dubai have been exhausted. The DMCC has successfully established itself as a regional hub for commodities trading over the past few years, and has its own swanky new business park with its gold, silver and diamond towers.

City of Gold

Around 20 per cent of the world’s physical gold trade is conducted through Dubai which used to be the epicenter of gold smuggling to India thirty years ago when import taxes were sky high. Nowadays Dubai is a convenient logistics center for commodities traders and still tax free.

The details of the silver ETF are being kept under wraps for the launch but plans seem advanced. Local jewelers have long used silver in a 25:75 amalgam with gold to create white-gold which is popular with consumers.

But clearly the ETF is an strictly an investment product, and demand for the shiniest of metals has been rising strongly, as evidenced by the high premiums now being paid on coins and bullion locally.

ETF price advantage

The latter also gives the ETF a natural advantage. Its price will be closely linked to the lower spot price for physical silver, and not be inflated by the high premiums now paid on physical silver.

Investors will no doubt appreciate this keen pricing advantage, and hope to also profit from the leverage silver offers to the gold price. In previous gold price booms silver has outperformed the yellow metal, and the gold-to-silver price ratio has fallen sharply.

Will the new Dubai silver ETF have a big enough impact on the tiny global silver market to send prices higher like the Hunt Brothers did in the late 1970s when they cornered the market? Well, nothing succeeds like success and a silver ETF in Dubai looks like being the right product in the right place at the right time.

My Note: A Word to the Wise is sufficient!

See My Ealier Post from Today: All The Gold In Saudi Arabia, if they buy as much Silver as they have Gold – Look Out…

My Disclosure: I am long all Precious Metals, Mining Companies, Etf’s, and in my opinion you should be too! – jschulmansr 

Share this:

  • Click to share on Reddit (Opens in new window) Reddit
  • Click to share on Facebook (Opens in new window) Facebook
  • Click to share on LinkedIn (Opens in new window) LinkedIn
  • More
  • Click to share on X (Opens in new window) X
  • Click to share on Pinterest (Opens in new window) Pinterest
  • Click to share on Tumblr (Opens in new window) Tumblr
  • Click to print (Opens in new window) Print
  • Click to email a link to a friend (Opens in new window) Email
Like Loading...

Precious Metals Will Depose Cash from Its Temporary Throne

18 Tuesday Nov 2008

Posted by jschulmansr in capitalism, commodities, Copper, Currency and Currencies, deflation, Finance, Fundamental Analysis, gold, hard assets, inflation, Investing, investments, Latest News, Markets, mining stocks, precious metals, silver, Technical Analysis, Today, U.S. Dollar, Uncategorized

≈ 2 Comments

Tags

agricultural commodities, alternate energy, Austrian school, banking crisis, banks, bear market, bear stearns, Bollinger Bands, bull market, capitalism, central banks, China, Comex, commodities, communism, Copper, Currencies, currency, deflation, depression, diamonds, dollar denominated, dollar denominated investments, economic, economic trends, economy, financial, Forex, futures, futures markets, gold, gold miners, hard assets, heating oil, India, inflation, investments, market crash, Markets, mining companies, Moving Averages, natural gas, oil, palladium, physical gold, platinum, platinum miners, precious metals, price, price manipulation, prices, producers, production, protection, rare earth metals, recession, risk, run on banks, safety, Saudi Arabia, silver, silver miners, socialism, sovereign, spot, spot price, stagflation, Technical Analysis, timber, U.S. Dollar, volatility, Water

Precious Metals Will Depose Cash from Its Temporary Throne

By: Peter Cooper of  Arabian Money.net

‘We have just been in Bahrain and everybody is cashed up!’ one banker told me today. My reply was that if everybody is now in cash, then it just has to be the wrong place to be. There are some very good reasons to worry about a large cash position.

Quite apart from the contrarian argument that the crowd is always wrong, you have to consider what is happening to the supply of cash. We know that with the sell-offs in global capital markets there is plenty of demand for cash, but what about the supply?

Money supply out of control

Another banker today showed me a chart of US money supply growth over the past few months, and highlighted a 111% increase. This compared with something like 15% money supply growth in the early 1930s as the US authorities grappled with the Great Depression.

There is an absolute tsunami of money coming into the system. What happens when the supply of something exceeds the demand? The price drops. And that is exactly what is going to happen to the US dollar – the authorities are about to inflate away their debt problem.

It is so simple: The debt stays at the same nominal amount, you print more money and the real value of the debt falls. Of course, in the real world that also means a bond market collapse as inflation will make both the coupon and real value fall.

I wonder how long it will be until cash is deposed as king of the investment world? My guess is that it will not be long after the sell-off ends. How long will that take? It could be at the end of the year as the hedge funds attempt to square their positions, or it might be next spring after another lurch downwards in stock prices.

The bottom for stocks will be the top for cash and treasury bonds. Then inflation will start to emerge and depose cash from its temporary throne. Who will be the new king?

Gold and silver

Step forward precious metals to take a bow. Everybody knows that gold is inversely correlated to the US dollar and that silver is leveraged against the gold price. But why have precious metals taken so long to claim their crown in this financial meltdown?

The straight answer is that hedge funds have been selling assets across the board and turning gold into dollars, or at least the paper gold of futures contracts into greenbacks. The physical demand for gold and silver has been growing strongly all the time, hence the silver coin shortage and the $3.5 billion Saudi gold purchase.

Once the hedge funds stop selling (you always do eventually run out of assets to sell), then gold and silver prices will rally, and the rush out of cash and into precious metals will do something pretty spectacular to the price. Gold and silver stocks, languishing at a 40-year low, should jump and deliver phenomenal performance for new investors and repay the patience of long-term holders.


This article has 9 comments:

  •  
    0 0
    • socrateazz
    • 7 Comments

    Nov 17 08:31 AM

    storms are brewing in the finacial markets. The gales have produced a few waves and troughs. I think the real storm is coming! Unfortunately I think the actions seen so far have mostly added steam to the storm! I see folks finding safe harbor or riding the waves. I see little effort in actually weakening the storm. to weaken the storm one must weaken the cause. What caused the current financial situation? Is it the same things which made life soo good for so long? was it the laziness of many? Was it ignorance of those who think they know? was it greed of those with wealth? was it greed of those who wanted the wealth? was it ignorance of truth? Was it ignorance in beliefs? Was it power abuse? Was it abuse of force? was it special intererest abuse? was it general interest abuse? I could go on A small part ofan ovious problem has been recieving enormous thought while most of the problem is ignored with little concideration of the reasons which can not be blamed on somebody else.
    Reply |Report abuse
  •  
    0 0
    • Diabolo
    • 8 Comments

    Nov 17 08:56 AM

    i think we’ve already seen the worst – from now on, we wont have more high-profile bank failures – already had bear, lehman with merrill, aig, fnme, fdmc saved…

    Reply |Report abuse

    the govt will need to keep pumping these with cash – which at some point will lead to hyperinflation – gold is a great long-term investment… as for short-run, im still bullish dollars… when shit hits the fan, investors flock to dollar and yen!


  •  
    0 0
    • bobbobwhite
    • 44 Comments

    Nov 17 12:20 PM

    Gold and platinum are great longer term investments, but most people want more liquidity and shorter term results. However, we are harshly finding out that it is difficult to impossible to gain both at the same time in the same vehicle, but people still seek that nearly impossible(and lazy) dream and lose countless billions in the process.

    Reply |Report abuse

    My advice is to never, ever try to get the same investment advantages in one investment vehicle. Does not work. Have one for one purpose, one for another, etc. For example, gold and cash; stocks, gold and cash; bonds, cash and real estate, real estate, stocks and cash, etc., etc. in many combinations that work right for you(Cash means CD’s or MMF).

  •  
    0 0
    • OilyGasMiner
    • 43 Comments
    • My Website

    Nov 17 01:36 PM

    Peter, it seems our thoughts appear to align very well. Is it no surprise that the money supply is up over 100% over the past few months? According to Obama, TARP has already spent some $300B of the $750B. Hence money is being pumped at a RAPID pace into our withering economy.

    Reply |Report abuse

    I fully agree that this action coupled with the US debt increasing each day, will only result in furthe devaluation of the US. Dollar.

    We must recall that the massive sell offs in hedge funds aren’t usually voluntary and fund managers are being FORCED to sell because many investors believe that they are forced to sell. For example in Canada, investors with RRIFs, must pay taxes on at least $10,000 of their investment. However this value was determined at the start of the year, and with some portfolio’s down by over 50%. They are now actually paying taxes on 20% of their current portfolio. Due to the lack of transparent investment advice, we will continue to sell these massive sell offs take its toll on already undervalued equities. It is only a matter of months IMO before we see a commodity correction.

    And as we know “Concurrently, the U.S. Government runs large operating deficits in circumstances where its National Debt approximated $9.6 trillion at July 31, 2008, up from $9 trillion at December 31, 2007 and $6.2 trillion at December 31, 2006.”
    Quote Source: www.stockresearchporta…/

    The question is with the money supply increasing, debt increasing, unemployment increasing, foreclosures increasing, consumer confidence on the decline. How worse can things really get?

  •  
    0 0
    • User 30121
    • 269 Comments

    Nov 17 02:00 PM

    Sonofabitch! An article that TELLS IT LIKE IT IS! Oohhh, are you gonna catch hell from the nay sayers (anti-goldbugs). Thanks for saying it!
    Reply |Report abuse
  •  
    0 -1
    • Pangaea
    • 71 Comments

    Nov 17 02:13 PM

    A couple of problems with this article.

    Reply |Report abuse

    “The bottom for stocks will be the top for cash and treasury bonds.”

    At that eventual point, it might indeed be good for gold, but by definition it would also be attractive for stocks.

    Also, by any measure of money supply that I follow, it has been stagnant in recent months, not growing at all. This is what the Fed is trying to fight – shrinkage in the supply and velocity of money.

    research.stlouisfed.or…

    www.nowandfutures.com/…

    So until these trends end (money supply stagnation with deflation in all asset classes plus USD and Treasury strength), cash will remain king.


  •  
    0 0
    • theoilwizard
    • 1 Comment
    • My Website

    Nov 17 03:49 PM

    “In my opinion, commodity prices can possibly hit new lows in the upcoming months as the recession is still going on. There are a lot of uncertainties that are still at bay and till they have been cleared up, the economy will still be going downhill. Questions pertaining to increasing unemployment? Will the Govt bailout the US Automakers? How much are Corp taxes going to increase next year when Obama is in power? These uncertainties need to be solved before the market actually is stable for investors.

    Reply |Report abuse

    Hopefully you had found my insight helpful, I usually use the following website as a tool to gather all my data. Best of luck to all investors:
    www.stockresearchporta…;

  •  
    0 0
    • Marc Courtenay
    • 66 Comments
    • My Website

    Nov 17 09:16 PM

    We enjoy your articles and more importantly they help us keep things in their proper perspective. Keep them coming Peter, and thank you!!
    Reply |Report abuse
  •  
    0 0
    • huskerbob
    • 49 Comments

    Nov 18 02:18 AM

    pangaea: the coming bottom in the stock market doesn’t necessarily mean a bull market for equities.  The market could bounce along the bottom for the next decade or two (as it did before the last great bull market) while we deal with the consequences of this mess.
    And the Fed and it’s European counterpart are openly trying to weaken their respective currencies. It’s a struggle right now, but they will succeed mightily at some point!
    Gold is the enemy of inflation, and the gold market recognizes this. That is why central banks and their allies continue to fight the gold price, as all central banks must.
    Do yourself a favor and buy some artificially cheap gold. Get out of dollars while the gettin’s good!
    Reply |Report abuse

Share this:

  • Click to share on Reddit (Opens in new window) Reddit
  • Click to share on Facebook (Opens in new window) Facebook
  • Click to share on LinkedIn (Opens in new window) LinkedIn
  • More
  • Click to share on X (Opens in new window) X
  • Click to share on Pinterest (Opens in new window) Pinterest
  • Click to share on Tumblr (Opens in new window) Tumblr
  • Click to print (Opens in new window) Print
  • Click to email a link to a friend (Opens in new window) Email
Like Loading...

All the Gold in Saudi Arabia – Seeking Alpha

18 Tuesday Nov 2008

Posted by jschulmansr in commodities, Currency and Currencies, deflation, Finance, gold, hard assets, inflation, Investing, investments, Latest News, Markets, mining stocks, precious metals, silver, Today, U.S. Dollar, Uncategorized

≈ Comments Off on All the Gold in Saudi Arabia – Seeking Alpha

Tags

agricultural commodities, alternate energy, Austrian school, banking crisis, banks, bear market, bear stearns, Bollinger Bands, bull market, capitalism, central banks, China, Comex, commodities, communism, Copper, Currencies, currency, deflation, depression, diamonds, dollar denominated, dollar denominated investments, economic, economic trends, economy, financial, Forex, futures, futures markets, gold, gold miners, hard assets, heating oil, India, inflation, investments, market crash, Markets, mining companies, Moving Averages, natural gas, oil, palladium, physical gold, platinum, platinum miners, precious metals, price, price manipulation, prices, producers, production, protection, rare earth metals, recession, risk, run on banks, safety, Saudi Arabia, silver, silver miners, socialism, sovereign, spot, spot price, stagflation, Technical Analysis, timber, U.S. Dollar, volatility, Water

All the Gold in Saudi Arabia – Seeking Alpha

By: Tim Iacono

Tim’s blog: The Mess That Greenspan Made

There was a story out last week in the Gulf News about unprecedented gold buying in Saudi Arabia during the first half of November. According to the report, 13 billion Saudi riyals worth of the metal have been purchased in recent weeks – about $3.5 billion or roughly 140 tonnes at today’s prices.

A quick check of the SPDR Gold Shares ETF (NYSEArca:GLD) shows no similar buying over this time. In fact, the world’s most popular gold ETF has been noticeably quiet during this period, with just 0.3 tonnes exiting the trust earlier in the month, barely noticeable in the chart below.

It also looks like there’s another little wedge pattern forming at around $740 an ounce.
IMAGEThis report by Peter Cooper at ArabianMoney.net, which also appears at Seeking Alpha, lends some credibility to the story in the Gulf News, one of the leading English-language newspapers in the region:

I cannot verify the source but all I can say is that this has the hallmarks of a genuine story, based on my 25 years in financial journalism. First, it was buried on an inside page and the amount was given in UAE currency later in the story – hardly the action of somebody looking to manipulate the gold price, more an indication that the sub-editors did not understand the importance of this story.

Second, this is how the best stories emerge from Saudi Arabia – the market is not very transparent but insiders do notice big changes and pass this information on, and it surfaces as well sourced rumor. I am afraid this is about as good as it gets in the Middle East.

With local stock markets faltering badly and the property market in Dubai and elsewhere beginning what might be a truly spectacular fall, it makes sense that wealthy individuals would seek out more secure assets during this time of uncertainty.

Curious to see what this two-week purchase would look like when laid up against the inventory at the Gold ETF which, incidentally, just celebrated its four year anniversary, the chart below was created with the recent Saudi purchases indicated in yellow.
IMAGE

The 140 tonnes recently purchased in Saudi Arabia amount to about one-fifth the inventory that took four years to accumulate at the Gold ETF.

That’s a lot of gold in a very short period of time.

Full Disclosure: Long GLD at time of writing

Share this:

  • Click to share on Reddit (Opens in new window) Reddit
  • Click to share on Facebook (Opens in new window) Facebook
  • Click to share on LinkedIn (Opens in new window) LinkedIn
  • More
  • Click to share on X (Opens in new window) X
  • Click to share on Pinterest (Opens in new window) Pinterest
  • Click to share on Tumblr (Opens in new window) Tumblr
  • Click to print (Opens in new window) Print
  • Click to email a link to a friend (Opens in new window) Email
Like Loading...

Five Ways to Invest in Bottom-Basement Gold – Seeking Alpha

17 Monday Nov 2008

Posted by jschulmansr in commodities, Copper, Currency and Currencies, deflation, Finance, gold, hard assets, inflation, Investing, investments, Latest News, Markets, mining stocks, oil, precious metals, silver, Technical Analysis, Today, U.S. Dollar, Uncategorized

≈ 1 Comment

Tags

agricultural commodities, alternate energy, Austrian school, banking crisis, banks, bear market, bear stearns, Bollinger Bands, bull market, capitalism, central banks, China, Comex, commodities, communism, Copper, Currencies, currency, deflation, depression, diamonds, dollar denominated, dollar denominated investments, economic, economic trends, economy, financial, Forex, futures, futures markets, gold, gold miners, hard assets, heating oil, India, inflation, investments, market crash, Markets, mining companies, Moving Averages, natural gas, oil, palladium, physical gold, platinum, platinum miners, precious metals, price, price manipulation, prices, producers, production, protection, rare earth metals, recession, risk, run on banks, safety, silver, silver miners, socialism, sovereign, spot, spot price, stagflation, Technical Analysis, timber, U.S. Dollar, volatility, Water

Five Ways to Invest in Bottom-Basement Gold – Seeking Alpha

By Mike Caggeso  of Monday Morning

By Mike Caggeso

Gold hit two historic milestones in 2008.

First, in early March, the “yellow metal” hit its all-time high of $1,030 an ounce.

Just three months later, the price of gold for December delivery had plummeted to $681 an ounce, a 21-month low and 33.9% drop from its record high.

Most gold bugs were equal parts puzzled and brokenhearted. The world’s stock markets tanked, as did some of its biggest economies. In such an environment, they thought, gold should have risen. After all, gold is widely considered to be a safe-haven investment when everything else is spiraling south. 

However, Money Morning Contributing Editor Martin Hutchinson understood perfectly what other investors did not.

“Gold is not a safe haven against recession,” said Hutchinson. “It’s a safe haven against inflation.”

In the past year, commodities prices skyrocketed – across the board. That was especially true of oil, which hit a record high $147 a barrel. Corn, wheat, and soybeans all hit record highs, as well.

That price escalation tightened household and corporate budgets, and was a primary reason why the U.S. economy posted a gross-domestic product (GDP) decline of 0.3%. With that negative growth, the third quarter was the beginning of what many experts believe will be the nation’s first recession since 2001.

However, the inflation epidemic has waned significantly, as global demand for raw materials has plummeted. Price for such staple foods as corn, soybeans and wheat have all come down from their record highs – in near-lockstep fashion.

Corn futures are down nearly 50% from their summer high of $8 per bushel. The same is true of soybeans and wheat, with each having lost roughly half their value. In fact, wheat hit a 16-month low in mid-October.

As most of us noticed, gas prices have fallen 48% from their July 17 high of $4.114 a gallon.

And not coincidentally, gold has fallen 22% in that same time frame.

However, this report examines the pending commodities rebound – a projected slow-and-steady increase in commodity prices that will reverse the breakneck plunge below fair value that commodities have experienced for much of this year.

Our objective now: To chart the expected path of gold prices in the New Year.

This report also reveals another wild card inflationary indicator that Hutchinson believes will carry gold prices to $1,500 an ounce by the end of 2009.

Two Catalysts For Gold’s Climb

The U.S. Department of Agriculture’s Oct. 10 Crop Production Report said acreage for a handful of staple food commodities has shrunk:

  • Corn acreage fell 1.2%.
  • Soybean acreage dropped 1.4%.
  • Canola acreage dropped 1.9%.
  • Sunflower acreage shrank 0.8%.
  • And acreage of dry edible beans fell 0.7%.

That naturally translates to higher prices because it squeezes the supply of the particular commodity. And it does so at a time when demand continues to escalate from populations in China, India and Latin America. And higher prices equal inflation.

But Hutchinson – who correctly predicted this last run-up in gold prices – says there’s another catalyst that’s right now inherent in the U.S. economy that could help vault gold prices to $1,500 an ounce by the end of 2009. And it has to do with the much-ballyhooed $700 billion rescue plan.

The philosophy behind the rescue plan is elegantly simple: By providing a portion of the $700 billion to foundering U.S banks, the Treasury Department believed it could provide banks with badly needed capital, and get them to start lending money once again – jump-starting the economy in the process.

Since September 2007, U.S. Federal Reserve policymakers have cut the benchmark Federal Funds target rate nine times – from 5.25% down to the current 1.0% rate – to increase bank-to-bank lending and bank-to-consumer lending.

“The government is pumping money in so many banks, and that money has to come out somewhere,” Hutchinson said.

Right now, banks aren’t boosting lending. Instead, they are using the cash to finance buyouts of other banks. Even so, that money will “come out” into the economy in the form of higher stock prices for banks. That will make consumer/investors wealthier, and could make them more confident in the economy. If they’re more confident, they will spend. As that happens, food prices should begin ticking upward, adding another set of thrusters to gold prices.

“Everybody thinks that because we’re having a horrible recession, we’re not going to have inflation. I think that’s probably wrong,” Hutchinson said. “I think gold has quite good hidden-store value.”

As gold prices increase, count on more investors leaving the sidelines to invest, too, causing the surge in gold prices to accelerate and steepen.

“As gold goes up, it gets more popular and investors start piling into it,” Hutchinson said.  

And if gold gets anywhere near the $1,500 mark, sell. Prices that high will likely fall back or plateau as the Federal Reserve begins raising interest rates and strengthening the U.S. dollar, Hutchinson said.

Five Ways to Play Bottom-Basement Gold

Before we get too far ahead of ourselves, let’s first look at five ways to play bargain-basement gold prices.

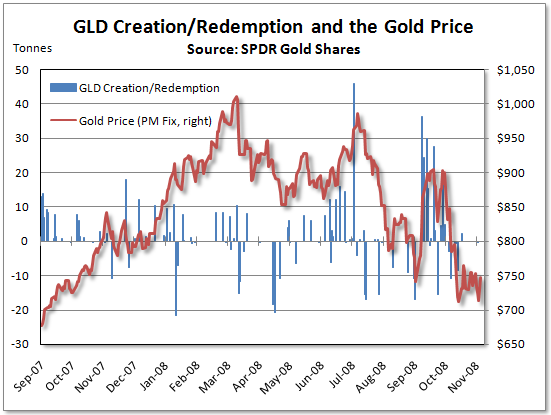
The SPDR Gold Trust ETF (GLD) – formerly StreetTracks Gold – is a fund whose shares are intended to parallel the movement of gold prices. Since gold prices started falling along with gas prices, SPDR Gold Trust has stayed within a 0.5% margin of gold prices. This exchange-traded fund (ETF) eliminates any investor concern over storage and delivery while giving them exactly what they want – gold.

Toronto-based Barrick Gold Corp. (ABX) has 27 mines, mostly in North America and South America, and is developing or exploring 11 more. With a market cap of more than $20 billion, it has considerably more liquidity than most mining companies. Barrick is primarily a gold miner, but it also has copper and zinc mining operations. As far as investors are concerned, there are two ways to look at that: It’s not a pure play, per se, but then again, this is a company stock, not a bar of bullion. Also, having operations other than gold can help stabilize the company’s bottom line in case problems arise at a gold mine.

Denver-based Newmont Mining Corp. (NEM) is primarily a gold producer with operations in the United States, Australia, Peru, Indonesia, Canada, New Zealand and Mexico. Its reserves are hovering around 86.5 million ounces. Like Barrick, this is a mining stock play, and is subject to market swings – as well as fluctuations in gold prices. That can be a significant tailwind, especially if you believe the stock market has bottomed out or is close to doing so. Hutchinson – forever a value-oriented investor – warned that Newmont might be a little too pricey now. Investors may want to wait for the company’s stock price to settle before getting in.

Hutchinson thinks the best value for a gold mining stock can be found in Yamana Gold Inc. (AUY), another Toronto-based company that’s small now, but has rapidly expanding production. 

But for investors who just want gold – not an ETF or stock – the best avenue is an EverBank Select Metals Account: EverBank accounts has a minimum deposit that is 98% lower than its competitors, and its commission costs are up to 86% lower than other metals’ brokers and bullion banks. It offers two types of gold accounts: Unallocated (your purchased gold is pooled with that of other investors, eliminating storage and maintenance costs; the minimum deposit is $5,000), and Allocated (you directly own the gold you purchase, held in your own private account; $7,500 is the minimum deposit here).

Both types of accounts can be set up 24/7 online. But if you prefer the phone, call 866-326-6241, and be sure to give them the code 12608 when setting up an account.

We should point out that the publisher of Money Morning has a marketing relationship with EverBank, but that’s because its products are among the best in class.

Original post

Share this:

  • Click to share on Reddit (Opens in new window) Reddit
  • Click to share on Facebook (Opens in new window) Facebook
  • Click to share on LinkedIn (Opens in new window) LinkedIn
  • More
  • Click to share on X (Opens in new window) X
  • Click to share on Pinterest (Opens in new window) Pinterest
  • Click to share on Tumblr (Opens in new window) Tumblr
  • Click to print (Opens in new window) Print
  • Click to email a link to a friend (Opens in new window) Email
Like Loading...

Simple Moving Averages Make Trends Stand Out

17 Monday Nov 2008

Posted by jschulmansr in Bollinger Bands, commodities, Copper, Currency and Currencies, deflation, Finance, gold, hard assets, inflation, Investing, investments, Latest News, Markets, mining stocks, Moving Averages, oil, precious metals, silver, Technical Analysis, Today, U.S. Dollar, Uncategorized, uranium, Water

≈ Comments Off on Simple Moving Averages Make Trends Stand Out

Tags

agricultural commodities, alternate energy, Austrian school, banking crisis, banks, bear market, bear stearns, Bollinger Bands, bull market, capitalism, central banks, China, Comex, commodities, communism, Copper, Currencies, currency, deflation, depression, diamonds, dollar denominated, dollar denominated investments, economic, economic trends, economy, financial, Forex, futures, futures markets, gold, gold miners, hard assets, heating oil, India, inflation, investments, market crash, Markets, mining companies, Moving Averages, natural gas, oil, palladium, physical gold, platinum, platinum miners, precious metals, price, price manipulation, prices, producers, production, protection, rare earth metals, recession, risk, run on banks, safety, silver, silver miners, socialism, sovereign, spot, spot price, stagflation, Technical Analysis, timber, U.S. Dollar, volatility, Water

Simple Moving Averages Make Trends Stand Out

By: John Devcic of BK TRADER FX    The 5 Things That Move The Currency Market

Moving averages are one of the most popular and often-used technical indicators. The moving average is easy to calculate and, once plotted on a chart, is a powerful visual trend-spotting tool. You will often hear about three types of moving average: simple, exponential and linear. The best place to start is by understanding the most basic: the simple moving average (SMA). Let’s take a look at this indicator and how it can help traders follow trends toward greater profits.

Trendlines
There can be no complete understanding of moving averages without an understanding of trends. A trend is simply a price that is continuing to move in a certain direction. There are only three real trends that a security can follow:

  • An uptrend, or bullish trend, means that the price is moving higher. 
  • A downtrend, or bearish trend, means the price is moving lower.  
  • A sideways trend, where the price is moving sideways.

The important thing to remember about trends is that prices rarely move in a straight line. Therefore, moving-average lines are used to help a trader more easily identify the direction of the trend. (For more advanced reading on this topic, see The Basics Of Bollinger Bands and Moving Average Envelopes: Refining A Popular Trading Tool.)

Moving Average Construction
The textbook definition of a moving average is an average price for a security using a specified time period. Let’s take the very popular 50-day moving average as an example. A 50-day moving average is calculated by taking the closing prices for the last 50 days of any security and adding them together. The result from the addition calculation is then divided by the number of periods, in this case 50. In order to continue to calculate the moving average on a daily basis, replace the oldest number with the most recent closing price and do the same math.

No matter how long or short of a moving average you are looking to plot, the basic calculations remain the same. The change will be in the number of closing prices you use. So, for example, a 200-day moving average is the closing price for 200 days summed together and then divided by 200. You will see all kinds of moving averages, from two-day moving averages to 250-day moving averages.

It is important to remember that you must have a certain number of closing prices to calculate the moving average. If a security is brand new or only a month old, you will not be able to do a 50-day moving average because you will not have a sufficient number of data points.

Also, it is important to note that we’ve chosen to use closing prices in the calculations, but moving averages can be calculated using monthly prices, weekly prices, opening prices or even intraday prices. (For more, see our Moving Averages tutorial.)

Figure 1: A simple moving average in Google Inc.
Source: StockCharts.com

Figure 1 is an example of a simple moving average on a stock chart of Google Inc. (Nasdaq:GOOG). The blue line represents a 50-day moving average. In the example above, you can see that the trend has been moving lower since late 2007. The price of Google shares fell below the 50-day moving average in January of 2008 and continued downward.

When the price crosses below a moving average, it can be used as a simple trading signal. A move below the moving average (as shown above) suggests that the bears are in control of the price action and that the asset will likely move lower. Conversely, a cross above a moving average suggests that the bulls are in control and that the price may be getting ready to make a move higher. (Read more in Track Stock Prices With Trendlines.)

Other Ways to Use Moving Averages           
Moving averages are used by many traders to not only identify a current trend but also as an entry and exit strategy. One of the simplest strategies relies on the crossing of two or more moving averages. The basic signal is given when the short-term average crosses above or below the longer term moving average. Two or more moving averages allow you to see a longer term trend compared to a shorter term moving average; it is also an easy method for determining whether the trend is gaining strength or if it is about to reverse. (For more on this method, read A Primer On The MACD.)

Figure 2: A long-term and shorter term moving average in Google Inc.
Source: StockCharts.com

Figure 2 uses two moving averages, one long-term (50-day, shown by the blue line) and the other shorter term (15-day, shown by the red line). This is the same Google chart shown in Figure 1, but with the addition of the two moving averages to illustrate the difference between the two lengths.

You’ll notice that the 50-day moving average is slower to adjust to price changes, because it uses more data points in its calculation. On the other hand, the 15-day moving average is quick to respond to price changes, because each value has a greater weighting in the calculation due to the relatively short time horizon. In this case, by using a cross strategy, you would watch for the 15-day average to cross below the 50-day moving average as an entry for a short position.

Figure 3: A three-month
Source: StockCharts.com

The above is a three-month chart of United States Oil (AMEX:USO) with two simple moving averages. The red line is the shorter, 15-day moving average, while the blue line represents the longer, 50-day moving average. Most traders will use the cross of the short-term moving average above the longer-term moving average to initiate a long position and identify the start of a bullish trend. (Learn more about applying this strategy in Trading The MACD Divergence.)

Support and Resistance
Support and resistance, or ceilings and floors, refer to the same thing in technical analysis.

  • Support is established when a price is trending downward. There is a point at which the selling pressure subsides and buyers are willing to step in. In other words, a floor is established.  
  • Resistance happens when a price is trending upward. There comes a point when the buying strength diminishes and the sellers step in. This would establish a ceiling. (For more explanation, read Support & Resistance Basics.)

In either case, a moving average may be able to signal an early support or resistance level. For example, if a security is drifting lower in an established uptrend, then it wouldn’t be surprising to see the stock find support at a long-term 200-day moving average. On the other hand, if the price is trending lower, many traders will watch for the stock to bounce off the resistance of major moving averages (50-day, 100-day, 200-day SMAs). (For more on using support and resistance to identify trends, read Trend-Spotting With The Accumulation/Distribution Line.)

Conclusion
Moving averages are powerful tools. A simple moving average is easy to calculate, which allows it to be employed fairly quickly and easily. A moving average’s greatest strength is its ability to help a trader identify a current trend or spot a possible trend reversal. Moving averages can also identify a level of support or resistance for the security, or act as a simple entry or exit signal. How you choose to use moving averages is entirely up to you.

For further reading on moving averages, check out Simple Moving Averages And Volume Rate-Of-Change and Basics Of Weighted Moving Averages.

by John Devcic, (Contact Author | Biography)

John Devcic is a freelance writer, market historian and private speculator. After investing in a mutual fund right out of high school and losing his initial investment of $350, Devcic began to believe he could do better with his money then the so-called experts could. Over the years a healthy and sometimes unhealthy obsession with how the markets work and how they worked in the past has made Devcic a true market historian. He reminds himself at all times that the market – while ever-changing – always seems to repeat itself.

Share this:

  • Click to share on Reddit (Opens in new window) Reddit
  • Click to share on Facebook (Opens in new window) Facebook
  • Click to share on LinkedIn (Opens in new window) LinkedIn
  • More
  • Click to share on X (Opens in new window) X
  • Click to share on Pinterest (Opens in new window) Pinterest
  • Click to share on Tumblr (Opens in new window) Tumblr
  • Click to print (Opens in new window) Print
  • Click to email a link to a friend (Opens in new window) Email
Like Loading...
Newer posts →

Authors

  • jschulmansr's avatar jschulmansr
    • Free Crypto!
    • Free Crypto Currency
    • This is Blessed!
    • Trump Rally Charleston
    • Trump Rally Charleston

Blog at WordPress.com.

Privacy & Cookies: This site uses cookies. By continuing to use this website, you agree to their use.
To find out more, including how to control cookies, see here: Cookie Policy
  • Subscribe Subscribed
    • Dare Something Worthy Today Too!
    • Already have a WordPress.com account? Log in now.
    • Dare Something Worthy Today Too!
    • Subscribe Subscribed
    • Sign up
    • Log in
    • Report this content
    • View site in Reader
    • Manage subscriptions
    • Collapse this bar
%d