• Recommended Sites & Links
  • About

Dare Something Worthy Today Too!

~ Gold & Precious Metals, Investing & Investments, Stocks and Stock Markets, Financial Markets & Market Timing, Technical Analysis, Oil and Energy Markets, Hard Assets Investing, Computers and Internet, SEO, Computer and Internet Security, Politics, Science, Christianity and much much more…

Dare Something Worthy Today Too!

Category Archives: Bollinger Bands

The Countdown Has Begun!

07 Friday Aug 2009

Posted by jschulmansr in 10 year Treasuries, 20 yr Treasuries, Bailout News, banking crisis, banking crisis banks bear market bull central deflation depression economic trends economy financial futures gold inflation crash Markets precious metals price protection recession safety silver plati, banks, bear market, Bear Trap, Bollinger Bands, bonds, bull market, capitalism, China, Comex, commodities, Contrarian, Copper, crash, Credit Default, Crude Oil, Currencies, currency, Currency and Currencies, CyberKnife, dollar denominated, dollar denominated investments, Dow Industrials, economic, Economic Recovery, economic trends, economy, Fed Fund Rate, Federal Deficit, federal reserve, Finance, financial, follow the money, follow the news, Forex, Fundamental Analysis, futures, futures markets, G-20, gata, GLD, gold, Gold Bullion, Gold Investments, gold miners, Gold Price Manipulation, How To Invest, How To Make Money, hyper-inflation, IAU, IMF, inflation, Investing, investments, Jschulmansr, Junior Gold Miners, Latest News, Long Bonds, majors, Make Money Investing, market crash, Markets, mid-tier, mining companies, mining stocks, NASDQ, oil, palladium, physical gold, platinum, platinum miners, precious metals, price, price manipulation, prices, producers, production, S&P 500, Short Bonds, silver, silver miners, Silver Price Manipulation, SLV, small caps, spot, spot price, stagflation, stock market, Stocks, TARP, Technical Analysis, The Fed, Tier 1, Tier 2, Tier 3, TIPS, Treasury, U.S., u.s. constitution, U.S. Dollar, U.S. Government unfunded Debt, U.S. Treasury Dept

≈ Comments Off on The Countdown Has Begun!

Tags

ANV, Austrian school, AUY, Bailout News, banking crisis, banking crisis banks bear market bull central deflation depression economic trends economy financial futures gold inflation crash Markets precious metals price protection recession safety silver plati, banks, bear market, Bollinger Bands Saudi Arabia, bonds, Brian Tang, bull market, CDE, CEF, central banks, China, cobalt, Comex, commodities, Copper, crash, Currencies, currency, Currency and Currencies, deflation, Dennis Gartman, depression, DGP, dollar denominated, dollar denominated investments, Doug Casey, economic, economic trends, economy, EGO, Federal Deficit, financial, Forex, FRG, futures, futures markets, gata, GDX, geothermal, GG, GLD, gold, Gold Bullion, Gold Investments, gold miners, Gold Price Manipulation, Green Energy, GTU, hard assets, HL, hyper-inflation, IAU, India, inflation, investments, Jeffrey Nichols, Jim Rogers, John Embry, Jschulmansr, Keith Fitz-Gerald, majors, Marc Faber, market crash, Markets, Michael Zielinski, mid-tier, mining companies, monetization, Moving Averages, NAK, NGC, NXG, PAL, palladium, Peter Grandich, Peter Schiff, physical gold, platinum, platinum miners, power, precious metals, price, price manipulation, prices, producers, production, protection, recession, risk, run on banks, safety, Sean Rakhimov, silver, silver miners, SLW, small caps, sovereign, spot, spot price, stagflation, SWC, Technical Analysis, TIPS, U.S., U.S. Dollar, volatility, warrants, XAU

The timer is ticking and drawing ever closer. The Markets are behaving just like I felt they would be. The (DJI) is making it’s final push while the broader market is starting to lag. We are almost at the top of the head in the head and shoulders pattern for the (DJI). Will it break 10,000? Personally I do not think so. The market rallied today on “funny” unemployment figures released by the government this morning. What happened to the 750,000 unemployed workers which have seemingly vanished? They certainly were not hired on new jobs! Where did they go? Add them back, you now have a more real picture of unemployment. Please keep your stop losses tight and be prepared to be stopped out.

Gold and Precious Metals… Like I said the timer is drawing down to zero. Keep accumulating and add on to your (DGP) positions too. Buy producers and those near production with proven reserves. I still see $1250 by year end for Gold, $25 for Silver and /or better! Buy now! Your Children and Grandchildren will Thank You!   Another stock I like is Apollo Gold (AGT), they recently have started production and are ramping up for more. At .45 cents a share you can get a nice position for a small investment. Another “Buy and Forget”. By the way I still also feel Silver will outperform Gold on a percentage basis (see article below).

Have a Great Weekend, I will be resuming regular daily posts as soon as I have finished setting up a couple of new web sites. My other vocation, I am also an Internet Marketer. Remember, set up as many multiple income streams as you can. Good Investing! -jschulmansr

Please Follow me on Twitter & FaceBook at: 
http://twitter.com/jschulmansr - Overall Markets and Trading Blog
http://twitter.com/daresomething - Politics
http://twitter.com/tweetsgold - Gold and Precious Metals
http://twitter.com/tweetsthecash - Internet Marketing and Affiliate Marketing
FaceBook http://facebook.com/jschulmansr 
Thanks Again!
Jeff aka jschulmansr

================================================

Claim a gram of FREE GOLD today, plus a special 18-page PDF report;

Exposed! Five Myths of the Gold Market and find out:

  • · Who’s been driving this record bull-run in gold?
  • · What Happens When Inflation Kicks In?
  • · Why most investors are WRONG about gold…
  • · When and How to buy gold — at low cost with no hassle!

Get this in-depth report now, plus a gram of free gold, at BullionVault

================================================

Subject: Two trending markets revisited and analyzed for you

Here is a video analysis of the S&P and Gold markets. The technical analysis was right on at the time, but those markets have changed quite a bit in the last few days. The S&P had a huge rally and Gold is climbing at a steady rate, so what’s the new analysis? Glad you asked!

Below are two free videos, one on Gold and one on the S&P, that gives us an in depth technical look into these markets. Again the videos are free and very informative. Just Click on the Links Below…

S&P Video Analysis:                                                    Gold Projections:

Also- Here’s your chance to analyze that stock you have been thinking about adding to your portfolio. Just enter the ticker of any company, name of a commodity, or forex pair and get your complimentary technical analysis. It cost you nothing and no payment info will ever be requested.

Click Here To Enter Your Symbol/s

==========================================

Insiders are Selling – MarketWatch

By: Mark Hulbert of Hulbert Financial Digest

ANNANDALE, Va. (MarketWatch) — Corporate insiders have recently been selling their companies’ shares at a greater pace than at any time since the top of the bull market in the fall of 2007.

Does that mean you should immediately start lightening your equity exposure?

It depends on whom you ask.

But, first, the data.

Corporate insiders are a company’s officers, directors and largest shareholders. They are required to report to the SEC whenever they buy or sell shares of their companies, and various research firms collect and analyze those transactions.

One is the Vickers Weekly Insider Report, published by Argus Research. In their latest issue, received Monday afternoon, Vickers reported that the ratio of insider selling to insider buying last week was 4.16-to-1, the highest the ratio has been since October 2007.

I don’t need to remind you that the 2002-2007 bull market topped out that month.

To be sure, the weekly insider data can be volatile, especially during periods like the summer, in which the overall volume of insider transactions can be quite light. That is one of the reasons why Vickers also calculates an eight-week average of the insider sell-to-buy ratio, and it currently stands at 2.69-to-1. That’s the highest that this eight-week ratio has been since November 2007.

To put the insiders’ recent selling into context, consider that in late April, the last time I devoted a column to the behavior of insiders (and when the rally that began on March 9 was still only six weeks old), the comparable eight-week sell-to-buy ratio was just 0.72-to-1. ( Read my April 27 column.)

Why, given this, shouldn’t we be running, not walking, to the exits?

May be you should, of course.

But, in deciding whether to do so, there are several other factors to consider.

The first reason to be at least a little bit skeptical of insiders’ current pessimism is that they, on balance, failed to anticipate the 2007-2009 bear market. On the contrary, as I reported on numerous occasions during that bear market, they were largely bullish throughout. The average recommended equity exposure of Vickers’ two model portfolios, for example, was around 90% from late 2007 through the early part of this year.

What makes insiders more worth listening to now than then?

It’s a fair enough question, of course. What those who are inclined to follow the insiders can say by way of response is that insiders, over the years, have been more right than wrong — even though by no means infallible.

Another reason not to immediately go to cash in response to insiders’ increased recent predisposition to sell their companies’ stock: They are often early.

In fact, Investors Intelligence, a newsletter edited by John Gray and Michael Burke, bases one of its market timing indicators on how the insiders were behaving 12 months previously.

A similar point was made earlier this week by Jonathan Moreland, editor of the Insider Insights newsletter. While acknowledging that recent insider behavior “seems totally inconsistent with this rally continuing unabated,” Moreland went on to argue that “it may take weeks or even months for insiders to be proven right. Money can be made in the meantime.”

The bottom line? Insiders are not always right. And even when they are right, they often are early.

Even so, it’s difficult to sugar-coat the recent increase in the pace of their selling,

Mark Hulbert is the founder of Hulbert Financial Digest in Annandale, Va. He has been tracking the advice of more than 160 financial newsletters since 1980.

===========================================

Fundamentals Are in Place For Silver To Move Higher – Seeking Alpha

Source: The Silver Analyst

The fundamentals are in place for silver and gold to move higher. The ongoing issuance of US treasuries and further quantitative easing by the Federal Reserve inevitably point to continued dollar weakness. The interesting fact that the Fed stepped in recently to indirectly buy some of the auctioned bonds points to a decreasing lack of investor appetite for US debt. That the Fed indulged in QE is no surprise – they announced that months ago. It was more the fact they had to step into the void created by the absence of buyers that was more telling. So much for the fundamentals – now what about the technicals of timing?

No doubt you are aware that the US Dollar Index has breached longer term support at 77.7 and is currently slogging to retrieve that level of support. We don’t think it will succeed but for how long it will hold out is as yet uncertain. The breach is slight and we are still looking for a decisive breach that will propel gold and silver higher. The chart below sums up the dollar situation with potential overhead resistance at 79.

Looking at silver, we are seeing a pattern emerge that suggests if the dollar breaks to the downside, silver will be targeting its former high of $21 though we are uncertain of it completely taking that high out in the medium term. Nevertheless a buying opportunity is present and as advised to subscribers, we already have gone long in July.

The question for those with positions is when to exit? The silver chart is shown below displaying the longer term trend in terms of months with the prospect of the upper channel being tested if the dollar falls through to its lower channel in the low 70s. As a guide, remember when the US Dollar fell to 70 in March 2008, silver went to $21.

Zooming into the daily charts, we see silver has begun a move up since mid-July not dissimilar to the moves up in February and June. Those moves lasted two to three months and we anticipate something of the same here. Note the support lines in the two prior moves and their similar angles of ascent. By way of projection I have copied the first trend line from February and superimposed it on the current move. It meets the longer term line of resistance at about $18. That is the kind of price action we hope silver will indulge us when the dollar breaks down further.

You will also note the Elliott wave notation. The last move up from April to June was a clear impulse wave and this current wave looks to be in a wave 3 now with all the upside potential that such a wave brings.

So the stage is set for some fireworks but to aid our silver and gold cause the resistance line on the US Dollar Index chart needs to hold. So far it is and next week should prove to be very interesting.

Disclosure: The Silver Analyst is long silver bullion!

============================================

Here is where I buy my Bullion, get one free gram of Gold just for opening an account! Catch the New Bull! – Buy Gold Online – Get 1 gram free just for opening account- just click here and then again on the Gold Bar!, no minimums – Buy Safely, quickly, and at low prices, guaranteed! – Bullion Vault.com

============================================

Gold Bullion Regaining Its Glitter – Seeking Alpha

By: Prieur du Plessis of Investment Postcards

Is gold bullion coming back to life? Should one read anything into the rise of 6.2% (+$56) since the yellow metal’s low of early July?

When it comes to gold bullion and gold stocks, I need to confess I started my investment career in 1984 as none other than a mining analyst. Ever since those days of calculating net present values on my trusted HP 12C I have been intrigued by the shenanigans of the yellow metal and related stocks. And I have also learnt over the years that one should never underestimate the ability of the gold price to surprise when least expected.

Admittedly, part of the improvement in the gold price can be ascribed to the fading US greenback, which declined by 3.9% over the same period. I always have more faith in gold’s rallies when they are not only a reflection of US dollar weakness, but gold is also appreciating in most currencies. This serves as an indication of increased investment demand and is a phenomenon one should keep an eye on as gold might just have started moving independently of the dollar over the past few days.

Considering the fundamental outlook for gold, a very comprehensive report was recently published by Austria’s Erste Group. The analysts list the positive and negative influences below, leading them to conclude that gold is only half-way through a secular bull market and offers an outstanding risk/return profile.

Negative factors:
• Clearly falling jewellery demand.
• Recessions are basically not a good environment for the gold price (the gold price gets stimulated at a later stage by the measures taken during the recession).
• Gold tends to be held as asset and cash of last resort, which means it is liquidated in extreme financial situations. Given that more than 70% of jewellery is bought on the Indian subcontinent, the supply of recycled gold might continue to rise.
• De-hedging is coming to an end.
• The futures positions (CoT) would suggest a short-term correction.

Positive aspects:
• The worldwide reflationary policy will continue for a while.
• Global USD reserves are excessive, and the need to diversify is enormous.
• De facto zero-interest policy in USA, Japan and Europe.
• Central banks have changed their attitude towards gold.
• Supply still in long-term downward trend.
• Investment demand will remain high; Wall Street has discovered gold.
• Commodity cycle has a long way to go.
• Geopolitical environment remains fragile.
• China will increase its gold reserves.

Gold’s technical picture is certainly looking up. This is explained by Adam Hewison of INO.com who prepared a short analysis of gold’s most likely direction. (The analysis was done on Tuesday, but is still as relevant today as it was then.)

Click here or on the image below to access the video presentation.

spot-gold-pic1

Seasonally, September also seems to be a good month for gold, with an average gain of 2.6% for the month since 1970.

gold-price-pic2

Source: Plexus Asset Management

I am bullish on gold in the medium term, especially as I believe the vast money printing by central banks could set off strong inflation pressures down the road. I will not be surprised to see bullion passing the infamous $1,000 resistance level over the next few weeks – a question of fifth time lucky – and I will be inclined to add bullion to my portfolio on pullbacks.

===================================================

Claim a gram of FREE GOLD today, plus a special 18-page PDF report;

Exposed! Five Myths of the Gold Market and find out:

  • · Who’s been driving this record bull-run in gold?
  • · What Happens When Inflation Kicks In?
  • · Why most investors are WRONG about gold…
  • · When and How to buy gold — at low cost with no hassle!

Get this in-depth report now, plus a gram of free gold, at BullionVault

====================================================

Nothing in today’s post should be considered as an offer to buy or sell any securities or other investments; it is presented for informational purposes only. As a good investor, consult your Investment Advisor/s, Do Your Due Diligence, Read All Prospectus/s and related information carefully before you make any investing decisions and/or investments. –  jschulmansr

Share this:

  • Reddit
  • Facebook
  • LinkedIn
  • More
  • Twitter
  • Pinterest
  • Tumblr
  • Print
  • Email

Like this:

Like Loading...

The Swan Dive- Next For Stocks?

14 Tuesday Apr 2009

Posted by jschulmansr in 10 year Treasuries, 20 yr Treasuries, agricultural commodities, ANV, Austrian school, AUY, Bailout News, banking crisis, banks, Barack Obama, bear market, Bear Trap, bilderbergers, Bollinger Bands, Bollinger Bands Saudi Arabia, bonds, Brian Tang, bull market, CDE, CEF, central banks, China, Comex, commodities, Contrarian, Copper, crash, Credit Default, Currencies, currency, Currency and Currencies, deflation, Dennis Gartman, depression, DGP, dollar denominated, dollar denominated investments, Doug Casey, Dow Industrials, economic, Economic Recovery, economic trends, economy, EGO, Fed Fund Rate, Federal Deficit, federal reserve, Finance, financial, follow the money, follow the news, Forex, FRG, Fundamental Analysis, futures, futures markets, G-20, gata, GDX, GG, GLD, gold, Gold Bullion, Gold Investments, gold miners, Gold Price Manipulation, GTU, hard assets, heating oil, HL, How To Invest, How To Make Money, hyper-inflation, IAU, India, inflation, investments, Jeffrey Nichols, Jim Rogers, John Embry, Jschulmansr, Junior Gold Miners, Keith Fitz-Gerald, Latest News, majors, Make Money Investing, Marc Faber, market crash, Markets, Michael Zielinski, mid-tier, mining companies, mining stocks, monetization, Moving Averages, NAK, natural gas, NGC, NXG, oil, PAL, palladium, Peter Grandich, Peter Schiff, physical gold, platinum, platinum miners, precious metals, price, price manipulation, prices, producers, production, protection, recession, risk, run on banks, S&P 500, safety, Sean Rakhimov, silver, silver miners, SLW, small caps, sovereign, spot, spot price, stagflation, Stimulus, stock market, Stocks, SWC, TARP, Technical Analysis, The Fed, Tier 1, Tier 2, Tier 3, TIPS, U.S., U.S. Dollar, volatility, warrants, XAU

≈ Comments Off on The Swan Dive- Next For Stocks?

Tags

ANV, Austrian school, AUY, Bailout News, banking crisis, banks, bear market, Bollinger Bands Saudi Arabia, bonds, Brian Tang, bull market, CDE, CEF, central banks, China, Comex, commodities, Copper, crash, Currencies, currency, Currency and Currencies, deflation, Dennis Gartman, depression, DGP, dollar denominated, dollar denominated investments, Doug Casey, economic, economic trends, economy, EGO, Federal Deficit, financial, Forex, FRG, futures, futures markets, gata, GDX, GG, GLD, gold, Gold Bullion, Gold Investments, gold miners, Gold Price Manipulation, GTU, hard assets, HL, hyper-inflation, IAU, India, inflation, investments, Jeffrey Nichols, Jim Rogers, John Embry, Keith Fitz-Gerald, majors, Marc Faber, market crash, Markets, Michael Zielinski, mid-tier, mining companies, monetization, Moving Averages, NAK, NGC, NXG, PAL, palladium, Peter Grandich, Peter Schiff, physical gold, platinum, platinum miners, precious metals, price, price manipulation, prices, producers, production, protection, recession, risk, run on banks, safety, Sean Rakhimov, silver, silver miners, SLW, small caps, sovereign, spot, spot price, stagflation, SWC, Technical Analysis, TIPS, U.S., U.S. Dollar, volatility, warrants, XAU

Well Mr. Obama said the same old, same old today and didn’t help the market at all… ANY of them! Mr. Obama what do you have against the market? I mean like your whole cabinet are all Good Ole Wall Street Boys!?! The Dow failed to maintain above 8000 today and that is a very bad sign or good depending which side of market you are on. It appears now the the intermediate wave (Elliott) is finished and stocks have climbed to the top of the diving platform. 1st attemp at a swan dive- difficulty easy. So wil it be a perfect 10 or a belly flop? Either Way the Dow is going down! My first target 7200-7500 and then a test of the 6500 level lows, (Called The “Bottom” recently). Gold and Precious Metals continue to consolidate getting ready to launch for a new test of $920, then $980, then the all time high. I think the news is going to be that bad and that dramatic. The Middle East is about to explode, N. Korea just threw out the inspectors, even the pirates are snubbing their noses at you Mr. Obama. So now the question is are you a man or a mouse? Squeak up! Copper is quietly having a nice rally, China is buying up all of our soybeans, and oil is getting ready to explode to the upside. Keep accumulating Gold and Precious Metals in any form, buy producers with production, you should jump into (DGP) with a little risk money too! In currencies my pick is the Aussie dollar, accumulate on dips because as Gold goes so will the Aussie Dollar. Good Investing! – jschulmansr

Follow Me on Twitter and be notified whenever I make a new post!


===================================================
Claim a gram of FREE GOLD today, plus a special 18-page PDF report;
Exposed! Five Myths of the Gold Market and find out:

·        Who’s been driving this record bull-run in gold?

·        What Happens When Inflation Kicks In?

·        Why most investors are WRONG about gold…

·        When and How to buy gold — at low cost with no hassle!

Get this in-depth report now, plus a gram of free gold, at BullionVault


===================================================

My Note: I use these tools and they are great and they work! – jschulmansr

Subject: Two trending markets revisited and analyzed for you


Last week I watched a video analysis of the S&P and Crude Oil markets. The technical analysis was right on at the time, but those markets have changed quite a bit in the last few days. The S&P had a huge rally and Crude seemed to steady out, so what’s the new analysis? Glad you asked!

Below are two free videos, one on Crude Oil and one on the S&P, that gives us an indepth technical look into these markets. Again the videos are free and very informatitive. Just Click on the Links Below…

          S&P Video Analysis:                                                    Crude Oil Projections:

Here’s your chance to analyze that stock you have been thinking about adding to your portfolio. Just enter the ticker of any company, name of a commodity, or forex pair and get your complimentary technical analysis. It cost you nothing and and no payment info will ever be requested.

Click Here To Enter Your Symbol/s

My Note: I use these tools and they are great and they work! – jschulmansr


===================================================

Pros Say: Sharp Market Pullback This Week – CNBC

Source: CNBC.com

Encouraging numbers from an investment banking giant dominated discussion among the pros, who tied them to massive government stimulus efforts — and doubted they would carry ahead to economic numbers, or even to results from other investment banks. 

Financials Show Surprising Strength; Consumers Still Look Weak

Scott Brown of Raymond James said there has been a real change in the attitudes and behavior of consumers, with fear now dominant. That is likely to be reflected in retail data this week, and there’s no likelihood that consumer spending will rebound any time soon.  (click to watch the video).

Stocks ended near their session lows Tuesday after a report showed retail sales unexpectedly dropped in March and as worries about banks simmered ahead of some key earnings.

The Dow Jones Industrial Average tumbled 137.63, or 1.7 percent, to close at 7,920.18. The S&P 500 lost 2 percent, while the Nasdaq skidded 1.7 percent.


Retail sales tumbled 1.1 percent

last month, a big disappointment as economists polled by Reuters had expected a 0.3-percent increase. Excluding the volatile auto component, sales fell 0.9 percent. The two prior months were revised upward, offering some consolation, but the unexpected sharp drop rattled the market.

“The inescapable fact is that the U.S. consumer is faced with daunting fundamentals: Wage and salary income growth has evaporated, credit is very tight, home prices continue to decline … [which] makes it very likely that the U.S. consumer will remain a drag on economic activity in coming quarters,” MFR economist Joshua Shapiro wrote in a note to clients. “Fiscal stimulus will help to blunt this, but is unlikely to turn the tide completely.”

Markets are Overbought; Retail Numbers = Long Way to Go

Disappointing retail sales numbers in March, after two stronger-than-expected months, show the consumer has not turned the corner after all, and may “go back in his cocoon,” according to Art Cashin of UBS.  The market is overbought and vulnerable to a pullback — perhaps even a sharp pullback over the next three days — with option expiration built in.  He is hopeful we have set the lows for the cycle, although those lows may be tested, and he foresees a lot of “sideways churning for maybe months.

My Note: Unfortunately if sideways churning includes testing those lows then I absolutely agree if those lows hold. Unfortunately, I don’t think they will, can you say DOW 4500? – jschulmansr

===================================================

Oil and Gold to Figure Large This Week – Seeking Alpha

By: Brad Zigler of Hard Assets Investor

Real-time Monetary Inflation (per annum): 7.9%


Easter Mondays leave Yanks more time to leisurely ponder the week’s trading prospects, as many global bourses are closed. We get to trade – and talk, as Linda Richman used to suggest – amongst ourselves.

Gold and oil naturally figure large in this week’s scenario. Particularly, oil over gold, if you’ve been listening to commodity maven Jim Rogers. Rogers thinks the International Monetary Fund [IMF] is a likely seller of some of its 3,200-ton metal stash, so he’s talking up black gold over yellow.

It’s not as if the world finds this surprising. Whether the IMF sales take place or not, the world’s been spoiling for a showdown between the two commodities.

Let’s look at oil first. The nearby crude contract gathered strength in its 50% retracement of the February-March rally, and is now poised to challenge the run-up’s $54.64 high.

Nearby NYMEX WTI Crude

Nearby NYMEX WTI Crude

True, near-term fundamentals still indicate oversupply. The re-growth in the contango tells you that. The quarterly carry trade was pinched to 80 cents a barrel a month ago; now it’s in the $4-5 range. If you’ve got a carrying charge market, you’ve got commodity enough to carry into future deliveries.

No, this has been a rally built more on expectations of improving economic prospects – hand-in-hand with the equity market rally – than on a supply retraction. Oil inventories at the Cushing, Okla., terminus may be down from their peak, but supplies in other regions have ballooned to more than compensate for the off-take.

Now, about gold …

Momentum and sentiment have turned sour for the yellow metal. But you probably suspected that, right? The recent 30,000-contract downdraft in COMEX open interest was led mostly by fund sellers. Net long positions held by large speculators tumbled more than 18% last week.

COMEX Nearby Gold

COMEX Nearby Gold

Technically, gold’s very vulnerable. Pushed to test its 100-day moving average on the downside and weighed down by overhead resistance at the $888 level – formerly support for the February-March topping action – the nearby market’s squeezed. Gold spreads (as mentioned in “Another ‘Make It Or Break It’ Hurdle For Gold“) indicate plenty of liquidity in the lease market. Supply’s not the issue for gold either. At least not yet.

Oil’s technical strength over gold is readily apparent in the gold/oil ratio. A rising ratio, meaning gold’s price is gaining on oil’s, is indicative of poorer economic conditions to come. A decline, not surprising, signals the market’s forecast of better prospects. The ratio’s been testing the 17-to-1 level over the past couple of weeks. An oil breakout could put this indicator on course to look for support at the 15-to-1 level.

Gold/Oil Ratio

Gold/Oil Ratio

It seems traders are essentially anticipating a reflation trade by making one of the primary engines of inflation, oil, their target rather than gold, inflation’s classic beneficiary.

This should be an interesting week.

===================================================

My Note: Brad you need to remember this time the Miner’s have started to begin the rally not the bullion market. When that happens Gold always rises. But with the producer’s/miner’s leading we will have a much stronger and deeper rally this time, I’m looking for $1200 – $1500 by year’s end! Have a Great Evening, don’t forget tomorrow is National Tea Party Day! – jschulmansr

===================================================

Nothing in today’s post should be considered as an offer to buy or sell any securities or other investments; it is presented for informational purposes only. As a good investor, consult your Investment Advisor/s, Do Your Due Diligence, Read All Prospectus/s and related information carefully before you make any investing decisions and/or investments. –  jschulmansr

Share this:

  • Reddit
  • Facebook
  • LinkedIn
  • More
  • Twitter
  • Pinterest
  • Tumblr
  • Print
  • Email

Like this:

Like Loading...

The Party Is Over For Stocks

30 Monday Mar 2009

Posted by jschulmansr in 10 year Treasuries, 20 yr Treasuries, ANV, Austrian school, AUY, Bailout News, banking crisis, banks, bear market, Bollinger Bands, Bollinger Bands Saudi Arabia, Brian Tang, bull market, CDE, CEF, central banks, China, Comex, commodities, Contrarian, Copper, Credit Default, Currencies, currency, Currency and Currencies, deflation, Dennis Gartman, depression, DGP, DGZ, dollar denominated, dollar denominated investments, Doug Casey, economic, Economic Recovery, economic trends, economy, EGO, Fed Fund Rate, Federal Deficit, federal reserve, Finance, financial, follow the news, Forex, FRG, Fundamental Analysis, futures, futures markets, gata, GDX, GG, GLD, gold, Gold Bullion, Gold Investments, gold miners, Gold Price Manipulation, GTU, hard assets, HL, How To Invest, How To Make Money, hyper-inflation, IAU, IMF, India, inflation, Investing, investments, Jeffrey Nichols, Jim Rogers, Jim Sinclair, John Embry, Jschulmansr, Junior Gold Miners, Keith Fitz-Gerald, Latest News, Long Bonds, majors, Make Money Investing, Marc Faber, Market Bubble, market crash, Markets, Michael Zielinski, mid-tier, mining companies, mining stocks, monetization, Moving Averages, NAK, NGC, NXG, oil, PAL, palladium, Peter Grandich, Peter Schiff, physical gold, platinum, platinum miners, precious metals, price, price manipulation, prices, producers, production, protection, recession, risk, run on banks, safety, Sean Rakhimov, Short Bonds, silver, silver miners, Silver Price Manipulation, SLW, small caps, sovereign, spot, spot price, stagflation, Stimulus, Stocks, SWC, TARP, Technical Analysis, The Fed, Tier 1, Tier 2, Tier 3, TIPS, U.S., U.S. Dollar, volatility, warrants, XAU

≈ Comments Off on The Party Is Over For Stocks

Tags

ANV, Austrian school, AUY, Bailout News, banking crisis, banks, bear market, Bollinger Bands Saudi Arabia, Brian Tang, bull market, CDE, CEF, central banks, China, Comex, commodities, Copper, Currencies, currency, deflation, Dennis Gartman, depression, DGP, dollar denominated, dollar denominated investments, Doug Casey, economic, economic trends, economy, EGO, Federal Deficit, financial, Forex, FRG, futures, futures markets, gata, GDX, GG, GLD, gold, gold miners, GTU, hard assets, HL, hyper-inflation, IAU, India, inflation, investments, Jeffrey Nichols, Jim Rogers, John Embry, Keith Fitz-Gerald, majors, Marc Faber, market crash, Markets, Michael Zielinski, mid-tier, mining companies, monetization, Moving Averages, NAK, NGC, NXG, PAL, palladium, Peter Grandich, Peter Schiff, physical gold, platinum, platinum miners, precious metals, price, price manipulation, prices, producers, production, protection, recession, risk, run on banks, safety, Sean Rakhimov, silver, silver miners, SLW, small caps, sovereign, spot, spot price, stagflation, SWC, Technical Analysis, TIPS, U.S., U.S. Dollar, volatility, warrants, XAU

Looks like the party is over! Major follow thru selling today, the Dow currently down 280 points and below 7500 at 7492. The resistance at 8000 was just to much and I think we have put in the top of this Bear Market rally/correction. As I mentioned before a lot of foolish sheeple are going to be panicking very quickly. I have been telling you to buy Gold and Precious Metals for a long time now and today’s articles will give you some more good reasons you should listen. Silver currently is flashing a Big BUY signal and when everything is said and done, I believe Silver will well outperform Gold on a percentage basis. I am using this opportunity to continue loading up on producers and I’m telling you, (CDE) Couer D’Alene Mines under a buck ($1) is looking mighty good! As always consult your financial advisor, read the prospectus, and do your due diligence before making any investments. Don’t be a “sheeple”. I also do my trend analysis thru INO.com and below is why… Good Investing! – jschulmansr – Follow Me on Twitter and be notified whenever I make a new post!

Subject: Two trending markets revisited and analyzed for you

Last week I watched a video analysis of the S&P and Crude Oil markets. The technical analysis was right on at the time, but those markets have changed quite a bit in the last few days. The S&P had a huge rally and Crude seemed to steady out, so what’s the new analysis? Glad you asked!

Below are two free videos, one on Crude Oil and one on the S&P, that gives us an indepth technical look into these markets. Again the videos are free and very informatitive. Just Click on the Links Below…

          S&P Video Analysis:                                Crude Oil Projections:

Here’s your chance to analyze that stock you have been thinking about adding to your portfolio. Just enter the ticker of any company, name of a commodity, or forex pair and get your complimentary technical analysis. It cost you nothing and and no payment info will ever be requested.

Click Here To Enter Your Symbol/s


=========================================================

Claim a gram of FREE GOLD today, plus a special 18-page PDF report; Exposed! Five Myths of the Gold Market and find out:

·        Who’s been driving this record bull-run in gold?

·        What Happens When Inflation Kicks In?

·        Why most investors are WRONG about gold…

·        When and How to buy gold — at low cost with no hassle!

Get this in-depth report now, plus a gram of free gold, at BullionVault

=========================================================

As History Repeats Itself, Time to Buy Gold and Silver – Seeking Alpha

By: Peter Cooper of Arabian Money.net


 History does not repeat but it does rhyme, said Mark Twain. For an excellent

assessment of what a stock market crash can mean for the future we have only to turn to The Great Crash 1929 by Professor JK Galbraith.

It is all there, a complete repeat of the run up to the stock market crash of last autumn, and its consequences – thus far. There was the Florida real estate crash as a prelude to the main act, and then a 50 per cent plunge in the Dow Jones in late 1929, just like the one in 2008.

March rally

March 1930 saw a huge rally in stock prices. March 2009 has just given us the biggest rally since 1974 (a previous market crash year). But hold on a minute, what does JK Galbraith tell us happened next?

In 1930 stocks weakened a little in April and then moved sideways into June when they plunged down again. Then they continued falling month after month for the next two years.

Our governments know this, and it does help explain the rush to push money into the economy by means fair and uncertain. The aim is clearly to break the cycle and avoid the down trend.

But will it be successful? Nobody really knows. Is it worth trying? Yes, but the evidence so far is that the Great Recession is tracking a course that is out-of-control, or rather following a pattern last seen in the 1930s.

Perhaps we should be more optimistic, and think that something more like the 1970s ‘lost decade’ is upon us. 1974 was a terrible year for global stock markets and was followed by stagflation – a mixture of low growth and high inflation.

Inflation

Indeed, inflation is the only way to bail out an economy consumed by debt. In the 1930s debt deflation was allowed to take its disastrous course with public spending cuts and trade barriers making an already deteriorating cycle considerably worse.

However, anybody who has just bought into the stock market rally should really think about selling and staying out for a while. This is a time to park money in gold and silver and even exit cash, although you might care to note that cash and precious metals were the best performing asset class of the 70s, while in the 30s gold was the real star.


=========================================================

Silver is Quietly Flashing a Buy Signal, But Buyer Beware- Seeking Alpha

By: Harold Goodman

Anyone who follows the silver market knows that the fundamentals of silver are incredibly strong, long term. Since most silver is mined as a byproduct of base metal mining, and base metal prices are currently depressed by the global recession, inventories of base metals are high, and silver supply is shrinking. Many less profitable mines are closing down. Silver recently went into backwardation, which could indicate delivery problems are imminent in the physical silver market.

The US government currently holds no silver bullion at all, down from five billion ounces immediately after WWII. Above ground silver supplies are currently estimated to be one billion ounces, compared to five billion ounces of gold. This includes silver in tableware, jewelry, and other sources that will never be available on the open market.

For the purposes of this analysis, I will use SLV, the silver ETF, because it is convenient and easy to chart, but keep in mind, this is paper silver, not bullion, and its investment characteristics are completely different. It is supposed to be backed by silver bullion, but if you read the fine print, it may also hold futures, cash, and is allocated to custodians and sub-custodians which cannot be audited. It is designed to track the spot price of silver, but when the spot price of silver falls significantly below the mean, you will find that physical silver dealers will increase their premium over spot rather than drop the price. Holders of SLV cannot demand delivery of the underlying physical silver bullion bars.

On August 25th, 2008 the 50 day moving average of SLV crossed and fell below the 200 day moving average. This is know by technical analysts as the “death cross” and signifies a coming fall in price. SLV closed that day at $13.33


On October 27th, the price of SLV closed at $8.85 during the panic selling of autumn 2008, a 33.6% drop in two months.

Last Friday, March 27th, 2009, for the first time since August 25th, the 50 day moving average of SLV crossed back above the 200 day MA, which could signal a coming runup in price. SLV closed at $13.15


I don’t know what term the technical analysts use for that, so I will call it the “life cross” until someone tells me the correct term.

If SLV’s 50 day MA stays above the 200 day MA, rather than bouncing off it, this is an extremely bullish sign for SLV, and astute investors should be keeping a close eye on it for the next week. But here’s the rub.

Silver is the most highly manipulated market in existence, bar none, and the price of silver has been suppressed for many years. Gold is second to silver. The reason that silver is first apparently is that it is a much smaller market than gold, and can be manipulated using a much smaller number of silver futures contracts. Gold prices can be suppressed both by shorting gold futures, and by actual bullion sales by central banks, but these sales are becoming fewer and smaller as central bank gold reserves are reportedly running low, and even those nations with ample supplies of bullion won’t be willing to part with it at the suppressed price, now that governments worldwide are printing money like it’s going out of style.

The best body of work on silver manipulation by far is the writings of Ted Butler, available here.

Check out his articles on February 8, 2009 and March 16, 2009.

Short term traders like to follow the 12 day EMA and 26 day EMA.

On July 29th, 2008 the 12 day EMA of SLV crossed below the 26 day EMA, signaling a coming drop in price. SLV closed that day at $17.19 Three months later, SLV hit its bottom of $8.85 on October 27th , a drop of 48.4% in three months.

On December 12th, 2008 the 12 day EMA of SLV crossed back above the 26 day EMA, signaling a coming runup in price, and has been above it ever since. SLV closed that day at $10.14

On February 23rd, 2009 SLV peaked out at $14.34, an increase of 41.4% in 2 ½ months.

On March 17th, 2009 the 12 day EMA of SLV bounced off the 26 day EMA, and has remained above it ever since, a bullish sign. SLV closed that day at $12.60, and its most recent close on March 27th was $13.15

If the 12 day EMA can stay above the 26 day EMA, look out above!

The following chart shows the long and short positions of various commodities on the Comex as reported by the CFTC for the week of March 16, 2009. Thanks to Mark J Lundeen for the chart. It shows that the net long/short position in silver is 100% short, compared to gold at 63%. I would consider this as prima facie evidence that the CFTC is not doing their job in preventing manipulation of the commercial silver market.

=========================================================


Concentrated Shorts Proven To Supress Gold and Silver – GATA

Source: GATA.org – Gold Anti-Trust Action Committee

Dear Friend of GATA and Gold (and Silver):

GATA Board of Directors member Adrian Douglas, editor of the Market Force Analysis letter (http://www.marketforceanalysis.com/), has combined data from the U.S. Commodity Futures Trading Commission and the Office of the Comptroller of the Currency to show that the suppression of the prices of gold and silver in the last several years correlates exactly with the growing concentration of the short positions held by two U.S. banks, JPMorgan Chase and HSBC.

Short of the official admissions of the gold price suppression scheme collected and published by GATA over the years, Douglas’ report is probably the best proof yet, and certainly the most detailed. Douglas’ report is titled “Pirates of the COMEX” and you can find it in PDF format at GATA’s Internet site here:

http://www.gata.org/files/PIRATES-OF-THE-COMEX.pdf

GATA’s supporters may be wearying of our many similar requests, but only persistence pays off, so we ask you to print copies of Douglas’ report and send them — by regular mail, not e-mail, which is ignored — to your U.S. senators and representatives with a covering letter requesting an explanation as to why nothing is being done to stop this market manipulation. For our friends outside the United States, please send copies with similar letters to your own national legislators.

CHRIS POWELL, Secretary/Treasurer
Gold Anti-Trust Action Committee Inc.

* * *

Help keep GATA going

GATA is a civil rights and educational organization based in the United States and tax-exempt under the U.S. Internal Revenue Code. Its e-mail dispatches are free, and

you can subscribe at:

http://www.gata.org

To contribute to GATA, please visit:

http://www.gata.org/node/16


=========================================================My note: As my friend Trader Dan says-

“Nothing will unnerve the paper gold shorts more quickly and do more to undercut their confidence than to strip them of the real metal and force them to come up with more hard gold bullion to make good on deliveries. “Stand and Deliver or Go Home” should be the rallying cry of the gold longs to the paper gold shorts.” –Trader Dan Norcini

I think it’s time for a “short squeeze” and take back some of the money the “pirates” have stolen

=========================================================

That’s it for now-Have a Great Monday!- Good Investing- jschulmansr

Follow Me on Twitter and be notified whenever I make a new post!=========================================================

Nothing in today’s post should be considered as an offer to buy or sell any securities or other investments; it is presented for informational purposes only. As a good investor, consult your Investment Advisor/s, Do Your Due Diligence, Read All Prospectus/s and related information carefully before you make any investing decisions and/or investments. –  jschulmansr


Share this:

  • Reddit
  • Facebook
  • LinkedIn
  • More
  • Twitter
  • Pinterest
  • Tumblr
  • Print
  • Email

Like this:

Like Loading...

The Battle is Still Raging!

24 Tuesday Mar 2009

Posted by jschulmansr in 10 year Treasuries, 20 yr Treasuries, ANV, Austrian school, AUY, Bailout News, banking crisis, banks, bear market, Bollinger Bands, Bollinger Bands Saudi Arabia, Brian Tang, bull market, capitalism, CDE, CEF, central banks, China, Comex, commodities, Contrarian, Copper, Currencies, currency, Currency and Currencies, deflation, Dennis Gartman, depression, DGP, dollar denominated, dollar denominated investments, Doug Casey, economic, Economic Recovery, economic trends, economy, EGO, Fed Fund Rate, Federal Deficit, federal reserve, financial, follow the news, Forex, FRG, Fundamental Analysis, futures, futures markets, gata, GDX, GG, GLD, gold, Gold Bullion, Gold Investments, gold miners, GTU, hard assets, HL, How To Invest, How To Make Money, hyper-inflation, IAU, IMF, India, inflation, investments, Jeffrey Nichols, Jim Rogers, John Embry, Jschulmansr, Junior Gold Miners, Keith Fitz-Gerald, Latest News, majors, Make Money Investing, Marc Faber, market crash, Markets, Michael Zielinski, mid-tier, mining companies, mining stocks, monetization, Moving Averages, NAK, NGC, NXG, oil, PAL, palladium, Peter Grandich, Peter Schiff, physical gold, platinum, platinum miners, precious metals, price, price manipulation, prices, producers, production, protection, recession, risk, run on banks, safety, Sean Rakhimov, Short Bonds, silver, silver miners, SLW, small caps, sovereign, spot, spot price, stagflation, Stimulus, Stocks, SWC, TARP, Technical Analysis, The Fed, Tier 1, Tier 2, Tier 3, TIPS, U.S., U.S. Dollar, volatility, warrants, XAU

≈ Comments Off on The Battle is Still Raging!

Tags

ANV, Austrian school, AUY, Bailout News, banking crisis, banks, bear market, Bollinger Bands Saudi Arabia, Brian Tang, bull market, CDE, CEF, central banks, China, Comex, commodities, Copper, Currencies, currency, deflation, Dennis Gartman, depression, DGP, dollar denominated, dollar denominated investments, Doug Casey, economic, economic trends, economy, EGO, Federal Deficit, financial, Forex, FRG, futures, futures markets, gata, GDX, GG, GLD, gold, gold miners, GTU, hard assets, HL, hyper-inflation, IAU, India, inflation, investments, Jeffrey Nichols, Jim Rogers, John Embry, Jschulmansr, Keith Fitz-Gerald, majors, Marc Faber, market crash, Markets, Michael Zielinski, mid-tier, mining companies, monetization, Moving Averages, NAK, NGC, NXG, PAL, palladium, Peter Grandich, Peter Schiff, physical gold, platinum, platinum miners, precious metals, price, price manipulation, prices, producers, production, protection, recession, risk, run on banks, safety, Sean Rakhimov, silver, silver miners, SLW, small caps, sovereign, spot, spot price, stagflation, SWC, Technical Analysis, TIPS, U.S., U.S. Dollar, volatility, warrants, XAU

My apologies for the 2 day gap in posts, was attending some high-level economic conferences and was unable to make any posts. Well the rest of the retracement has occurred for the Stock Market so we are at a citical juncture here. Personally I think this is a huge Bear Trap. It is a pretty normal bull retracement in a bear market. everyone wants to believe the bottom is in and I better get in now while I can before I “miss” it. Everyone keeps forgetting what is about to happen. The dreaded “I” word. The hidden tax on all of our money, inflation. If you listen carefully the ones “in the know” are already preparing for it. Today’s first article shows the fact that inflation is coming and our biggest holder of U.S. debt is growing very concerned. On the gold and precious metals charts we are seeing a drop today which I think is mostly exuberance spilling over from the stock market with investors seeling some of their Gold to play the Stock Market. We may have a head and shoulders forming after a double top which would be bearish for Precious Metals and convince a lot of weak knees to give up and exit out of the markets. However I think this is going to be a reverse of the Stock Market and prices are consolidating while waiting for the buig Inflation shoe to drop. For my own portfolio I am hanging tight and using this as an opportunity to accumulate more shares in the Precious Metals Producers, and also slowing shifing some funds back into Oil related investments. One market that has some real potential soon will be Natural Gas as it has been lagging so far behind Crude and Gasoline. Be Patient and choose wisely! On that note I have recently found and became a member of INO.com. With their patented “triangle  technology” trend analysis has never become easier! INO TV offers free – yes that’s right Free trading courses, news and video delivered right to your computer screen. INO Market Club offers  brand new talking charts- charts that actually talk to you! Awesome! Good Investing! – jschulmansr

Now Check this Out… Talking Charts!

========================================================

Sneak Peek At Our New

MarketClub Charts

March 20, 2009 · By Adam · Filed Under MarketClub Tips & Talk 

This week we have something very special to show you. We are pulling back the curtains to give you a sneak peek at MarketClub’s new charting program.

There’s nothing to buy, so all you have to do is look and listen. Did I say listen? How can you listen to a chart? Well, these patent pending charts include our new “Talking Chart” feature.

Can you imagine a chart that actually talks to you and tells exactly what’s going on in any market you are looking at or following?  Well, now you don’t have to imagine anymore as this is valuable feature is available at no extra cost in the latest version of MarketClub.

In addition to our “Talking Chart” feature, we have also improved our “Trade Triangle” technology so that it is even more powerful than before.

I think you’ll be impressed. Please take a few minutes out of your day to see how our new charts are revolutionary in many ways.

Please feel free to contact us on our blog about these new charts. We expected to go live with them any day now and you’re going to love them.

All the best,

Adam Hewison

President, INO.com
Co-creator, MarketClub


========================================================

Claim a gram of FREE GOLD today, plus a special 18-page PDF report;

 Exposed! Five Myths of the Gold Market and find out:

·        Who’s been driving this record bull-run in gold?

·        What Happens When Inflation Kicks In?

·        Why most investors are WRONG about gold…

·        When and How to buy gold — at low cost with no hassle!

Get this in-depth report now, plus a gram of free gold, at BullionVault

========================================================

Source: Financial Post

Drop U.S. dollar as reserve: China

IMF asset instead

Alan Wheatley, Reuters  Published: Tuesday, March 24, 2009

China proposed yesterday a sweeping overhaul of the global monetary system, outlining how the U. S. dollar could eventually be replaced as the world’s main reserve currency by the IMF’s Special Drawing Right.

The SDR is an international reserve asset created by the International Monetary Fund in 1969 that has the potential to act as a super-sovereign reserve currency, said Zhou Xiaochuan, governor of the People’s Bank of China.

“The role of the SDR has not been put into full play, due to limitations on its allocation and the scope of its uses. However, it serves as the light in the tunnel for the reform of the international monetary system,” he said.

Mr. Zhou diplomatically did not refer explicitly to the U. S. dollar. But his speech spells out Beijing’s dissatisfaction with the primacy of the U. S. currency, which Mr. Zhou says has led to increasingly frequent global financial crises since the collapse in 1971 of the Bretton Woods system of fixed but adjustable exchange rates.

“The price is becoming increasingly high, not only for the users, but also for the issuers of the reserve currencies. Although crisis may not necessarily be an intended result of the issuing authorities, it is an inevitable outcome of the institutional flaws,” Mr. Zhou said.

Jim O’Neill, chief economist at Goldman Sachs in London, said “over time, as the world is taken off the steroids of the over-leveraged U. S. consumer, you can’t have the same dollar dependence as we have had. But who can provide it? And the answer is, if it functioned properly, maybe the SDR could have a much bigger role,” he said.

A super-sovereign reserve currency would not only eliminate the risks inherent in fiat currencies such as the dollar — which are backed only by the credit of the issuing country, not by gold or silver — but would also make it possible to manage global liquidity, Mr. Zhou argued.

“When a country’s currency is no longer used as the yardstick for global trade and as the benchmark for other currencies, the exchange-rate policy of the country would be far more effective in adjusting economic imbalances. This will significantly reduce the risks of a future crisis.”

========================================================

My Note: If you read between the lines, this does not bode well for the Treasury and Fed Debt offerings which will have to be issued to pay for all of the bailout, Tarp, and economic stimulus packages. This also doesn’t bode well for the U.S. Dollar in particular, but the other currencies also. As the largest holder of our debt, China is not happy about their investments losing value as the dollar depreciates. Next, China along with Russia are both buying and adding to their respective gold reserves! They are expecting massive inflation, why are we not hearing any talk about that in the nightly news?-jschulmansr

========================================================
Gold Stocks’ Time To Shine- Seeking Alpha
By: Brad Zigler of Hard Assets Investor

Real-time Inflation Indicator (per annum): 8.6%
In a recent column (“Gold Traders Whipsawed” at), we said we’d let you know when the gold/mining stock ratio tipped in favor of the miners. Well, we’re telling you now. The GLD/GDX ratio decisively broke through its 200-day moving average late last week.
The SPDR Gold Shares Trust (NYSE Arca: GLD) is a grantor trust affording its holders an undivided interest in vault bullion. The Market Vectors Gold Miners Index ETF (NYSE Arca: GDX) is a portfolio comprising nearly three dozen mining issues. With GLD’s price in the numerator, a decline in the quotient represents appreciation in gold stocks relative to gold itself.


Gold (GLD)/Gold Stocks (GDX) Ratio

Gold (<a href=

Both bullion and mining shares are higher for the year – GLD’s up 8.2% and GDX has risen 10.8% – but the momentum, for now at least, is with equities. Buoyancy in the broader equity market is providing lift for the miners, but it’s good to keep in mind that there’s a 75% correlation between GDX and GLD. Gold is, for the most part, gold.

Gold’s rising price has a leveraged effect on the stocks, as every dollar above a miner’s production cost flows to its bottom line.

Back in February, we highlighted one GDX component with very low production costs (“A Particularly Healthy Gold Stock“).

Is this the time to buy miners? Well, if you believe there’s more upside in gold (keep that correlation in mind) and want to ride the draft of the current equity market rally, perhaps. Taking a whack at GDX removes some of the stock-picking risk.

Reflation Update: The Real-time Inflation Indicator spiked 1.3% higher last week, reaching a level not seen since January.

========================================================

Gold Holders – Be Patient – Seeking Alpha

By: Jordan Roy-Byrne of Trendsman Research

In the wake of the Fed’s announced record monetization, some gold bugs remarked about the significance of the date and decision. Moreover, the airwaves were littered with commodity bulls (not the familiar faces). There were a few non-gold bug analysts on live television showing currency from Zimbabwe and relating the Fed decision to what has transpired in Zimbabwe. Hyperbole aside, Fed policy of currency debasement and inflation of the money supply is hardly anything new. News is important in that it highlights and reinforces trends. It doesn’t create them.
Keen market watchers and seasoned Fed observers were hardly surprised at the Fed action. We all knew it was coming. The question was when. Remember, news highlights trends. Commodities had been forming a bottom for five months. Just two weeks prior we wrote about our positive near term view on commodities. How about Gold? It rose from trough to peak over 40% in just four months. It seems that only the shorts were surprised.
Now to expound upon last week’s missive, reflation isn’t always so advantageous for the precious metals, especially gold. That holds true for both the economy and markets. With stocks and commodities now recovering, money is to be put to work in those markets and also potentially diverted away from gold. We aren’t expecting a full-blown correction in Gold but rather a consolidation that, for a matter of time diverts attention (like an idling engine) away from itself as it prepares for major liftoff.
This is a temporary respite in a bear market and in an economy stuck in deflation. The first period of deflation (and strengthening dollar) in the Great Depression lasted three years. The Yen increased nearly 100% from early 1990 to early 1995. This bout of deflation isn’t even one year old yet. In other words, don’t expect commodities to enter a cyclical bull market anytime soon. There isn’t enough demand on the horizon. The recession and accompanying deflation should last into 2010. It may be a while before both run their course, thereby allowing an inflationary recovery to begin in earnest.

In conclusion, be aware that the current rebound in stocks and commodities, though large, is just a temporary recovery. A single news event won’t change that nor alleviate the current deflationary pressures on the economy. Finally, holders of gold and gold shares should be patient. The major breakout will occur this year, though not within the time expectations of the gold bugs.

========================================================

My Note: When Gold and Precious Metals prices do take off and they will, it will be faster than anyone has anticipated. Use this time to buy now, increase your holdings. -Good Investing – Jschulmansr

Follow Me on Twitter and be notified whenever I make a new post!

========================================================
Claim a gram of FREE GOLD today, plus a special 18-page PDF report; Exposed! Five Myths of the Gold Market and find out:

·        Who’s been driving this record bull-run in gold?

·        What Happens When Inflation Kicks In?

·        Why most investors are WRONG about gold…

·        When and How to buy gold — at low cost with no hassle!

Get this in-depth report now, plus a gram of free gold, at BullionVault

========================================================

Nothing in today’s post should be considered as an offer to buy or sell any securities or other investments; it is presented for informational purposes only. As a good investor, consult your Investment Advisor/s, Do Your Due Diligence, Read All Prospectus/s and related information carefully before you make any investing decisions and/or investments. –  jschulmansr


Share this:

  • Reddit
  • Facebook
  • LinkedIn
  • More
  • Twitter
  • Pinterest
  • Tumblr
  • Print
  • Email

Like this:

Like Loading...

Today’s Technical Corner – Gold Whats Next?

28 Wednesday Jan 2009

Posted by jschulmansr in agricultural commodities, Bailout News, banking crisis, banks, bear market, Bollinger Bands, bull market, capitalism, central banks, China, Comex, Copper, Currencies, currency, Currency and Currencies, deflation, depression, dollar denominated, dollar denominated investments, economic, Economic Recovery, economic trends, economy, Federal Deficit, Finance, financial, Forex, Fundamental Analysis, futures, futures markets, gold, Gold Bullion, Gold Investments, gold miners, hard assets, How To Invest, How To Make Money, India, inflation, Investing, investments, Jim Sinclair, Junior Gold Miners, Latest News, Make Money Investing, market crash, Markets, mining companies, mining stocks, Moving Averages, oil, palladium, physical gold, platinum, platinum miners, precious metals, price, price manipulation, prices, producers, production, silver, silver miners, small caps, spot, spot price, stagflation, Stimulus, Stocks, TARP, Technical Analysis, U.S. Dollar, Uncategorized

≈ 1 Comment

As I write Gold is currently down $10.80 at $886.90, taking a much needed breather from its recent upward thrust. If Gold can hold and consolidate around this level the next target will be $920 and then $950. Today’s post contains articles on how to trade gold for those who don’t like risk, much tecnical analysis and more… -jschulmansr

==============================================

Catch the New Bull! – Buy Gold Online – Safely, quickly, and at low prices, guaranteed! Bullion Vault.com

==================================================

A Guide To Buying Gold for the Risk Averse – Seeking Alpha

By: J Clinton Hill of Hillbent.com


Lately, there has been plenty of talk about gold and a growing consensus that favors bullish fundamentals. Here’s my take on gold based upon the Spyder Gold Trust ETF (GLD) and its most recent wave, i.e. from its 1-15-09 bottom at 78.87 to its 1-26-09 top at 90.19.


Catch the New Bull! – Buy Gold Online – Safely, quickly, and at low prices, guaranteed! Bullion Vault.com

================================================.

That’s it for today click on one of the subscribe buttons to receive all the latest news for Gold and Precious Metals, and much more!

Good Investing! – Jschulmansr


Nothing in today’s post should be considered as an offer to buy or sell any securities or other investments, it is presented for informational purposes only. As a good investor, consult your Investment Advisor, Do Your Due Diligence, Read All Prospectus/s and related information carefully before you make any investments. –  jschulmansr


Catch the New Bull! – Buy Gold Online – Safely, quickly, and at low prices, guaranteed! Bullion Vault.com

============================================

Hourly Action In Gold From Trader Dan

Source: Trader Dan Norcini of JRMineset

Gold appears to have run into resistance near the $920 level which is blocking its upward path for now. Since we know that the funds are purely technical traders and have been buying, both adding new longs and for those who were short, getting out by covering, while open interest has been steadily increasing, it is safe to say that the bullion banks are the ones blocking the upward trajectory. Nothing new there and it does not take much observation for those who have been watching gold the last 8 years to know this.

The inability of the mining shares to continue higher yesterday, even in the face of a much higher bullion price, gave some paper longs at the Comex a reason to cash in some profits and emboldened the bears to dig in their heels.

To show you how fickle these markets have become, do you remember when gold was following the equity markets around not all that long ago. They went down – it went down. They went up – it went up. It was all about the famous “risk aversion” or deleveraging trade. Now the exact opposite seems to be happening. The equities go up and gold goes down. Well guess what they have come up with to now explain this turn of events? Yes – risk aversion!

Here’s the latest – equities are going up because supposedly some of the news from the banking sector is not as dire as many have come to expect. The bearish sentiment in the equity markets is misplaced. Gold has been going up because of banking sector fears and currency risk. Ergo – gold should now go down as those fears are overblown because the risk averse psychology has become too excessive. In other words – all’s clear and the water is just lovely so dive on in!

I could not make this stuff up if I tried.

Had enough – how about this one?  – Gold has now broken its relation to the Dollar. The fact that the Dollar was being bid up was evidence of a panic into safety. Now that the Dollar is going down it means that the panic is subsiding. Therefore gold should go down as well which means the inverse relationship between gold and the Dollar has been severed.

Again, I am just repeating the latest mantra du jour.

Just wait and see – when gold starts going up as the Dollar starts going down the same guys who came up with the latest explanations will be singing how the historic relationship between gold and the Dollar has been restored once again. No matter what happens – they will have proven to be right! Geniuses all!

It reminds me of the global warming crowd. When droughts were springing up and record highs were being shattered it was called global warming. When record snowfalls suddenly showed up and record lows were being set as people all over the globe freezing their keisters off,  it morphed into climate change. No matter which way the temperatures go, that crowd will always be right! Shame on you climate destroyers for not cramming your family into something that more closely resembles a go-kart rather than an automobile on your assorted trips around town. If you had any concern for the planet you would be riding a horse to work. Then again that creature gives off methane gas which is actually being seriously considered as a pollutant and thus liable to be taxed by the idiots in Washington DC, so no matter what you do, you are royally screwed. It’s too bad that there remains no undiscovered country where freedom loving people who believe in honest money and limited government could sail off to and found a nation where the money changers and government control freaks would be banned from entering.

By the way, did you notice that the new President just signed the death sentence for the US automotive industry yesterday by mandating new mileage efficiency standards – all in the name of saving us from a problem that does not exist? Yep – nothing like telling an industry already on life support that their most profitable units, the bigger and safer vehicles, will have to go in favor of smaller, less profitable ones. Don’t touch the unions however whose demands have forced the US auto industry into concentrating their efforts on the more profitable lines (the larger vehicles) in an effort to offset the financial drain imposed upon them by the exorbitant salaries and benefits that they are forced to pay these same unionized workers.

Remember that big move up in Copper yesterday? Remember how the existing home sales number ran all the shorts out and pushed the market right into technical chart resistance threatening an upside breakout? Well, that is history today as it went “KERPLUNK”! To show you how utterly insane these markets have become and the farce that the hedge funds have turned them into, consider this – Copper closed at 1.4720 on Friday. On Monday it rallied sharply blasting upwards closing at 1.5865 reaching a high of 1.6310. Today it collapsed making a low of 1.4545 and closed at 1.4850, down 10 cents a pound. In other words, it went NO WHERE in TWO DAYS but in the process it careened all over the place blowing out upside buy stops before triggering a wave of downside sell stops today. And to think this hedge-fund created madness has become the price discovery mechanism by which commercial producers and end users are somehow supposed to be able to enter into contracts and hedge risk to ensure profitability. I have been watching these futures markets for more than 20 years and I have never seen such idiocy. This is what happens when computers have taken over trading decisions based on nothing but the latest price tick. I know it sounds excessive to some, but I honestly have come to believe that the entire futures industry is very close to being destroyed by these out of control hedge funds. A commercial entity simply cannot use these markets to hedge and without commercials these markets cannot survive since they will serve no useful purpose whatsoever as all that will be left is hedge funds trading their algorithms against the algorithms of other hedge funds with the commercials using forward contracts amongst themselves and bypassing the futures markets altogether.

Back to gold – technically gold still looks very good although it has stalled just below the $920 level. Ideally, it would hold support on any subsequent RE-test of the Downsloping trendline of the wedge formation on the weekly chart which is drawn off the July and October highs. That comes in near the $880 level. I would prefer to see it consolidate above the $880 level but would view an ability to hold above the $870 level as still friendly. Failure at $870 would give the shorts enough impetus to try to shove it back to $850- $840.

Upside resistance remains near $920 while more formidable resistance comes in near the $945-$950 region. That corresponds to both Downsloping trendline resistance drawn off the peak high made back in early 2008 and the July high which also happens to be the highs made back in October last year. Those are the parameters we are working with technically.

On the daily chart, all of the major moving averages, including the 100 day moving average are all now trending solidly upwards. The 10 day is close to making a bullish upside crossover of the 20 day which will give some trend following funds a reason to buy while the RSI remains below the 70 level. So we have room to run to the upside IF, and this is a big IF, the market can push through the bullion bank selling near $920. The inability of the mining shares to continue moving higher does concern me however. In an ideal bullish environment for gold, the shares move higher alongside the bullion price.

It looks to me like the weakness in crude oil today is contributing some downward pressure in gold as many of those fund algorithms use its price action as a factor in their selling or buying of commodities. Weaker crude oil prices give rise to the deflation scenario and that still leads some to sell gold because of misguided notions of how it will perform during periods of general price deflation. Again, gold is primarily a currency – not a commodity, and it will rise when faith in paper currencies falters, all of the arguments of the deflationists notwithstanding. When governments slash interest rates to NOTHING and issue more and more paper IOU’s, the sheer supply guarantees that they will lose value meaning that investors seeking wealth preservation are buying scraps of paper that pay zero return and lose any “value” that they might have once possessed. Gold thrives in such periods as it is solid, substantial and cannot be diluted by conniving Central Bankers. Which would you rather have in your hand during times of financial chaos and upheaval – a promise by a politician or a metal which has stood the test of 6,000 years? If you have any problem making a decision, I suggest you take a good look at the price chart of the British Pound and especially the price of gold in Sterling terms.

The HUI and the XAU were unable to manage strong closes above their former double tops make back in mid-December of last year and early January of this year in yesterday’s session meeting up with selling from the opening bell and never quite being able to shrug that off. Still, their charts look good as they are consolidating right around that former double top. I would like to see them hold above the 10 and 20 day moving averages near the 115 – 116 level in the XAU and 279 – 282 in the HUI.

Bonds finally saw an up day today which is to be expected given the beating that they have taken of late. The downdraft in bonds could be called “parabolic in reverse”. Jim likes to call it a “waterfall”, which is an apt description considering the fact that if one were long while this has occurred, they have indeed taken a bath in their trading accounts or better yet, drowned under a sea of red ink.

The Dollar is generally weaker today although it has bobbed back and forth between a small gain and a small loss. The charts still appear to show a technical failure near the 88 level. It is treading water above the 50 day moving average (barely) while the 100 day lies near the 83.50 level. A breach of that level and it should move back down to retest 80.

Click chart to enlarge today’s hourly action in Gold in PDF format with commentary from Trader Dan Norcini

January2709Gold1230pmCDT.jpg

===========================================================

1. Before 2009 is out the next major economic shock will become obvious. There is not one major funded retirement program intact thanks to the manufacturers and distributors of OTC derivatives. The unfunded ones are a total loss. Retirement in the future is totally out of the question. Many now retired will end up in the same situation as those trying to live off fixed income. Both categories are being culled from the human gene pool.
 
2. By my 68th birthday Obama will recognize his position as a bagged President, knowing then that the economic situation does not have any practical solution.
 
3. By July 4th, 2009 the rally in the US dollar will have become a simple hope for the lows to hold.
 
4. My long held targets of $1250 and $1650 for Gold that were once laughed at as outrageously high can now be laughed at for being painfully too low.
 
5. Only gold and related shares are insurance against the economic cataclysm now taking place.

Everyone is looking for where and when the top in gold will come. Will it be Jim’s $1650 or Alf Field’s $10,000 plus before it comes back down?
 
To put it nicely, you are all wrong. Gold is going up and STAYING up.
 
There is no top to look for because like all things people strive for, the top does not exist.
 
Gold will trade within $200 of a given point as a product of the Master of the Financial Universe, Paul Volcker, taking control when all this is totally out of control. He will instate the revitalized and modernized Federal Reserve Gold Certificate Ratio, not gold convertibility, and not tied to interest rates as an automaticity. Only then can Volcker put in place policy backed by the sitting administration that has a provable history of starting the change from deficit to surplus, his price of saving the world one more time.
 
The Gold mining business will then be the best business there is and the highest dividend paying monetary utility.
 
Respectfully yours,
Jim
=========================================================

Catch the New Bull! – Buy Gold Online – Safely, quickly, and at low prices, guaranteed! Bullion Vault.com

==================================================

The Resurgence of Junior Gold Miners – Seeking Alpha

Junior mining stocks were all the rage back in the early stages of the gold bull market. During the time frame of 2002-2006 many junior miners were putting in annual gains of 200%, 300% or more. Some junior miners like Seabridge Gold (SA) produced 3-year returns in excess of 1500%! It seemed like you could close your eyes and randomly point your finger at a list of junior gold miners, buy the stock and sell a few weeks later for a gain of 30% or more. No feasibility study, no permits, no management experience or path to production… no problem!

But volatile stocks are volatile in both directions and when the gold market corrected, junior miners lost all of those gains and then some. Amateur investors that were patting themselves on the back and recommending investments to their buddies based on their recent success were caught off-guard by the severity of the decline in the junior mining sector and suddenly found that they gave back most or all of their gains. To be sure, some booked profits and got out before the ship sank, but most were caught unsuspecting and unwilling to believe the party could be over so quickly. Many junior miners lost 80% or more of their market cap during the past year or two.

Precious metals investors have a sour taste in their mouth in regards to junior miners and have largely dismissed the entire sector as too risky. For many investors, junior miners have been removed from their portfolios, watch lists and consideration set for future investments. Newsletter writers and analysts that couldn’t contain their excitement over the next “5-bagger” rarely mention a word about juniors these days. While much of this condemnation is warranted, I think we should be careful not to throw the baby out with the bath water.

While I will acknowledge that 75% or more of junior mining companies are not good investments and many will go out of business with credit markets contracting, there are still quite a few impressive juniors that deserve a second look now that the dust has settled. Mine production is decreasing and the larger miners will need to acquire junior miners with quality properties in order to add to their pipeline and keep their production numbers growing. After a massive sell-off that brought the entire sector crashing down, some of the most promising juniors have finished a bottoming pattern, consolidated and have already began moving up very impressively. Cash-strapped investors and weak hands have been shaken free of their junior mining shares as the focus has shifted to more “safe” and liquid investments. Has this produced an opportunity for savvy precious metals investors to pick up quality mining companies at undervalued prices? Here are my main criteria for selecting which junior mining companies are worth my investment dollars.

  1. Already producing or moving toward production in the next 1-2 years
  2. Quality properties in politically-stable areas with necessary road access
  3. Proven and probable resources that justify a higher market cap
  4. Seasoned management that has a track record of bringing projects to production
  5. Healthy balance sheet with cash on hand and/or the ability to raise capital easily

Many of the companies that meet most or all of the criteria above have already bottomed and are quietly posting exceptional gains that outpace those of the major producers. Even with today’s decline in gold equities, many of my favorite juniors are up 100% or more since their respective Q4 2008 lows. A few of these companies were recommended in the premium subscription service and have been masked out of respect to paying subscribers. All of the gains listed below were produced in just 1-3 months and illustrate the explosion in junior miners that most analysts and newsletter writers seem to be missing.

click to enlarge

As the entire gold and silver sector has done well over the time period, I have included the PHLX Gold and Silver Index (XAU) index at the bottom for comparison sake. While the XAU is up 85%, the average gain for the junior mining companies that we track over the same time period is 171% or double the gain of XAU. Junior miners are not only joining in this latest rally, they are leading the rally and gaining at twice the pace of the major gold mining companies.

Those that are comfortable with a higher risk/reward proposition might want to take a second look at junior mining companies during 2009. If the trend continues or accelerates as investors warm back up to juniors, we could see the return of another explosive few years for junior mining companies as gold pushes above $1,000 on its way towards its inflation-adjusted high of $2,300.

Catch the New Bull! – Buy Gold Online – Safely, quickly, and at low prices, guaranteed! Bullion Vault.com

===================================================

Now From One of the Masters’ Himself Jim Sinclair

Jim’s Outlook On 2009


First, to keep things in proper perspective, GLD has already appreciated 27% since Nov 12, 2008. Also, let us not forget that central banks have a perverted sense of humor and plenty of “funny money” and other diversionary tricks up their sleeves to defer the inevitable arrival of inflation. With this as our background, I will jump right into my strategic analysis for trading or investing in gold.

GLD hit resistance at 90.19, has retreated and appears headed to test support at 86.50 with the possibility of also filling a minor gap at the 85 level.

If support holds, the natural inclination is to buy (entry at 86.75 with a stop loss at 84.12 for -3% maximum loss). Assuming one is playing this trade for an exit at its most recent resistance, i.e. at 90.19, the risk to reward ratio is only at 1.33. In a fear-driven market environment, I am strongly inclined to pass on these odds (even with beer goggles).

Ideally, a trade with a minimum risk to reward ratio at 3 or 4 is much more seductive, even in interesting times like these. However, to find the ideal opportunity, one needs to be patient and think counter-intuitive to the buy low and sell high paradigm. Hypothetically (I only say “hypothetically” because I have been long GLD at 74.85 since Oct 29, 2008), I would wait for GLD to break above its resistance at 90.19 and buy at $90.50. This would confirm that there is additional demand and fresh support at this level.

Here is where the trade can get a little tricky. There is some resistance at the 92 level and one should probably anticipate a minor pullback and retest of the newly established level of support at the 90 area. However, if support is violated, I am willing to accept a stop loss at 89 for a -1.5% maximum loss of capital. In the majority of instances when support fails the “retest”, this signals a false breakout.

Now let’s get to the good part. If the breakout is legitimate, then GLD should run to the 97.50 area, which is its next level of major resistance and also where I would definitely be inclined to book some short-term profits or at least hedge my position with long puts and/or short calls. Under this scenario, this trade presents a much more attractive risk to reward ratio at 5.24.

Gold certainly has both technical and fundamental positives going for it. The short, intermediate, and long term are all trending upward while the monetary policies of global central banks reflect a desperate willingness to accept future inflation to avert the immediate threat of deflation. Another tail wind, also aiding gold’s bullish movement, is the recent weakness and apparent correction in the U.S. Dollar Index.

In summary, the example of the above trading strategy is an opinion on how to play gold for those who are risk averse and can ill afford to lose more capital. Otherwise, for those turned on by a fundamentally bullish or bearish bias towards the precious metal, assume the position (pun intended) and enjoy the ride along with all its ups and downs. Yeah Baby!!!

Disclosures: Hillbent.com, Inc. or its affiliates may own positions in the equities mentioned in our reports. We do not receive any compensation from any of the companies covered in our reports

=============================================

============================================

Share this:

  • Reddit
  • Facebook
  • LinkedIn
  • More
  • Twitter
  • Pinterest
  • Tumblr
  • Print
  • Email

Like this:

Like Loading...

Is this the Move? Gold is Breaking Out!

26 Monday Jan 2009

Posted by jschulmansr in agricultural commodities, banking crisis, banks, bear market, bible, Bollinger Bands, bull market, capitalism, central banks, China, Comex, commodities, Copper, Currencies, currency, Currency and Currencies, deflation, Dennis Gartman, depression, dollar denominated, dollar denominated investments, economic, Economic Recovery, economic trends, economy, Federal Deficit, Finance, financial, Forex, Fundamental Analysis, futures, futures markets, gold, gold miners, hard assets, How To Invest, How To Make Money, id theft, India, inflation, Investing, investments, Latest News, Make Money Investing, market crash, Markets, mining companies, mining stocks, natural gas, oil, palladium, physical gold, platinum, platinum miners, precious, precious metals, price, price manipulation, prices, producers, production, silver, silver miners, small caps, spot, spot price, stagflation, Stimilus, Stimulus, Stocks, TARP, Technical Analysis, timber, Today, U.S. Dollar, Uncategorized, uranium, volatility

≈ Comments Off on Is this the Move? Gold is Breaking Out!

Tags

agricultural commodities, alternate energy, Austrian school, Bailout News, banking crisis, banks, bear market, Bollinger Bands, bull market, capitalism, central banks, China, Comex, commodities, communism, Copper, Currencies, currency, deflation, Dennis Gartman, depression, diamonds, dollar denominated, dollar denominated investments, economic, economic trends, economy, Federal Deficit, financial, Forex, futures, futures markets, gold, gold miners, hard assets, heating oil, India, inflation, investments, Keith Fitz-Gerald, Marc Faber, market crash, Markets, mining companies, Moving Averages, natural gas, oil, palladium, Peter Schiff, physical gold, platinum, platinum miners, precious metals, price, price manipulation, prices, producers, production, protection, rare earth metals, recession, risk, run on banks, safety, Saudi Arabia, Sean Rakhimov, silver, silver miners, socialism, sovereign, spot, spot price, stagflation, Technical Analysis, timber, U.S. Dollar, volatility, warrants, Water

As I write Gold currently is up another $9.30 oz today! Even more importantly it is well above the psychologically important price level of $900 oz. A new high will confirm the breakout and BANG! we’re off to the races. Todays past has some good articles detailing why could could be breaking out here. Enjoy and Good Investing!- jschulmansr

============================================

Here is a safe way for even a small investor to get in on the Gold Rush! You can buy quantities as little as 1 gram to 1000’s of oz. I personally use Bullion Vault for my physical metal purchases.

Catch the New Bull! – Buy Gold Online – Safely, quickly, and at low prices, guaranteed! Bullion Vault.com

============================================

Could There Be a Real Breakout In Gold?— Seeking Alpha

By: Trader Mark of Fund My Mutual Fund

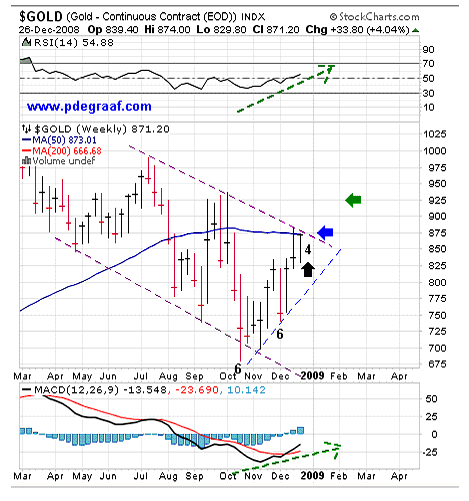
After a series of head fakes much of the past half year, the most watched move in the market might finally be “real” this time. With all the world’s printing presses going on overdrive, and currencies being mocked – gold “should” have been rocketing. Many theories persist on why it hasn’t, but really it does not matter. The price action is all that matters and this type of movement will get the technicians very interested.

Things to like
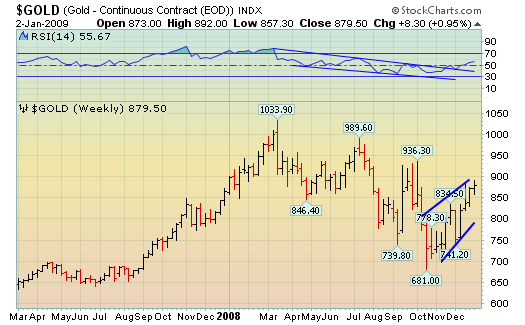
1) a series of higher lows
2) the trendline of lower highs has been penetrated

Things to see for confirmation
1) any pullback is bought
2) price prints over October 2008’s highs, signaling the end of “lower highs”

When last we looked about 6 weeks ago [Dec 11: Dollar v Gold – Can we Trust this Change?] , it was just another headfake – this formation on the chart does look more promising.

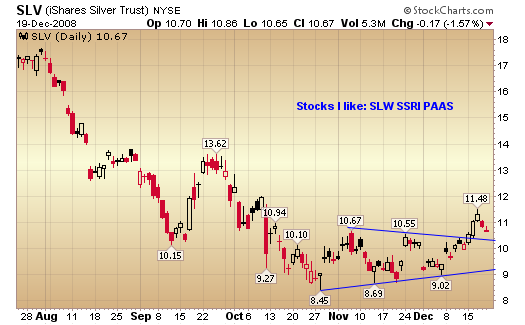
These are 2 names; one in gold and one in silver we’ve had our eyes on.

Or just play it simple and go double long gold


==================================================

Happy Days For Gold? —Seeking Alpha

By: Jeff Pierce of Zen Trader

Gold was in the spotlight on Friday in a big way, nearly moving $39. Is this a hat tip to the big move that many goldbugs have been anticipating? Is all the money printing that the Federal Reserve finally catching up with the US Dollar? Should you have bought gold on Friday because it’s a straight line up from here? Let me preface my answers by saying that I’m a short term trader that will sometimes allow a trade to turn into a longer term trade but that doesn’t happen very often. I’m currently flat precious metals but will be looking for a good risk/reward, but for anybody reading this know that this analysis is from a momentum based perspective.

So the answers to the previous questions I believe are yes, yes, and no.

gld

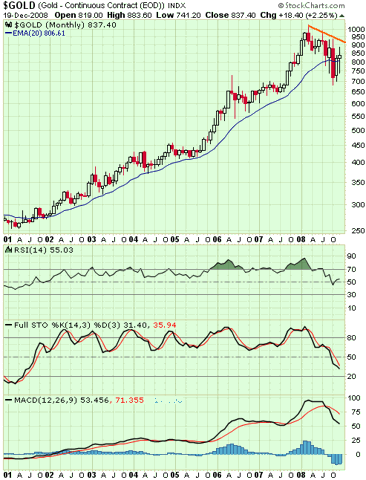
I’m a big fan of gold for a number of reasons (fundamental, technical, historical) but I know from experience that it trades much different from a momentum point of view. It tends to sell off once it goes outside it’s upper bollinger band as seen by the arrows above. Just when it looks like gold is going to bust out and move to blue skies it seems to run out of buyers and reverses. As you can see GLD and many individual gold miners moved outside this indicator on Friday and I expect a small pullback before it begins a new wave up.

Judging by the negative divergence on the RSI you can easily see that momentum is waning. As the stock has been making higher highs, the RSI has not been confirming the move. We could possibly move up to the 92 level before profit taking hits, but I just don’t see a good entry at this point if you’re not already invested in these stocks. It would be more prudent to wait for a slight low volume pullback before entering. The only problem with this way of thinking is there could possibly be many with this outlook and that could actually propel gold to higher levels, but I’m willing to risk that because if it does move up even more, then that will confirm the strength and I’ll buy even more on the eventual dip.

If you are long from lower levels I would consider taking some profits off the table now to prevent yourself from giving up any of your gains.

“I made all my money selling to soon.” ~ JP Morgan

slv

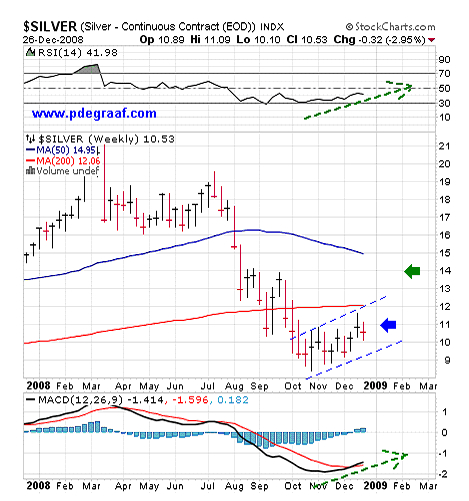
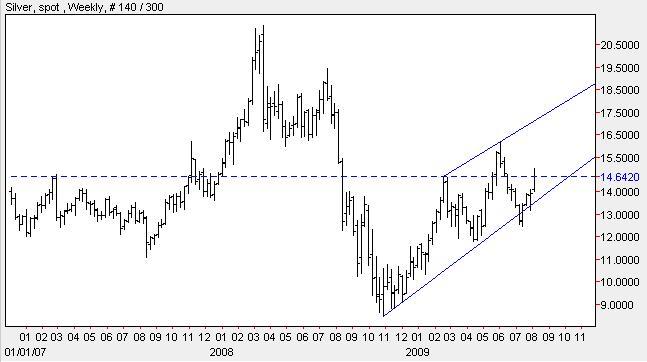
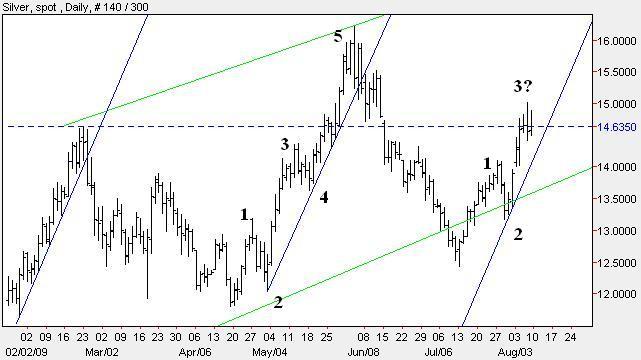
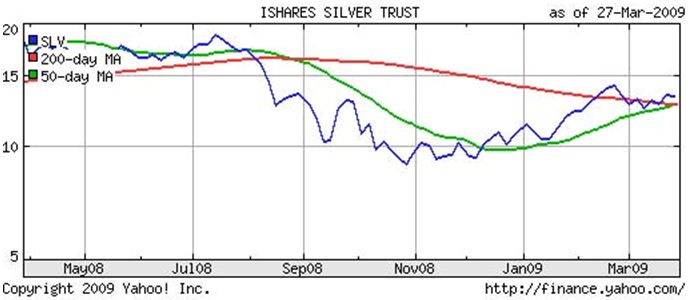
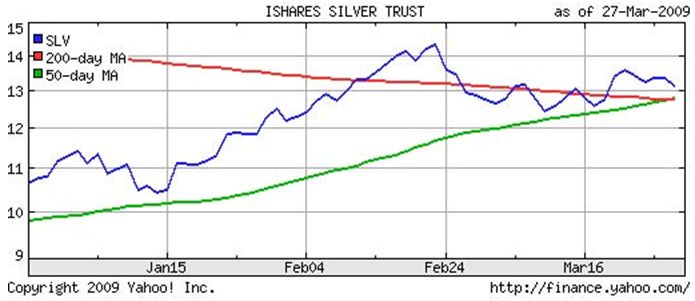
I like silver’s chart a tad better from a technical aspect as the base that it’s been building since last September seems a little more stable. The RSI trendline has been steadily moving higher as the price has been trending higher which is very bullish. I think we’re a tad overbought here and will be looking to get long stocks such as PAAS, SLW, and SSRI when we pullback or move sideways for a week or two.

=================================================

Now- Some Commentary by Dennis Gartman

Dennis Gartman on Gold, Oil, Government and the Economy- Seeking Alpha

Source: The Gold Report

With a real roller-coaster year behind us, how would you characterize your macro overview of major economic trends for 2009?

Dennis Gartman: It’s abundantly clear that we have been in recession; we’re in a recession; and we’re likely to remain in a recession through the greatest portion of 2009. The monetary authorities around the world have done all the things they’re supposed to do, which is during a period of economic weakness throw liquidity in the system as abundantly, as swiftly, as manifestly as possible and expect the liquidity eventually to wend its way through the economy and strengthen economic circumstances. That may be sometime late in 2009. In the meantime, we’ll see continued bad economic data and continued increases in unemployment. It’s going to seem like things are really, really, really bad.

But let’s remember that things are always their worst at the bottom. By definition, recessions begin at the peak of economic activity when all economic data looks its best. So while things will start to look very bad through the rest of 2009, I bet that by late this year and early 2010 we will start to see economic strength coming at us because of the liquidity injections going on everywhere.

TGR: What will be the first signs that we’ve reached the bottom in terms of the recession and are starting to turn around?

DG: The signs of a turnaround will be that everybody believes that there are no signs of a turnaround. We’ll see Newsweek writing a series of cover stories talking about the end of Western civilization. The Financial Times of London headlines will read, “The Recession Seems Endless” and “Depression Is Upon Us.” Every day’s Wall Street Journal articles will be just manifestly bleak in nature. That’s what the signs will be.

And then all of a sudden, things shall begin to turn around. But the signs are always their worst at the bottom. That’s how things function.

TGR: So the popular press is in essence on a delay mode.

DG: Oh, it always is.

TGR: By three months, by six months, by a year?

DG: It’s probably a little less slow to react than it used to be, but let’s say three months.

TGR: So you like the fact that the monetary authorities have put liquidity into the system?

DG: Absolutely.

TGR: And it sounds as if you think it just takes time to work through the system.

DG: Always has; always will. That’s how these things go about. You have recessions because you had an economic advance where, in Greenspan’s terms, “irrational exuberance took over.” You have to dash that irrational exuberance and make it into irrational depression. Irrational, manifestly bleak, black philosophies have to make their way to the public. That’s just how these things happen; it’s happened time and time again.

The recession that I recall the most clearly is that of ’72-’74. We have to remember that unemployment was high up in double digits. We saw plenty of articles in the press about the new depression. If you go back and read articles from July through September of 1974, you will be convinced that we will never have an economic rebound in our lives again. Well, clearly, that’s just not the case.

TGR: What about the bearish people who say we’ve never seen worldwide conditions like this and that we’re in the “new era”?

DG: We probably haven’t seen the world going into recession at one time such as we are now. But I think that’s simply indicative of the fact that today’s communications are so much better. People in the United States or Canada or Europe really never would have known much about a recession in India 20 years ago, because the news media would not have covered it. Nothing told you about economic circumstances abroad. Now, with the Internet, information comes at you absolutely one-on-one.

All correlations have gone to one in this present environment. When stocks go down in the United States, they go down in India. When they go down in India, they go down in Vietnam. When they go down in Vietnam, they go down in Australia. That wasn’t the case 20 years ago; you didn’t have the small world united through communications that we have now. And now the correlations of emerging markets and large markets have all come together.

TGR: If that’s true, and worldwide financial markets are all tied together, could any given country “emerge” as a growth country while the rest remain in recession?

DG: Oh, it’s possible, but I don’t think we’ll call them “emerging markets” anymore. You’ll just find that one country pursued better economic policies, probably by cutting taxes or increasing government spending or doing away with some onerous legal circumstance that might have previously inhibited economic activity. The Chinese are doing any number of good things at this point, and that country may just have been more enlightened and it may come out of the recession faster than the others do. But now they won’t do it on their own, and anybody who does do it will be watched and understood much more swiftly than in the past. For example, did you ever know what was going on in Iceland 10 years ago? Of course not; but now you do.

TGR: Right. The only emerging markets we heard about were China and India. No one ever discussed South America.

DG: And now they’ve emerged. But now we understand. We hear news from Venezuela every day. Now we hear news from Sri Lanka every day if we want it; we can get it very easily. We couldn’t do that 10 years ago; 20 years ago clearly we couldn’t. That’s been the big change. Information travels so much more rapidly. That’s why all the correlations have gone to one. We are now one large economic machine that maybe one of the component parts does a little bit better, but it won’t shock anybody, and there won’t be anything “emerging.”

TGR: Back to the bear people. You referenced the ’72-’74 economy, but this time, many are pointing to the debt situation that the U.S. and probably a bunch of the world economies are in and the fact that we’re committing to billions—and in the U.S., trillions—of dollars more. Won’t that influx of new money have some kind of significant bear impact going forward?

DG: No, it will have a bullish impact. Unless all the rules of economics have been rescinded, money pushed into a system will push economic activity higher.

TGR: But it will also push inflation higher.

DG: Oh, that’s very likely to happen. The question is whether it will be inflation of 1%, 2%, 5%, or will it be a Zimbabwean-like inflation? The latter isn’t going to happen, and 1% isn’t likely going to happen. But 2% to 5% inflation? Yes, that’s likely to happen several years down the line.

TGR: Gold bugs are saying, “Buy gold now.” What would be your advice under these circumstances?

DG: I happen to be modestly bullish on the gold market, but not because of inflationary concerns. It’s more that I think gold has quietly moved up the ladder of reservable assets, a reservable asset being one that central banks are willing to keep on their balance sheets, all things being equal. Dollars are still the world’s dominant reservable asset. The Euro is next and gold is probably the third.

The Fed has thrown off a lot of other assets and taken on securities, debt instruments, mortgages and the like, but I think they’re doing exactly the right thing. Some central banks with a lot of U.S. government securities on the balance sheet may decide that going forward, they may buy more gold rather than more U.S. government securities if they’re running an imbalance of trade surplus. For instance, if I’m the Bank of China and I hold a minuscule sum of gold, maybe I should own a slightly larger minuscule sum.

TGR: That’s really diversifying your monetary assets.

DG: I think that’s all that will drive the gold prices quietly higher. I am not a gold bug; I don’t think the world’s coming to an end. I think the history of man is to progress. And yes, we have relatively large amounts of debt, but you can go back to the recession of 1974; you can go back to 1980-81; you can go back to the recession of 1907, and you will see the same arguments—that the world is too debt-laden. And the same arguments, the same language, the same verbiage was always written in exactly the same circumstances. Guess what? We moved on. This time might be different, but I’ll bet that it won’t be.

TGR: What would your recommendation for investors to do in gold? If they want to do any type of holding assets in monetary value, should they be looking at holding physical gold or buying ETFs or buying into the equity?

DG: For the past several years, I’ve told people that if they’re going to make the implied bet on gold, bet on gold. The gold bugs tell you that you have to own bullion. I say, no, you should really own the GLD, the ETF. It trades tick-for-tick with gold. If some truly untoward chaotic circumstance ran through the world’s banking system I guess maybe GLD and bullion would diverge at some point, but we’d have other problems long before that would occur. So if you’re going to make the implied bet on gold, bet on gold. Do the GLD.

TGR: But not physical gold?

DG: I do own some physical gold. But do I own a lot of it? No. And quite honestly, I hope I lose money on the physical gold I have. It’s an insurance policy. Nothing more than that.

TGR:: Are you looking at physical gold as the insurance policy or any investment in gold as an insurance policy?

DG: There’s the old saying, “Those aren’t eatin’ sardines; them is trading sardines.” Some gold I consider to be tradable, and that’s ETF-type stuff, and I have a small amount in the lockbox in the form of gold coins. That’s my insurance policy.

TGR: That would be what the typical investment broker might advise, 5% to 10% in gold.

DG: That’s it. Exactly, that’s it. Don’t get overwhelmed by it.

TGR: How about mining stocks?

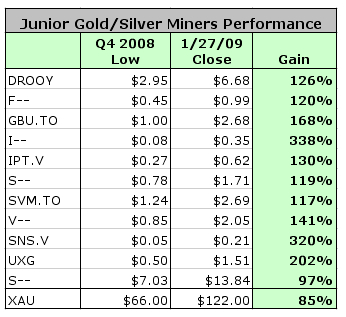
DG: If you’re going to bet on gold, there’s nothing worse than being bullish on gold and owning some mine—especially in some junior fly-by-night—and walking in one morning and finding out that the mine you thought you had got flooded or all of your workers were unionized and walked off or management was somewhat derelict. You may have been right on the direction of gold, but your stock went down. So I’ve told people to stay away from the juniors; that’s a terrible bet on gold. If you’re going to bet on gold, bet on gold.

Maybe you’ll want to start punting on Barrick Gold Corporation (NYSE: ABX) or Newmont Mining Corp. (NYSE: NEM) or the real large names, rather than the juniors. There’s just too much risk in the juniors. Yes, everybody says, “I bought this junior at a nickel and now it’s at 15 cents.” Well, jolly for you, but you probably bought 15 others at a nickel, and they’re all bankrupt. If you’re going to bet on gold, bet on gold.

TGR: So you’re saying with that advice that if you want to bet on gold equity, bet on blue-chip gold equity stocks that have just been hammered down through the market.

DG: That’s correct, Agnico-Eagle Mines (TSX: AEM), ASA Ltd. (NYSE: ASA), the Newmonts, the Barricks, that sort of thing.

TGR: If we take that logic and look across the broad array of sectors, would you also recommend looking at other blue chips that have just been battered? Or do you think that some sectors will recover faster than others? Such as the financial sector, the energy sector, the housing sector, the precious metals sector?

DG: I’m really quite bullish on infrastructure—the movers and the makers of the things that if you drop them on your foot, it will hurt. I think I want to own steel and copper and railroads and tractors because I think we’re going to be building roads and bridges. That’s probably one of the things that probably will bring us out of the economic morass. Along those lines, I wouldn’t mind owning a little bit of gold at the same time.

TGR: Unlike gold that you can buy and own, if you look at steel and copper, are there specific companies and equities that are appealing to you?

DG: Again, as in gold, if I am going to buy gold equities, I’m going to buy the biggest names. If I’m going to buy steel, I’m going to buy the biggest names. U.S. Steel comes to mind. That’s the easiest; that’s the best; that’s where liquidity lives. It has been bashed down from the highs made last July; it’s down—what?—75% from its high. Recently it stopped going down and is in fact starting to go up now on bad news. So if you’re going to buy steel, buy the most obvious ones—U.S. Steel or buy Newcorp.

TGR: You talked about the energy market being weak in one of your recent newsletters. Do you see this weakness continuing or do you see a turnaround happening in ’09?

DG: The one thing that we can rest assured in the rest of the world is that OPEC chiefs cheat on each other—they always have and they always will. So when OPEC says that it’s cut production, that’s a lovely thing. No, they haven’t, and they don’t. Because the problem OPEC has is they’ve all raised their standards of living and the expectations of their people, and they all have cash flow requirements. You have to sell three times as much $50 crude oils as you sold $150 crude oil to meet the demands of your populace that you have increased. So the lovely thing from a North American perspective is that Chavez finds himself in a very uncomfortable position and needs to produce a lot more crude oil to keep his public happy. It’s rather comical, isn’t it, that Chavez was giving crude oil away to the Kennedy family to be distributed to people in the Northeastern United States until two weeks ago when he had to stop. He had to stop because he needs the crude oil on his own to sell, not to give away, to meet cash flow demands.

Iran is in exactly the same position. Isn’t it lovely to see that Putin, who was really feeling his military oats six months ago with $150 oil, has to pick fights with Ukraine and smaller countries now with crude at $45 a barrel? Where is crude going to go? I wouldn’t be surprised if we make new lows.

TGR: Will there be new lows for ’09? Are you buying into this whole peak oil argument that production eventually will be unable to meet demand?

DG: Do I believe that we’re going to run out of crude oil in the next 100 years? Not on your life. Sometime in the next 10,000 years we probably will run out of crude oil. In that instance, I am a peak oil believer. It’s not going to happen soon though. I remember they told me when I was in undergraduate school back in the late ’60s that we would be out of crude oil by 1984.

TGR: Do you mean out of oil? Or at a point where demand exceeds production?

DG: We would be out! Gone, done! There would be no more. Isn’t it interesting? We’ve pumped crude oil for 28 more years. This is an interesting statistic: We have either seven or eight times more proven reserves now than we had in 1969. And I think we have used a bit of crude oil between now and 1969.

TGR: Just a wee bit.

DG: A wee bit, and yet we have seven or eight times more proven reserves. Every year we have more proven reserves. So, yes, I’m a peak oil believer. Sometime in the next 10,000 years we will run out of crude.

TGR: With Obama now in office and talking about getting off our reliance on foreign oil, what’s your view of the future on all the alternative energies that are being so pushed by many people in the U.S. government?

DG: I think it’s wonderful job-creation programs, none of which will prove to be of much merit at all. All of the Birkenstock-wearing greens will feel very good about having their rooftops covered by solar panels, but is that going to resolve any energy problems we have? No. No. Nuclear power will do that. Maybe using the oceans will do that, but wind power, probably not. Solar power, probably not. It makes everybody feel good, but are we going to power our cars in the next 40 years with solar power? I doubt it. Do I expect some sort of material technological breakthrough in the next 100 years that will change what we use as energy? Oh, absolutely. Do I have any idea what it will be? Of course not.

TGR: If the price of oil if it remains low, is there a role for nuclear in the next 50 years?

DG: Oh, absolutely.

TGR: What will drive that?

DG: It’s absurd that we don’t use nuclear energy. Even the French derive 80% of their electricity from nuclear energy, cleanly, efficiently, without any problems whatsoever. Why we don’t do the same in the United States other than the left and the eco-radicals keeping us from doing it is really quite beyond me.

TGR: So, given that we still have eco-radicals and a big push toward alternative energies, do you see anything happening in the U.S. in nuclear in the near future?

DG: Yes, actually. It’s interesting. There are a lot of new nuclear facilities on the drawing boards, and they’re probably going to be approved. If there’s going to be one surprise by the Obama Administration, it will be that you don’t get nuclear energy advances under a right-wing government; you always get them under a left-wing government. Obama will be smart enough to understand that that’s the only way—that’s the best and cleanest methodology to use. And the left won’t argue with a fellow leftist pushing for nuclear energy. Only Nixon could go to China; only Obama can push nuclear energy.

TGR: And you think that he will?

DG: Oh, yeah, he’s smart enough to understand that.

TGR: Going back to your investment strategy, which big blue chip players in oil and nuclear would you point out as good investments?

DG: In oil, I’d want to take a look at companies such as ConocoPhillips (NYSE: COP), which dropped 70% from its highs. How can you go wrong with the Conocos and the Marathons and the large oil companies whose price-to-earnings multiples are down to at single digits and their dividend streams are 5%, 6%, and 7%? Why would you not want to own those? That’s the best investment.

And at the same time, the volatility indices on the stock market are so high that, gee, you can buy Conoco, get the dividend, and sell out of the money calls at very high premiums and ramp your dividend yield up. It’s like a gift; it’s like manna.

TGR: Well, what about in terms of the nuclear sector and uranium?

DG: I really don’t understand uranium. I don’t know where to go, and I don’t how to buy it yet. So I’ll just say there’s a future for it, but I don’t know what to do with it.

TGR: What other sectors should be looking at for 2009?

DG: Banks, banks.

TGR: They’re making a comeback. Do you think there will be more consolidations?

DG: There will be more consolidations; there has to be. But look at the yield curve—what a year to be a bank! The overnight Fed funds rate, the rate banks are going to pay depositors for their demand deposits or checking accounts is zero. And you’re going to be able to lend that out to hungry borrowers at 7%, 8%, 9%, 10% and 12%. The next three years will be the greatest three years banks have ever seen. Banks will just make money hand over bloody fist in the next three years.

TGR: Are you talking about the big boys?

DG: No, I’m talking about the regionals. The big boys have problems in toxic assets. I am not even sure there is a Peoples Bank & Trust in Rocky Mount, North Carolina, but a bank like that—or the First National Bank of Keokuk, Iowa or the First National, or the Peoples Bank & Trust of Park City, Utah—those are the banks that are going to make lots of money.

TGR: Do you see an explosion in regional banks? Will move of them come into the marketplace?

DG: I think we’ve probably got all we need. It’s just that they’re very cheap.

TGR: What will the role of the international banks be?

DG: Mopping up the disasters that they’ve created for themselves for the past decade, trying to survive, being envious of the decent regional banks that are going to be earning enormous yields on this positively sloped yield curve and wishing they were they.

TGR: Do you see a role long term for international banks?

DG: Oh, sure, of course. How could there not be? It’s a smaller world; it’s an international world; it’s a global world. International banks will be back in full force a decade from now. They’ve got some wound-licking to do, and they’ll do it.

TGR: In addition to regional banks as being a great play to look at for ’09, ’10, any other interesting plays to bring up?

DG: You want to own food and grains again.

TGR: Are you talking about grains or food producers like Nabisco?

DG: No, I think you want to own grains. If you’re going to make a speculation, I think you want to own on the grain markets again.

TGR: Grain for human consumption or grain for livestock consumption?

DG: Yes and yes.

TGR: Are you looking at buying that on the commodities market?

DG: You can actually buy that on ETFs now. The wonderful world of ETFs is just extraordinary. You can actually buy a grain ETF now. DBA (DB Agriculture Fund) is one; JJG (iPath Grains) is another. Those are basically long positions in the grain market. Wonderful things to use.

TGR: You like ETFs; but the naysayers will say that ETFs could be encumbered and there’s actually no guarantee that they hold any assets.

DG: That’s true; that’s correct.

TGR: But you’re comfortable that people should go into an ETF for grains?

DG: I didn’t say that. What I said is if you wish to trade in grain, there are ETFs that will do that. Do I know for sure that they will all perform perfectly and that if the world were to come to a chaotic banking circumstance that there wouldn’t be problems? I don’t know that. Does that bother me? No. It doesn’t bother me even slightly.

Should you worry about [not trading] an ETF just because there might be some problem under an untoward economic environment? No, it’s illogical. And shame on those people who say those sorts of things or who tell you not to use them because they ETF may not function properly if there is some total breakdown in the banking system. Well, if that happens, we have other problems.

TGR: And what’s your projection for the overall investment market? We’ve been hearing speculation that it will rise through April, bottom out even deeper than it is today, and then a slow climb in 2010.

DG: Gee, I have no idea. I just think that stock prices will be higher six months from now than they are now, much higher 12 months than they will be six months from now, and higher still in 24 months than they will be 12 months from now. But where will they be in April? Golly, I don’t know. I think the worst is far behind us and better circumstances lie ahead. And that’s the first time in a loooonnnng while that I’ve said that.

TGR: Yeah, now if the media will just catch up with you, we can enjoy watching it again.

DG: It won’t. Watch the news; it will just get bleaker and bleaker as the year goes on. And watch the unemployment rate; it’s going to be a lot higher.

TGR: Other than Barack Obama saying we’re going to start building infrastructure, do you anticipate any dramatic changes in the U.S.? Right now we’re a services country, and we need to move back to being a manufacturing country.

DG: We’ll never move back to being a manufacturing country. Won’t happen. Here’s an interesting bit of data. Do you know what year that we had the absolute high number—not just as a percentage of population—but the absolute high number of manufacturing jobs was in the United States?

TGR: Somewhere around the World War II era.

DG: Very good, 1943. We have lost manufacturing jobs since 1943. I think that’s a fairly well-established trend.

TGR: Is there a future for the services sector, though? That’s the key.

DG: It will be larger. And so what? It’s like saying we need more farmers. No. We need fewer farmers. We have one-hundredth as many farmers as we had at the turn of the 20th century. We now 500 times more grain? Seems to me every time we lose a small farmer, we get better. So, we need fewer farmers. And we need fewer manufacturing jobs.

TGR: But doesn’t that put the onus on the United States as the economic world leader? Considering the fact that, as you mentioned, information now is instantly available everywhere, just in terms of worldwide confidence; it seems like every time we hiccup, the planet hears it?

DG: There is probably some truth to that fact. But it is probably not us that will lead; it’s probably Australia or New Zealand or the Baltic States or some smaller country that actually changes policies and frees up markets and cuts taxes, and all of a sudden their economy starts to turn around. Then people elsewhere will say, “Oh, look! That’s the right thing to do. Let’s us go do that.”

TGR: Really? Economic recovery worldwide will not come from the United States?

DG: Well, if we don’t recover, the rest of the world won’t, but we won’t be the first. What I am saying is that some smaller country will do the right things faster than we do.

TGR: Isn’t what Australia does irrelevant to what the U.S. needs to do?

DG: No, it’s dramatically relevant. If Australia starts to do things properly—if Australia were to suddenly come out and slash taxes and go to a flat tax and cut paperwork by 50% and it’s economy starts to turn higher, wouldn’t that be a good incentive for us to do the same thing?

TGR: But that implies that every country should use the same economic strategy; that we’re all basically at the same state in our economic development. That what will work for Zimbabwe or China will work for the U.S.

DG: I think anywhere in the world that you have smaller government, lesser taxes—every time you do that, that economy, no matter where it is, does better. It does better. And anywhere you put higher taxes and more government, that economy usually does worse. It does; it just does.

TGR: You’re looking at it from a macro point of view.

DG: I’m looking at it just from an economic point of view, whether macro or micro. Look at Ireland, for example. Why was Ireland for many years the “Celtic Tiger” of Europe? Their tax regime was lower than the rest of Continental Europe. The Germans and the French, who are statists, who are collectivists, instead of emulating the Irish, kept trying to drag Ireland down to their level. Now, that was stupid, wasn’t it? That didn’t work.

My favorite example is New Zealand back in the 1980s. Every year from the 1970s through the 1980s, New Zealand ran a budget deficit and a trade deficit. Every year the IMF said, “You must raise your taxes and cut the value of your currency to try to balance your budget and run a trade surplus.” So New Zealand would do that, and every year the deficit got worse and their trade imbalance grew larger. They did this for five or six years and it got worse every time they did it—every time they followed the IMF tactic of raising taxes and cutting the value of the currency.

Finally New Zealand Treasury Secretary Graham Scott (Secretary from 1986–93) told the IMF, “Don’t ever come back here. Everything you’ve told us to do has proven to be utterly worthless. We’re going the other way. We’re slashing taxes.” From I think a 75% marginal tax rate, over the course of five years, they cut it to like 18%. And every year they took in more money—more money—every time they cut taxes they took in more money. And when they strengthened their currency, their exports picked up; as their currency got stronger, they exported more stuff. Isn’t it fascinating?

TGR: That’s the paradox.

DG: It got to be so interesting—it wasn’t Gordon Campbell—I’m trying to remember; I just went blank for his name. But he passed the baton on to a woman by the name of Ruth Richardson, who was a little more leftwing than her predecessor—the tax rate was down to a flat 18%. They asked her if she was going to cut it again, and she said, “You know, I don’t think I can cut it any more; I can’t spend the revenue I am taking in now.” It’s a classic line. So, what does she do? They actually started raising the tax rates again, and what happened? Tax revenues fell.

But New Zealand had taught a lot of people that cutting taxes and strengthening your currency is the best thing you can do. And as they were cutting taxes, they kept cutting prohibitions and regulations; they kept chopping them back. They were the real precursors of the Free Market Movement that developed in the early ’90s and the early ’00s.

TGR: Let’s hope the United States learns from that. Obama announced his tax cuts; we’ll see what comes of that.

DG: He said entitlements are even on the table. Can you imagine a Republican ever making that statement? They would boo him. But here’s a leftist who puts it on the table. He can say that.

Irreverent, outspoken, entertaining, sardonic and—in his own words, a “glib S-O-B,” Dennis Gartman has been producing The Gartman Letter for more than 20 years. His daily commentary on global capital markets as well as short- and long-term perspectives on political, economic and technical circumstances goes to leading banks, brokerage firms, hedge funds, mutual funds, energy companies and grain traders around the world.

A 1972 graduate of the University of Akron (Ohio), he undertook graduate studies at North Carolina State University in Raleigh (where he remains involved as a member of the Investment Committee.

Before devoting himself full-time to The Gartman Letter, Dennis analyzed cotton supply and demand in the U.S. textile industry as an economist for Cotton, Inc.; traded foreign exchange and money market instruments at North Carolina National Bank, went to Chicago to serve as A.G. Becker & Company’s Chief Financial Futures Analyst and then become an independent member of the Chicago Board of Trade, dealing in treasury bonds and notes and GNMA futures contracts; and moved to Virginia to run Virginia National Bank’s futures brokerage operation.

In addition to publishing The Gartman Letter, Dennis delivers speeches to audiences around the world (including central banks, finance ministries, and trade groups), teaches classes on derivatives for the Federal Reserve Bank’s School for Bank Examiners, and makes frequent guest appearances on CNBC, ROB-TV and Bloomberg television.

==============================================

Finally for the Technical Analysis Junkies (like me!) here is an awesome article!

===============================================

Market Leaders Hesitate on Stimulus Plan— Seeking Alpha

By: Chris Ciovacco of Ciovacco Capital Management

Proposed Economic Stimulus Plan May Not Stimulate Much

The new administration is proposing an $825 billion “stimulus” plan. Most of the package is geared toward helping existing or expanded programs such as unemployment assistance, law enforcement, food stamps, etc. Much of this spending will “save” existing jobs or keep existing programs already in place. This may help prevent things from getting worse, but it will offer little in the way of providing new stimulation for the economy. Another large portion of the stimulus plan is in the form of tax cuts. While depreciation incentives may spur some new business spending, credits to individuals may offer little incentive to spend given the state of their balance sheets and concerns about employment. After all the hype about infrastructure spending, only about 25% of the package is geared toward this area.

Tug of War Between Liquidity and Economic Weakness

The chart below was created on the website of the Federal Reserve Bank of St. Louis. It shows the eye-popping expansion of the money supply as financial institutions have swapped securities and other “assets” for cash via borrowing from the Federal Reserve. Borrowing prior to this crisis is barely visible on the graph. Recent borrowing is an extreme example of the term “spike” on a graph. Despite the never before seen tapping of the Fed, financial assets show little evidence of reflation taking place.

Borrowing From FEDU.S. Stocks: Downtrend Remains In Place

If you compare the long S&P 500 ETF (SPY) to the short S&P 500 ETF (SH), it is clear the short side of the market is in better shape. There is little in the way of fundamentals, except hope of government bailouts, to expect any change to these trends.

S&P 500 ETF - SPY - Long
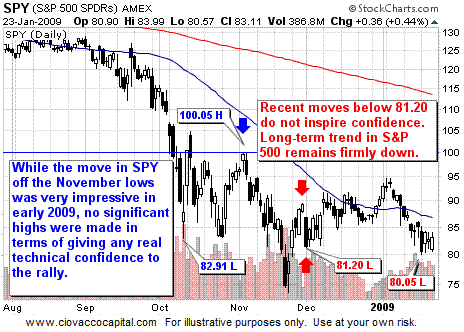
Recent weakness in the S&P 500 Index leaves open the possibility that we will revisit the November 2008 lows around 740 (intraday). If those lows do not hold, a move back toward 600 becomes quite possible. On Friday (1/23/09) the S&P 500 closed at 832. A drop back to 740 is a loss of 11%. A move back to 600 would be a drop of 28%. These figures along with the current downtrend highlight the importance of principal protection and hedging strategies. SH, the short S&P 500 ETF, can be used to protect long positions or to play the short side of the market.

2009 Investing Deflation Inflation Outlook Strategy
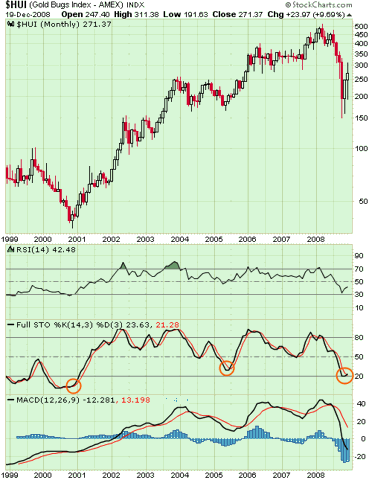
Gold & Gold Stocks Still Face Hurdles

Friday’s big moves in gold (GLD) and gold mining stocks (GDX) have some calling a new uptrend. While recent moves have been impressive some hurdles remain.

Gold At Important LevelsGold stocks (GDX) look a little stronger than gold, but any entry in the market should be modest in size. If $38.88 can be exceeded, our confidence would increase and possibly our exposure.

2009 Investing Deflation Inflation Outlook StrategyRun In Treasuries Is Long In The Tooth

Investments with the highest probability of success are those with positive fundamentals and positive technicals. Conversely, the least attractive investments have poor fundamentals and poor technicals. With the U.S. government issuing new bonds at an alarming rate, a continued deterioration in the technicals could signal the end of the Treasury bubble.

2009 Investing Deflation Inflation Outlook StrategyTBT offers a way to possibly profit from the negative forces aligning against U.S. Treasury bonds.

2009 Investing Deflation Inflation Outlook StrategyStrength In Bonds Shows Little Fear of Price Inflation

The government’s policies are attempting to stem the tide of falling asset prices. They hope to reinflate economic activity along with asset prices. The charts here show:

  •  
    • A weak stock market (see SPY above), and
    • An improvement in many fixed income investments (below: LQD, AGG, BMT, PHK, and AWF).

Weak stocks and stronger bonds tell us the government’s reflation efforts are thus far not working. If concerns about deflation remain more prevalent than concerns about inflation, fixed income assets may offer us an apportunity. With money markets, CDs, and Treasuries paying next to nothing, we may be able to find improved yields in the following:

  •  
    • LQD – Investment Grade Corporate Bonds
    • AGG – Investment Grade Bonds – Diversified
    • BMT – Insured Municipal Bonds
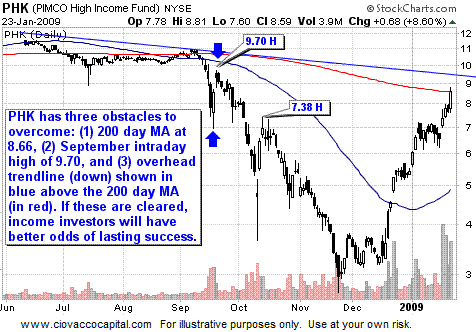
    • PHK – High Yield Bonds
    • AWF – Emerging Market Government Bonds

With the economy in a weakened and fragile state, we need to tread carefully in these markets. Some key levels which may improve the odds of success are shown in the charts below. Erring on the side of not taking positions is still prudent. The markets remain in a “prove it to me” mode where we would like to see the markets move through key levels before putting capital at risk.

2009 Investing Deflation Inflation Outlook Strategy 2009 Investing Deflation Inflation Outlook Strategy 2009 Investing Deflation Inflation Outlook Strategy 2009 Investing Deflation Inflation Outlook Strategy 2009 Investing Deflation Inflation Outlook Strategy
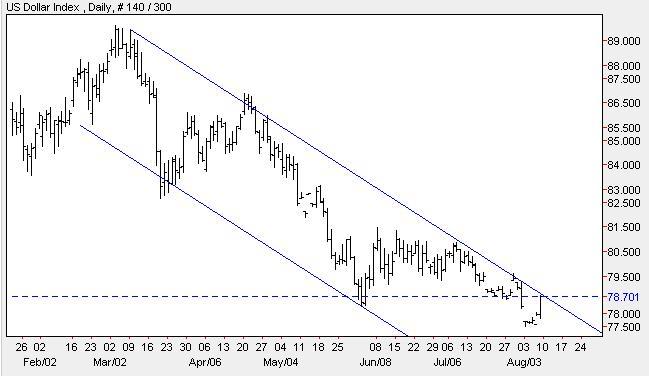
U.S. Dollar Remains Firm

From a technical perspective, the dollar continues to look strong. Its strength supports the continuation of concerns about deflation, rather than inflation.

2009 Investing Deflation Inflation Outlook StrategyDisclosure: Ciovacco Capital Management (CCM) and their clients hold positions in SH, GLD, and PHK. CCM may take long positions in GDX, TBT, LQD, AGG, BMT, and AWF.

=============================================

Catch the New Bull! – Buy Gold Online – Safely, quickly, and at low prices, guaranteed! Bullion Vault.com

=============================================

Nothing in today’s post should be considered as an offer to buy or sell any securities or other investments, it is presented for informational purposes only. As a good investor, consult you Investment Advisor,  Do Your Due Diligence, Read All Prospectus/s and related information before you make any investments. – jschulmansr

Share this:

  • Reddit
  • Facebook
  • LinkedIn
  • More
  • Twitter
  • Pinterest
  • Tumblr
  • Print
  • Email

Like this:

Like Loading...

Has World War III Started?

09 Friday Jan 2009

Posted by jschulmansr in agricultural commodities, alternate energy, Austrian school, banking crisis, banks, Barack Obama, bear market, Bollinger Bands, bull market, capitalism, central banks, China, Comex, commodities, communism, Copper, Currencies, currency, Currency and Currencies, deflation, depression, diamonds, dollar denominated, dollar denominated investments, economic, economic trends, economy, Finance, financial, Forex, Fundamental Analysis, futures, futures markets, gold, gold miners, hard assets, heating oil, How To Invest, How To Make Money, India, inflation, Investing, investments, Keith Fitz-Gerald, Latest News, Make Money Investing, Marc Faber, market crash, Markets, mining companies, mining stocks, Moving Averages, natural gas, Nuclear Weapons, oil, palladium, Peter Schiff, physical gold, platinum, platinum miners, precious metals, price, price manipulation, prices, producers, production, protection, rare earth metals, recession, risk, run on banks, safety, Saudi Arabia, Sean Rakhimov, Siliver, silver, silver miners, small caps, socialism, sovereign, spot, spot price, stagflation, Stocks, Technical Analysis, timber, Today, U.S. Dollar, uranium, volatility, warrants, Water

≈ Comments Off on Has World War III Started?

Tags

agricultural commodities, alternate energy, Austrian school, banking crisis, banks, bear market, Bollinger Bands, bull market, capitalism, central banks, China, Comex, commodities, communism, Copper, Currencies, currency, deflation, depression, diamonds, dollar denominated, dollar denominated investments, economic, economic trends, economy, financial, Forex, futures, futures markets, gold, gold miners, hard assets, heating oil, India, inflation, investments, Keith Fitz-Gerald, Marc Faber, market crash, Markets, mining companies, Moving Averages, natural gas, oil, palladium, Peter Schiff, physical gold, platinum, platinum miners, precious metals, price, price manipulation, prices, producers, production, protection, rare earth metals, recession, risk, run on banks, safety, Saudi Arabia, Sean Rakhimov, silver, silver miners, socialism, sovereign, spot, spot price, stagflation, Technical Analysis, timber, U.S. Dollar, volatility, warrants, Water

Has World War III already started? According to Marc Faber it has! Check out his interview. Next do you think the government can lose? According to this pundit not only will it lose it is going to lose big! Finally, for years now China has been coming to the rescue by buying Treasuries and US Debt, what will happen when they and other countries stop? Continuation of series from yesterday’s post. Just In! Peter Schiff Interviwed on Russian TV- Get Prepared!  adjust your portfolios and if you own Precious Metals hang on for the ride of your life!- Good Investing!- jschulmansr

Marc Faber on the Economy, Gold, WWIII – Seeking alpha

By: Tim Iacono of Iacono Research

Another good interview with Dr. Marc Faber, this one over at Bloomberg where he’s been a regular for many years (recent appearances at the likes of CNBC are somewhat unusual as he tends to go against conventional wisdom, something that abounds at CNBC).
IMAGE

Click to play in a new window

There’s lots of good stuff in this one – the outlook for the global economy, oil, gold, base metals, natural resource stocks, World War III having already started…

On the subject of alternatives to the government solutions for the current problems, he was asked how he expected the populace to stand for the government doing nothing?

That’s the problem of society. If people can not accept the downside to capitalism, then they should become socialists and then they have a planned economy. They should go to eastern Europe twenty years ago and to Russia and China for the last 70 years.

How do you tell that to somebody in Detroit who’s losing his home today?


Why is he losing his home? Because of government intervention. The government – the Federal Reserve – kept interest rates artificially low and created the biggest housing bubble, not just in the U.S. but worldwide. That is what I’d explain to the worker in Detroit.

============================================

How the Federal Government will Lose in 2009 – Seeking Alpha

By: Rob Viglione of The Freedom Factory

Through a combination of incompetence and greed, the federal government has placed itself in a position of checkmate. There is no way to finance its budget deficits without devaluing the dollar or causing interest rates to rise. With $10.6 trillion in debt, $8.5 trillion in new money created or given away in 2008, and multiple years of trillion dollar deficits planned by Obama, government has no way to fund its extravagances without either printing a lot more money or borrowing unprecedented sums.

This means that either Treasury bonds will crash, or the dollar will suffer significant devaluation relative to foreign exchange or precious metals, especially gold.

TV Does Great Interview With Peter Schiff (Russian TV, That Is)

=====================================================

Remember Dare Something Worthy Today Too!


Market forces are telling the world to shed unproductive assets and shrink capacity, yet central banks and governments around the world, in particular the U.S., are refusing to listen. Rather than allow markets to snap back to sustainable equilibrium from previously artificial highs, the federal government clings to the notion that forcibly shuffling resources, propping up asset prices, and diluting the money supply will magically save the day.

There are consequences to everything. The consequences of shuffling resources (taxing productive ventures and doling out those resources to failing ones, i.e. bailouts) are stunted growth for good businesses and propagation of bad ones. Artificially propping up asset prices means that those who are generally less competent remain the custodians of society’s capital, and diluting the money supply inflates aways everyone’s wealth over time, particularly harming the poor and middle class.

For decades the federal government has gotten away with this reshuffle and inflate game, but the pawns are drowning, the rooks helpless, and the knights ready to turn on the King. Perhaps this is overly dramatic. Clearly, I doubt the capability of the Federal Reserve, Congress, and Obama to “fix” the economy; rather, I strongly believe they are destroying it by forcing us all to drink this Keynesian Kool-Aid. However, whether or not the economy recovers amidst this historic central government action, there are two phenomena we can exploit to our advantage:

  • Short the US dollar
  • Short US Treasuries

In “When will the great Treasury unwinding begin?” I show how government debt has been bid to unsustainable levels and will likely fall. The one concern I see stated all too often is that the Federal Reserve will keep buying Treasuries to artificially depress interest rates. This will, it is claimed, keep bond prices inflated. The one undeniable counter to this is that government must somehow fund its $1.2 trillion estimated 2009 deficit. It cannot do this by issuing and then buying the same bonds. It can only raise revenue by selling bonds to other parties, or by diluting the money supply by cranking up the printing presses. There are no other options. There you have it – we have the government in checkmate!

The likely outcome is that they will try to do both. That is why I am heavily shorting both 30-Year Treasury bonds and the dollar. Both assets will likely lose as the government becomes increasingly desperate and the world’s biggest buyers realize there are better alternatives available. Make your bets now before it becomes treasonous to bet against Big Brother!

Disclosure: Long UDN, short TLT, long GLD.

==============================================

Five New Forces to Drive Gold Higher – Seeking Alpha

By: James West of The Midas Letter

Gold naysayers habitually point to the relatively weak performance of gold relative to the broader market over the last 5 years. Given the market today, that argument is increasingly wrong, and the naysayers are soon to either admit their mistake, or pretend that they were never naysayers at all. That’s because during the last 3 months, five major new forces have emerged to compound the previous strong drivers of the gold price up to now.

These new forces are as follows:

  1. China has stopped buying U.S. debt.
    An interesting piece in the New York Times today signals that China, up until now the biggest buyer of U.S. Treasuries and bonds issued by Fannie and Freddie, is moving towards an end to that policy. China holds over US$1 trillion of such paper, and as interest rates collapse, there is less and less incentive for them to buy American.China has made several adjustments to programs that used to give banks and other financial institutions within the country incentive to buy U.S. assets, which means essentially that these same customers for assets will now be looking for Chinese products.The effect this will have on gold is two-fold. In the first place, reduced demand for U.S. debt will hamper Obama’s plans to keep printing money, because the one limiting factor that still seems to be respected in terms of how much paper can be printed, is the idea that there must be a counterparty to every issuance of T-Bills to warrant continued printing. Theoretically, less demand for T-Bills will force a rise in interest rates to attract investors. But that does not appear forthcoming, which will make the U.S. dollar weak relative to other currencies – especially gold.The second effect is that by eliminating incentives for Chinese banks to acquire U.S. denominated assets, investors there will divert more funds to holding gold as a hedge against their current U.S. dollar holdings, which will be diminishing in value.
  2. Future discoveries of gold deposits will diminish dramatically.
    The biggest source of gold ounce inventory for major gold producers is the discoveries made by the several thousand juniors who scour the earth in search of favorable geology. With the collapse in base metals prices, many of these juniors are under increasing pressure to consolidate and downsize, and many more will disappear altogether.That means less money going into gold exploration, and that means the number of new discoveries that can be acquired by majors is going to go down sharply in the coming years. In theory, as gold continues to outperform all other asset classes, there will be a rush back into junior gold exploration, but that won’t happen until gold is taken much higher and investment demand for it soars.
  3. Existing by-product gold production will fall sharply
    In copper, zinc and other base metals mines around the world, gold occurs in metallic deposits as a by-product of some other dominant mineral. In the United States, 15 percent of gold production is derived from mining copper, lead and zinc ores.With the collapse in prices for these metals, the by-product production of gold is most often insufficient to justify the continued operation of the mine profitably, and it is likely that a significant amount of this by-product gold production will cease along with the shutdown of these operations. The result will be less gold production from existing operations, contributing to the now even faster growing gap between supply and demand.
  4. Gold is becoming mainstream
    One of the biggest contributors to gold’s unpopularity as a main street investment is that it has been mercilessly derided and ridiculed by mainstream investment media and institutions. There is very little opportunity for an investment advisor to insinuate himself into a gold purchase transaction, since most anybody who wants to hold the metal can visit their local bullion exchange or mint and buy as much as they’d like. Because the massive investment institutions that dominate the investment advisory business can’t make a fee out of advising you to buy gold, they try to convince you to purchase other asset classes which their firm has either originated or is a participant in a syndication of investment banks selling such products.Thanks to the widespread coverage of the questionable integrity of these complex securities, and since many main street investors have been burned by their investment advisors (they feel), there is increasing main street advice being doled out to buy gold. One need only search Google news on any given day to discover that headlines critical of gold are now replaced with headlines singing its praises.
  5. Gold is the best performing asset class of the decade
    Now that the global financial meltdown has got up a head of steam, investors are hard pressed to find any investment that has performed well over the last ten years as consistently as gold. The chart below outlines this performance and appears here courtesy of James Turk’s GoldMoney.com.
Gold Performance: 2001-2008 (click to enlarge)
Gold Performance 2001 - 2008

As you can see, any investment still returning an average of 10 – 17 percent is a winner, compared to everything else you can generate a chart for. As this intelligence permeates the none-too-quick popular investment imagination, and, combined with the other 4 factors, gold is going to be where the world’s next crop of millionaires is minted.

===========================================

Share this:

  • Reddit
  • Facebook
  • LinkedIn
  • More
  • Twitter
  • Pinterest
  • Tumblr
  • Print
  • Email

Like this:

Like Loading...

The U.S. Dollar and Deficit-Gold Relationships

08 Thursday Jan 2009

Posted by jschulmansr in Bollinger Bands, capitalism, commodities, Copper, Currency and Currencies, deflation, Finance, Fundamental Analysis, gold, hard assets, How To Invest, How To Make Money, Investing, investments, Latest News, Make Money Investing, Markets, mining companies, mining stocks, Moving Averages, oil, platinum, precious metals, silver, small caps, Stocks, Technical Analysis, Today, U.S. Dollar, Uncategorized

≈ Comments Off on The U.S. Dollar and Deficit-Gold Relationships

Tags

agricultural commodities, alternate energy, Austrian school, banking crisis, banks, bear market, Bollinger Bands, bull market, capitalism, central banks, China, Comex, commodities, communism, Copper, Currencies, currency, deflation, depression, diamonds, dollar denominated, dollar denominated investments, economic, economic trends, economy, financial, Forex, futures, futures markets, gold, gold miners, hard assets, heating oil, India, inflation, investments, Keith Fitz-Gerald, market crash, Markets, mining companies, Moving Averages, natural gas, oil, palladium, Peter Schiff, physical gold, platinum, platinum miners, precious metals, price, price manipulation, prices, producers, production, protection, rare earth metals, recession, risk, run on banks, safety, Saudi Arabia, Sean Rakhimov, silver, silver miners, socialism, sovereign, spot, spot price, stagflation, Technical Analysis, timber, U.S. Dollar, volatility, warrants, Water

My Note- Gold came roaring back today and being beaten down yesterday, currently Gold is up $15 at $856+ and holding above the $850 level. Today’s articles explore the relationship of the U.S. Dollar, the Deficit and National Debt; and their relationship to Gold prices. If you are not alarmed by the current deficit you should be! Now with Obama predicting a yearly deficit of over 1 Trillion dollars what does this mean for the Economy, the Dollar and the price of Gold? Read On and Find Out… Good Investing – jschulmansr

Things We Don’t Talk About (But Should); National Debt and the $2 Trillion Deficits- Seeking Alpha

By: Jonathan O’Shaughnessy of Emerginvest Blog & Emerginvest 

It has been around for decades, and has been ignored by many for just as long. However, the US national debt stands to finally be thrown into the forefront of political discussion as the record for a single-year deficit looks to be beaten – by threefold.

According to the government-run TreasuryDirect.gov, US national debt is the largest it has been in history at $10.6 trillion, or $10,638,425,746,293.80. This is at a time when the US is facing the worst economic crisis since the Great Depression, which requires record-shattering government spending to stabilize the faltering economy. In addition, global demand for US national debt is waning as countries world-wide are implementing their own financial stimulus packages. Yet economists are virtually unanimously advocating for radical government spending to stabilize the economy, which leaves future generations of Americans holding extremely large amounts of national debt.

The problem for the average American is twofold: national debt doesn’t seemingly affect their daily lives and $10.6 trillion is a hard number to conceptualize. After a certain point, the human brain stops comprehending the magnitude of a given number, and simply categorizes it as “extremely large.” Subsequently, there is little public outrage or discussion when the US has run up a few hundred billion dollar deficit in years past. It doesn’t seem to affect their lives, no government projects are cut, and adding $0.2T onto $10.6T seems relatively insignificant.

However, when viewed in another light, the enormity of the national debt is astonishing. According to the 2007 United States budget, and TreasuryDirect.gov, the interest alone on national debt is approximately $460 billion. It accounts for the second-highest expenditure on the US budget and if the US could forgo paying that interest on national debt for one year, the United States government could:

1) Pay for the entire education budget of the United States six times over

2) Reduce federal taxes by 33% for all Americans, or

3) Write a check to every man, woman, and child in the United States for $1,500.

Yet, that $460 billion in annual interest looks to grow substantially with looming deficits in the years to come.

A New York Times article entitled “Obama Warns of Prospect for Trillion-Dollar Deficits,” stated: “President-elect Barack Obama on Tuesday braced Americans for the unparalleled prospect of ‘trillion-dollar deficits for years to come.’” President-elect Obama did not give details about the size of the deficit, but projections place the proposed deficit at close to $1.2 trillion for 2009, shattering the record from President Bush last year at $455B.

That is not counting the proposed $800B 2-year stimulus package which could easily raise the deficit into the $1.7 trillion range – bringing the national debt to roughly $12.3 trillion by the end of 2009. Assuming deficits run at approximately $1 trillion per year for the next two years, which may or may not be conservative, the US could see its national debt as high as $15 trillion in three years.

Subsequently, Obama added emphasis on tighter government regulation, quoted in the NYTimes article as saying: “’ We’re not going to be able to expect the American people to support this critical effort unless we take extraordinary steps to ensure that the investments are made wisely and managed well.’” In correlation, he created a new position, chief performance officer, in charge of eradicating government inefficiencies.

This comes at a time however, when global demand for US debt is falling sharply. A prime example is China, one of the largest creditors to the US, which has heavily curtailed its purchases of US debt in light of the recent financial crisis. Another NYTimes article entitled: “China Losing Taste for Debt from U.S.,” states that: “China’s foreign reserves will increase by $177 billion this year — a large number, but down sharply from an estimated $415 billion last year.” The Chinese government is dealing with their own economic woes – a stock market which has shed two thirds of its value in the last year – and is attempting to implement their own economic stimulus package. Furthermore, the sharp outflow of foreign direct investment in China has further complicated the issue. The situation is similar across the world, as the Emerginvest heat map shows the damage from the past quarter (click to enlarge):

The lack of global demand for US national debt could put severe pressure on US interest rates in the years to come if demand continues to shrink drastically. However, there is a political buffer, as the article stated that: “China’s leadership is likely to avoid any complete halt to purchases of Treasuries for fear of appearing to be torpedoing American chances for an economic recovery at a vulnerable time, said Paul Tang, the chief economist at the Bank of East Asia. ‘This is a political decision,’ he said. ‘This is not purely an investment decision.’”

Yet even in the face of significant strain on government debt and sagging global demand, economists are virtually unanimous in calling for exorbitant amounts of government spending to stabilize the economy. Yet another NYTimes article entitled: “A Crisis Trumps Constraint,” states that: “To a degree that would have been unimaginable two years ago, economists and politicians from across the political spectrum have put aside calls for fiscal restraint and decided that Congress should spend whatever it takes to rescue the economy,” in addition to: “’It pains me to say that because I am a fiscal conservative who dislikes budget deficits and increases in government spending,’ Mr. Feldstein told the lawmakers. But he said, ‘Reviving the economy requires major fiscal stimulus from tax cuts and increased government spending.’”

Therefore, it looks as if the U.S. is inexorably tied to unparalleled government spending in the short term, nearly guaranteeing a national debt of over $14 trillion within a few years. The Obama administration has hinted at overhauling Medicare and Social Security as ways of dampening the gargantuan deficits, but the method, and certainly the net effect of such an undertaking remains ambiguous until the budget is revealed. It seems as if, in the interest of short term self-preservation, future generations of Americans will be inevitably saddled with incomparable amounts of national debt which will heavily shape future American fiscal policy for decades.

Disclosure: Emerginvest is an international finance portal, providing analysis and data on 120+ world markets to help individuals find investments from around the world. Emerginvest provides impartial information about world stock markets, and does not have any holdings in foreign equities.

===============================================

Government Panic Could Herald Dollar Panic – Seeking Alpha

Source: John Browne of Euro Pacific Capital

One of the few things more troubling for an economy than government intervention is government intervention driven by panic. Time and again, history has shown that when governments rush to engineer solutions to pressing problems, unintended difficulties arise.

In the current crisis, there is growing evidence that Washington is in a state of increasing panic. Despite its massive cash injections, market manipulations and ‘rescue’ plans, the recession is clearly deepening and spreading. With little to show thus far, politicians don’t know if they should redouble past efforts, break ground on new initiatives, or both. However all agree, unfortunately, that the consequences of doing too little far outweigh the consequences of doing too much.

Although there are many parallels between the current crisis and the Crash of 1929, one key difference is the global profile of the U.S. dollar. In 1929, the dollar was on the rise, and would soon eclipse the British Pound Sterling as the world’s ‘reserve’ currency. Furthermore, the American economy was fundamentally so strong that in 1934 America was the only major nation able to maintain a currency tied to gold.

Ever since, the U.S. dollar’s privileged ‘reserve’ status has been a principal factor in America’s continued prosperity. The dollar’s unassailable position has enabled successive American governments to disguise the vast depletion of America’s wealth and to successfully increase U.S. Treasury debt to where the published debt now accounts for some 100 percent of GDP. The total of U.S. government debt, including IOU’s and unfunded programs, now stands at a staggering $50 trillion, or five times GDP! If the dollar were just another currency, this never would have been possible.

In today’s crisis however, the dollar is likely making its last star turn as the leading man in the global financial drama. Other stronger, less burdened currencies are waiting in the wings for the old gent to take his final bows.

The dollar’s demise is being catalyzed by the neglect of the Federal government. Instead of enacting policies that would restructure the U.S. economy, and restore productive, non-inflationary wealth creation, Congress is simply financing the old crumbling edifice.

Faced with the growing realization that America is not doing the work necessary to right its economic ship, it will not be long before America’s primary creditors begin to seriously question the nation’s ability to service, let alone repay, its debts.

There is now the prospect (inconceivable until recently), that America could lose its prestigious ‘triple-A’ credit rating. In today’s risk adverse market, this could cost the Treasury one percent in interest on long bonds. Each additional percentage point of interest would cost America some $10 billion a year on each trillion dollars of new debt, or some $300 billion over the life of a 30-year bond.

Many of the foreign governments who hold huge amounts of U.S. dollar Treasury debt, such as China and Japan, have announced plans to spend money on their own ailing economies. Should these foreign central banks divert to domestic initiatives some of the funds used to buy U.S. Treasuries, serious upward pressure on U.S. interest rates will result. Should they actually sell parts or all of their holdings they will likely put serious downward pressure on the U.S. dollar. Last week, a Chinese official claimed the U.S. dollar should be phased out as the world’s ‘reserve’ currency.

In the short term, as dollar ‘carry-trades’ continue to be unwound and questions of political will and falling interest rates haunt the Euro and some other currencies, the U.S. dollar may be the recipient of some upward appreciation. But with the American government appearing increasingly to be in panic mode, a run on the U.S. dollar could develop rapidly into cascading devaluation. Even if no such panic run materializes the long-term outlook for the U.S. dollar is one of high risk and low return. This beckons major upward pressure on precious metals.

========================================

What is Going On With Gold? – Seeking Alpha

Source: The Pragmatic Capitalist

Gold (ETF:GLD) is one of the most fascinating and talked about assets on the planet. There are more conspiracy theories and story lines behind gold than just about anything on earth. Heck, the followers of the asset even have their own club: the goldbugs. You can’t go a day without seeing a commercial about gold. If you google “buy gold” you get almost as many results as if you search “buy real estate” (15.4MM vs 16MM).

But gold has been acting funny lately. The conspiracy theories have been running even crazier than usual (from government conspiracy to backwardation) and the goldbugs are angry. As the world economy deteriorates and the U.S. prints money like it’s going out of style, gold has not appreciated. If you had told me in December of 2007 that the global stock market would fall 40% in 2008 I would have told you to buy gold and nothing else because of its safehaven characteristics. But a funny thing happened on the way to the demise of the global economy: Gold fell.

After rallying into the second quarter of 2008, gold went on a gut wrenching 6 month decline of over 30% – all in the midst of one of the greatest financial collapses ever. It was, if nothing else, quite a paradox. Even crazier, the US dollar stabilized and then rallied into the end of 2008. Why did this happen? How could gold fall in such an environment?

Gold remains an anti-dollar investment. It’s as simple as that. When you buy gold you’re essentially buying a hard asset currency with the hope that one day it will become the world’s choice of currency again. If the dollar (UUP) weakens or one day fails the likelihood of a gold based currency increases. In essence, buying gold is a way of betting against the greenback and U.S. economic dominance. You can argue the extent of my argument, but you can’t really argue with the inverse correlation in the two assets:

Click to enlarge

The correlation is clear. If you’re betting on a rise in gold you’re betting on a falling dollar. I’ve been banking on a higher dollar for over 6 months for one reason: it’s the best currency in a bad lot. Jim Cramer should change his area of expertise to currencies, because while there isn’t always a bull market in stocks and commodities, there is always a bull market somewhere in the currency market. Trades are paired in Forex and unfortunately, it’s hard at this time to make an argument in favor of other currencies over the greenback. And as long as the greenback remains strong it’s unlikely that gold will make any sustainable run.

So why is the dollar the best of the worst? It’s quite simple in my mind. Two major currencies on the planet now effectively bear zero interest: the dollar and the Yen. Of the two, the U.S. is the far superior economy. In essence, neither country can really devalue their currency all that much more unless they decide to print money to the point of insanity and although I believe the U.S. is printing wildly I am not incredibly alarmed as of yet simply because the destructive deflationary forces at work are so much greater than the inflationary response by the Fed. Inflation is certain to rear its ugly head in the coming years, but I suspect it will be relatively mild as the economic rebound is slow and the overall monetary destruction of this deflationary phase proves to be incredible.

So, getting back to the greenback – the U.S. was first to enter a recession and it now looks like the world is catching pneumonia from our cold. Unfortunately Europe and Asia still have relatively high interest rates (read: room for currency devaluation) and simply don’t carry the same status as the U.S. – we are the reserve currency and the only true AAA nation. Yes, you can certainly make the argument that the U.S. is no longer a AAA rated country, but if we’re AA then what does that make Japan (the world’s second largest economy) or Germany? Much worse, in my opinion.

So what we’re seeing is essentially a flight to quality in a time of financial distress? Yes, that’s right, the U.S. dollar is a higher quality asset right now than just about any currency on the planet. And if you’re a U.S. citizen you should be thanking your lucky stars it’s THE reserve currency because this crisis would likely be even worse if that wasn’t the case.

So, before you go placing bets on gold it might be better to research the greenback first.

==================================================

Not Time To Exit Commodity Positions – Seeking Alpha

By: J.D. Steinhilber of Agile Investing

Diversified commodities have suffered approximately the same one-year decline as stocks, but the descent has been more violent since broad commodity indexes peaked in the middle of 2008, whereas most stock indexes peaked in October 2007. Just as it is not the time to abandon stock market commitments, this is certainly not the time to exit commodity positions in the context of a diversified multi-asset portfolio.

Cyclical commodities are not a valuable hedge to a stock portfolio in a deflationary bust and a liquidity crisis such as we have seen, but those conditions are not likely to persist over any investment horizon measured in years rather than months. Massive government reflation and stimulus efforts will support hard assets in 2009. Infrastructure spending is bullish for commodity prices, and tighter credit conditions, along with lower prices, puts pressure on the supply of commodities as suppliers curtail production.

Gold finished the year on a very strong note and managed to produce another year of positive returns in 2008. Gold has the most attractive three and five year annualized returns of all the asset classes we track. Gold will continue to be whip-sawed by the volatility in the currency markets.

We hold Gold (GLD) in our portfolios as an insurance policy against financial crisis and paper currency devaluation. The opportunity cost of holding gold, which produces no dividend or interest income, is now very low given that the Federal Reserve has cut the official U.S. overnight lending rate to zero to 0.25%, and has stated that “weak economic conditions are likely to warrant exceptionally low levels of the federal funds rate for some time.”

[click to enlarge]


===================================================

How Will Obama’s “Trillion Dollar Deficits” Affect the Markets? – Seeking Alpha

By: Simit Patel of Informed Trades.com

The New York Times has an article this week reporting on US President-elect Barack Obama’s warning that there will be ‘trillion-dollar deficits for years to come.” What does that mean for the markets?

The first line of recourse will be the issuance of Treasury bonds; in other words, the US government will look to borrow money, offering to pay it back with interest. The key question, though, is to what extent buyers of Treasuries will be easily found. As we have discussed previously, the very low yield on bonds coupled with the fact that the economic pains are being felt all around the world suggest one of two possibilities: bond rates will have to go up or the Federal Reserve will have to “monetize the debt” — meaning it will simply have to print more money.

I have stated and continue to believe that the result of increased deficit spending, due largely to government bailouts, in this environment will be debt monetization (even if there is a rate hike, that will only increase the future debt, and thus will only delay and exacerbate debt monetization). I believe this will prove to be inflationary, that it will devalue the US dollar, and that this is the real way the bailouts will be paid for; not via a direct tax, but rather a tax through inflation. Economist Mike Shedlock, however, offers a counter viewpoint:

The Fed at some point will resort to out and out monetization, and that will have the inflationists screaming at the top of their lungs. However, banks will still be reluctant to lend, and consumers and businesses will be reluctant to borrow. In addition, I expect the velocity of money printed to be close to zero and for the savings rate to rise. In aggregate, these are not hyperinflationary things. Heck, they are not even inflationary things.

Admittedly, I am one of those inflationists who will be screaming at the top of my lungs.

There are two reasons I believe debt monetization will be inflationary:

  1. I disagree with the notion that banks won’t lend and consumers won’t borrow. As I recently noted, we are seeing a declining TED spread as well as an increase in many money supply metrics (M1, M2, MZM). And even in this environment, we have seen companies like Verizon be able to secure a massive $17 billion loan.
  2. Even if lending is reduced due to the economic climate, debt monetization increases the likelihood that foreigners will not only stop buying Treasuries, but that they will sell the ones they have, and will dump US dollar holdings out of a concern of dollar devaluation by the part of the Federal Reserve. This suggests there will be a “run on the currency,” similar to what was seen in Argentina. See our previous article on the similiarities between the US economic crisis and the Argentinian crisis of 2001 for more on this subject.

How to Trade This Scenario

Timing is the key issue for trading this; we are currently seeing a rally in the market, though I expect that at some point in the second half of 2009 we will see the concerns about the Treasury market begin to manifest. As a trend-following trader I look for momentum that corresponds to my fundamental viewpoint, with the exception of precious metals, which I treat as buy and hold type investments.

With that in mind, here are the conclusions I am making based on the trillion dollar deficit scenario:

  1. US dollar will fall in value. For stock market traders, UDN is an ETF to watch.
  2. Dollar hedges like gold and silver will rise. GLD and SLV are corresponding ETFs.
  3. Both monetization of debt as well as a hike in interest rates will send bond prices falling, as a rate hike devalues all bonds previously issued at a lower rate while monetization of debt introduces inflation concerns and the possiblity of the bond being paid back with a currency that is worth less.
  4. A rate hike, which I think is increasingly unlikely given the Fed’s behavior though still possible, will be bearish for US stocks. DOG and SH are inverse ETFs worth considering in such a scenario.

Disclosure: Long gold and silver; currently short US dollar against Australian dollar.

==============================================

My Note: Whether as “Portfolio Insurance”, or as a Speculative Investment, I think now is the time to buy and Invest in  Gold and Precious Metals in any form. I am calling for $1000 to $1250 Gold later this year and even higher if the Middle East Situation disintergrates and gets worse. Other factors are mentioned in detail above, don’t kick yourself later, buy Precious Metals and Miners at these ridiculously low levels NOW!

My- Disclosure: I am long Physical Precious Metals, Etf’s, and Mining/Producer Stocks. I.e. my money is where my mouth is! Remember to do your own Due Diligence and read all Prospectus’s before making any investment. -jschulmansr

Share this:

  • Reddit
  • Facebook
  • LinkedIn
  • More
  • Twitter
  • Pinterest
  • Tumblr
  • Print
  • Email

Like this:

Like Loading...

Gold-History Repeating Itself?

06 Tuesday Jan 2009

Posted by jschulmansr in Bollinger Bands, capitalism, commodities, Copper, Currency and Currencies, Finance, Fundamental Analysis, gold, hard assets, How To Invest, How To Make Money, inflation, Investing, investments, Jschulmansr, Latest News, Make Money Investing, Markets, mining stocks, Moving Averages, oil, precious metals, silver, small caps, Stocks, Technical Analysis, Today, U.S. Dollar, Uncategorized

≈ Comments Off on Gold-History Repeating Itself?

Tags

agricultural commodities, alternate energy, Austrian school, banking crisis, banks, bear market, Bollinger Bands, bull market, capitalism, central banks, China, Comex, commodities, communism, Copper, Currencies, currency, deflation, depression, diamonds, dollar denominated, dollar denominated investments, economic, economic trends, economy, financial, Forex, futures, futures markets, gold, gold miners, hard assets, heating oil, India, inflation, investments, Keith Fitz-Gerald, market crash, Markets, mining companies, Moving Averages, natural gas, oil, palladium, Peter Schiff, physical gold, platinum, platinum miners, precious metals, price, price manipulation, prices, producers, production, protection, rare earth metals, recession, risk, run on banks, safety, Saudi Arabia, silver, silver miners, socialism, sovereign, spot, spot price, stagflation, Technical Analysis, timber, U.S. Dollar, volatility, warrants, Water

Today’s action: Gold opened down by a few dollars and now has reversed itself and is cusrrently up $7-10 oz. Based off of chart formations it would appear that  Gold is breaking out to the upside and getting ready to challenge the $900 level, If it can break that then we are set up for a test of the $950-$975 level. If it fails here, a pullback to the $800 level (support base) will probably occur. Today’s articles include one about a new 2yr gold price cycle that appears to be forming. Next some questions answered about the markets for 2009. Finally a special report from Gold World about Gold Backed Banking. Enjoy and good investing! – jschulmansr

Gold’s 2-year cycle – MineWeb

A Mineweb reader has noticed a recent two-year cycle for gold price behaviour which, if it continues will likely give some guidance to price movements this year and next.

By: Joseph Cafariello

EDMONTON, CANADA –

There seems to be a two-year cycle in the gold price which has been repeating itself since about 2004.  The even years follow one pattern, while the odd years follow another pattern.  The even years tend to reach exaggerated extremes to the upside and to the downside on a percentage basis, while the odd years tend to be a little calmer with less volatility.

For example, 2008 went very much like 2006, with exaggerated highs reached in the spring of each year, and a late start to the traditional autumn-winter-spring upswing, which began around October/November of 06 and 08.  On the odd-number side, 2007 went much like 2005, with moderate highs reached in May of each year, and an early start to the traditional autumn-winter-spring upswing, which began around August/September of 05 and 07.

If this is indeed a reliable cycle, we can expect 2009 to be much like 2005 and 2007 all throughout the year.  The first half of 2009 should see gold follow the same pattern as the first halves of 2005 and 2007.  In the springs of 05 and 07, gold kept hitting its head against the previous year’s high all throughout the spring.  More than once during the spring of 2007, gold topped out at about $690, coming to within about 5% of the 2006 high of $735.  Similarly, the spring of 09 should see gold hitting its head against 2008’s high of $1,035, coming to within 5% of it, or up to about $985.  That will be the high for the first half of 2009 at around the beginning of May, though this will not be the high for 2009 as a whole.

Given the odd-number year pattern, we might also expect the back half of 2009 to be much like the back halves of 2005 and 2007.  In both 2005 and 2007, the summertime pull-backs were modest, and the autumn-winter-spring upswings started early, at around August/September of 05 and 07.  The latter half of 2009, then, should see a modest summer-time pull-back of about 5% to 7% of its spring 09 high, taking gold down from $985 in May 09 to about $925 by August 09.  However, the low for 2009 will still be the upcoming January low of $800, which is now only about a week or two away.  The lows of January 2005 and January 2007 were also “the” or “close to the” annual lows for those years.  So the low of 2009 will be at around $800 in January.

The high for 2009 will come in December.  The traditional autumn-winter-spring upswing in 2009-10 will be much as it was in 2005-06 and 2007-08, with an early start.  The year-end run for 09 will begin around August or the beginning of September, jumping from about $925 in Aug/Sep 09 and rising steadily until the end of December 09.  The annual highs for 2005 and 2007 were hit in or near December of each year, and each high was about 20% higher than the average of their first halves.  Thus, the annual high of 2009 will be hit in or near December, and will be 20% higher than the average of its first half, putting the 2009 high at about $1,150 in December.

The traditional autumn-winter-spring upswing, however, will certainly not end in 2009, but will spill over into the spring of 2010 much as it did in the springs of 2006 and 2008.  The high in the spring of 2008 was about 40% higher than high in the spring of 2006.  Hence, the high in the spring of 2010 will be about 40% higher than 2008’s high of $1,035, putting gold at about $1,450 in the spring of 2010.  Then, the summertime pull back of 2010 will be just as stark as were the summertime pullbacks of 2006 and 2008.

And so the two-year cycle will continue, where even-number years follow a pattern of extremes, while the odd-number years are calmer, but with a nice upward kick at the end.  This two-year cycle with even-number years on the extreme side and odd-number years on the moderate side will continue until the commodity boom is over (say around the year 2030, when the populations of China and India finally achieve a 75% middle-class), and until the US dollar recovers at around the same year (2030), when the rest of the world will be looking to the US as a nice place to shop given its then-to-be dirt-cheap dollar.

The above comment was contributed by Mineweb reader Joseph Cafariello who describes himself as “A raving gold bug and proud of it”

==========================================

2009 Market Q&A: Four Questions Answered – Seeking Alpha

Source: Eric Roseman of The Sovereign Society

By Eric Roseman

Over the last several weeks I’ve received numerous questions from Sovereign Society subscribers, including individuals who frequent our daily blog.

As we start 2009, I thought this would be an ideal forum to collect some of these important questions and attempt to give you my best conclusions. I can’t reprint all of these inquiries; but I’ve compiled several excellent questions from our members.

Overall, I don’t like forecasting. I generally believe it’s a total waste of time and most consensus estimates ahead of 2008 ended in the basement with the majority of analysts dead wrong about the economy, the market and just about everything else.

I have to admit that I never expected the markets to crash, the banking system to go bust or the dollar to skyrocket in the midst of the worst financial crisis in 75 years. To be fair, I think most pros failed to make accurate predictions.

Question: I’m a retired investor living on income. Prior to the big rally in Treasury bonds, I held most of my savings in short-term Treasury’s and bank term deposits. But with short-term rates under 1% and government bonds yielding a pittance, I’m nervous. What should I do to supplement my income?

Comment: This is perhaps the most challenging environment for retirees in more than a generation. With money-market funds yielding almost nothing, Treasury bonds yielding around 2% and bank CDs paying under 1%, retirees must supplement their income.

My advice is to take a small portion of your savings, say 20%, and scatter that sum across a dozen or more investment grade corporate bonds. I emphasize “investment grade” and not junk debt. Investment grade debt includes anything rated BBB or better in my book and, to make it easier, I would stick to issues rated A- or higher.

The Dow Jones Corporate Bond Index now yields 6.90% – down from its post-crash high yield of 8.87% in early $100 bill imageOctober. Still, investors can tap into non-financial bonds like IBM, Johnson & Johnson (JNJ), Wal-Mart (WMT) and Kraft Foods (KFT) – all paying 5.5% or more. Or, look at corporate bonds issued by America’s largest banks, including JPMorgan Chase (JPM), Goldman Sachs (GS), Wells Fargo (WFC) and US Bancorp (USB). These banks won’t default.

A good strategy to keep things simple is to buy a laddered portfolio of corporate bonds ranging from two years all the way to seven years. This should at least give your nest egg a boost and if you feel comfortable with this formula, then increase your position to say 35% of your portfolio. But remember, don’t go whole-hog; at some point over the next 12 months, perhaps later, Treasury bond prices will get smashed and long-term rates will head higher as the government expands credit to the moon. Keep your powder dry.

Question: Do you think we’ll avoid another Great Depression? Despite all the money thrown at the markets since late 2007 we’re still in the midst of a severe credit contraction and the global economy has literally fallen off a cliff since October.

Comment: I think we’ll avoid another Great Depression but only because government will nationalize or partially nationalize key industries. Without government intervention, the free market would have resulted in massive failures and a total collapse of the banking system and the broader global economy. There’s no doubt in my mind that the government made a big mistake not rescuing Lehman Brothers last September. Once you’re bailing out major banks, then do it right. But in all honesty, we don’t know what transpires behind the Fed’s walls or the Treasury’s. There’s some crazy buddy system in progress with special interests influencing government policy. The government doesn’t give a damn about you or me. What they care about is protecting their interests. That’s why we must protect our assets and, in the end, I believe gold will triumph above all paper money, especially against the dollar.

I don’t advocate government intervention; but these are not normal times and the consequences might have resulted in the death of capitalism and perhaps the emergence of a new social order, similar to what occurred in post-Weimar Germany in the 1920s. Harsh economic times usually result in a new socio-economic regime. If the Fed and Treasury fail to rescue the credit system, then we might face similar consequences. The world as we know it will come to an end.

It’s hard to know exactly what goes on behind the Federal Reserve’s closed doors and at the Treasury’s. Thus far, government efforts have been bold since the October crash, including major central banks worldwide. Major credit indicators have indeed improved since November but the housing market – the crux of the crisis – is still in a freefall. Housing must stabilize before this severe recession ends.

In my eyes, it seems that bailouts and backstops are not addressing the real problem; most TARP money is ending up in bank coffers again and, in most cases, these institutions aren’t lending. The core of this credit crisis lies with the consumer and with housing. If you’re going to fork out several trillion dollars to fix or remedy this crisis then give the money to the consumer – not the banks. The consumer is in a severe bear market with personal assets plummeting over the last 18 months, including real estate, stocks, most bonds and now, possibly his or her job might be next on the chopping block.

Give consumer households $50,000 or more and allow them to clean-up their busted balance sheets, keep their homes (service mortgages) and pay off installment debt. You might not agree with me and, in all fairness, it’s against the tenets of the Sovereign Individual; but what good will all this money do if it’s basically squandered by government and ending up in the pockets of reckless bankers again? I have serious doubts about how the government is dealing with this crisis and I don’t think Obama’s spending package will help much at all despite perhaps growing the economy for a few quarters.

Question: What about the banks? With governments now standing behind their biggest financial institutions, is the worst over?

Comment: The global banking system, for all intents and purposes, is effectively bust or bankrupt. This is especially the case in the United States, Europe and, to a lesser extent, in Japan. More than a dozen emerging market banks are totally bust, including Iceland, the Baltics, Hungary, Romania, Bolivia, Ukraine, Ecuador, Argentina, etc. Not a pretty picture.

I think we’re more than 75% through the worst at this juncture. Governments now stand behind the largest banks in each country and, in some cases, even guarantee entire deposits until 2010 (e.g. European Union). I wouldn’t worry about the largest banks failing at this point. The worst is now behind us.

Question: I know you’re a big gold bug, but isn’t the euro a strong currency and do you think it’s a better hedge against the dollar than gold? Is it too late to purchase gold coins and, if not, where would you suggest I buy coins?

Comment: I have absolutely zero faith in the U.S. dollar and other currencies, including the euro or yen. In the end, all currencies will decline vis-à-vis gold and, in fact, since 2005 the world’s currencies have been losing their relative value to gold bullion. Despite big moves by the yen and euro over the last several years, they pale against gold.

Increasingly, the average man in the street will realize that paper money is not protecting his purchasing power and will revolt against fiat money. At The Sovereign Society, we’ve driven home this message since our first year of publication in 1997. Gold is the only asset in this world that isn’t someone else’s liability; with U.S. interest rates effectively at 0%, paper money now competes with gold, which also pays 0% interest. In a zero percent world, which asset would you rather own? I think the answer is obvious.

The government’s enormous spending plans to rescue the financial system and bailout almost every ailing industry Gold Coin Imageassures dollar destruction because the Fed is now on course to print money like never before to quash deflation. We all better hope and prey that the Fed can drain excess bank liquidity very quickly when this credit crisis ends. If not, we’ll have some serious inflation – much worse than what we saw prior to July 2008.

I think every investor should hold at least 10% of his assets in physical gold. This means coins, wafers or bars. Getting gold coins today is difficult because the U.S. Mint has stopped selling Eagles since last summer while other dealers are complaining about tight supplies amid booming investor demand. I suggest KITCO or First Federal Coin Corporation.

Also, I would not hold or store all of my physical gold at my home domicile. I strongly suggest parking some of your gold in Switzerland, too. Remember, you must report assets outside of the United States and Canada.

I’m convinced we’ll see some sort of government confiscation of gold again just like we did in the 1930s. Back then, FDR did allow Americans to hold a maximum of 100 ounces. I’m not so sure the next confiscation will be so generous.

I hope you found this helpful.

===============================================

2009 Gold Outlook – Gold World

How To Invest in Gold in 2009

By Luke Burgess

The investment markets are yielding to the fact that the global economy will remain weak for the better part of 2009.

As a result, investors will continue to seek safe havens.

Under normal conditions, these safe haven investments would include land and real estate. These assets have intrinsic value; or in other words, their value will never fall to zero. But with falling prices, investing in real estate is out of the question for most people right now. And there’s little doubt that investors will look elsewhere for safety against financial crisis.

The best safe haven asset in the world right now is still gold because it is never considered to be a liability.

And we believe that safe haven investment demand will drive gold prices during 2009. With this in mind, we would like to present a broad overview of Gold World‘s 2009 gold outlook. But before we get into that, let’s review what happened to gold prices in 2008.

Gold Was One of the Best Investments of 2008

In March 2008, gold prices hit a record high of $1,033 an ounce as the gold bull market entered its seventh year of life. This was followed by a normal 18% correction, which drove gold prices back down to $850 an ounce.

Gold prices subsequently rebounded and were once again closing in on the $1,000 level in mid-July. At the same time, however, the fundamental and psychological effects of the slowing housing and credit markets were just beginning to devalue significantly the investment markets across the board.

As a result, many long gold positions had to be sold in order to cover losses from investments in other markets. Over the next several months, this forced selling pressure pushed gold prices down.

Gold prices were also held down during the second half of 2008 as the U.S. dollar enjoyed a +20% rally. Foreign governments, institutions, and banks began buying the U.S. dollar, which despite a legion of problems continues to be the world’s most important reserve currency, as a hedge against domestic economic turmoil.

20090105_2009_gold_outlook.png

These factors contributed to a significant drop in the price of gold, which officially bottomed out for the year at an intraday low of $683 an ounce in October 2008.

Gold prices have subsequently bounced off of the $700 level as major selling has dried up, and fresh buying has come into the market.

Despite three 20% corrections and serious deflation in the market, gold exited 2008 with a positive 5.4% gain for the year. Although subtle, this gain outperformed every major equity index and commodity in the world. Here are just a few examples…

Index/Commodity
Percent Change During 2008
Dow Jones
-34%
NASDAQ
-41%
S&P 500
-39%
TSX -35%
TSX Venture -74%
Oil
-55%
Silver
-23%
Copper
-54%
Gold
+5%

This made gold one of the best investments of 2008.

And the 2009 gold outlook looks just as strong.

Gold’s 2009 Outlook

Despite a bit of downside in the immediate future, we expect gold to have a stellar year.

Global economic turmoil and deflation will undoubtedly continue to influence gold prices in the near-term. A short-term pullback in gold prices from current levels to $800—maybe even a bit lower—is not out of the question. However, we expect gold prices to break new records during 2009.

For our current perspective, we expect gold prices to reach as high as $1,300 during 2009, which would be a profit of over 50% from current levels.

Gold prices in 2009 will be supported more heavily by supply/demand fundamentals than in the previous years of this gold bull market.

As we’ve previously discussed, during the third quarter of 2008, world gold demand outstripped supply by 10.5 million ounces. This deficit was worth $8.5 billion and was the largest supply/demand deficit since the gold bull market of the 1970s.

Official 4Q 2008 world gold supply/demand figures will be calculated and reported later this month. Gold World will report them to you when the data is released.

In the meantime, though, all estimates suggest that there will be another very large deficit in world gold supplies from the fourth-quarter, with investment demand continuing to drive the market.

We expect that a continuing surge in investment demand could push gold prices as high as $1,300 at one point during 2009.

There will likely be a bit more volatility in the gold market in 2009 as more and more speculators come into the market. It is likely that the gold market will experience three or four price peaks (selling points) during 2009.

How to Invest in Gold for 2009

As we expect a near-term drop in gold prices as a result of continuing deflation, we are advising our readers to hold off on any physical gold buying for the immediate future. As previously mentioned, gold prices could dip back down to $800 before recovering again.

Nevertheless, we expect 2009 to be another great year for gold investors.

Good Investing,

Luke Burgess and the Gold World Research Team
www.GoldWorld.com

=================================================

Gold World Special Report – Gold Backed Banking

Special Report – Here’s How To Get Your Own Copy – Simply Subscribe

January, 2009

Gold Backed Banking

It’s a wonder Americans aren’t rioting in the streets.

Not including the $700 billion blank check issued to the banks and signed by the US taxpayer, the sum of liabilities assumed by the US government from the finance industry in the past 6 months alone exceeds 50% of the GDP.

Despite this unprecedented government intervention, the solvency of other every commercial and investment bank is still at stake!

Recognize this all-but-forgotten quote?

“The central bank is an institution of the most deadly hostility existing against the Principles and form of our Constitution. I am an Enemy to all banks discounting bills or notes for anything but Coin. If the American People allow private banks to control the issuance of their currency, first by inflation and then by deflation, the banks and corporations that will grow up around them will deprive the People of all their Property until their Children will wake up homeless on the continent their Fathers conquered.”
— Thomas Jefferson, Founding Father, Third President of the United States, and the principal author of the US Declaration of Independence

How bout a drink from the cup of truth…

The Bush administration’s $700 billion bailout plan may keep some banks afloat for the time being. But fundamental problems are still deeply rooted within the financial markets that threaten to bring down the whole system.

The hard truth is that there is no 100% safe place to keep your money.

Physical cash and gold are the safest places to hold your wealth right now. Anyone who tells you otherwise has either a motive or no clue.

Those with the means to do so should be holding at least some physical cash and gold.

Of course, people will debate why you should hold these assets…

Gold is the ultimate in hedging against financial turmoil. But as it stands today, it’s quite rare to find someone willing to trade a product or service for gold. In other words, it’s difficult to spend gold like money, which has been a criticism of owning physical gold for decades.

Today’s digital age allows consumers to move electronic fiat money around at speeds exponentially faster than ever before. This morning I paid my cable bill with my check card. The entire transaction was completed within 5 minutes. Had I paid by mailing a check, it could have taken up 1-2 days to reach the cable company and 3-5 days to clear my account.

So what if there was a way gold could be used as easily as electronic money?

The World’s Only “100% Backed-by-Gold Bank”

You might have a hard time believing this, but you can actually put yourself on a personal gold standard with a new kind of currency, and it’s rapidly growing among gold bugs.

Understand first, this new currency is not legal tender issued by any government. That means there’s no debt, inflation, geopolitical turmoil, or any other considerations normally associated with government-issued currency.

The currency comes in electronic form, but can be used like any other currency in the world today to pay for goods and services, and even settle debt. But there’s one major difference that sets this currency apart from every other in the world:

It’s 100% backed by gold.

In fact, in most cases you can instantly exchange this currency for physical gold at any time… a feature taken away from the US dollar decades ago.

This currency has a new system fully established, making it as easy to use as the current banking industry’s electronic money. Right now, in fact, there are already over 3,000 outfits—and climbing—in which you can pay online using this currency.

How the “Gold Bank” Works

Customers transfer funds from traditional bank accounts into these unique gold-backed bank accounts, and earn interest on their funds prior to placing an order.

Meanwhile, for customers already holding gold and silver in secured (and insured) vaults, their metals are insured and held in specialized bullion vaults. Their metals assets go through an annual audit, and are fully reported to customers.

Once customers’ funds are in the database, customers’ orders are made through its secure online system. Database servers record all transactions and store currency and metal balances.

The Advantages of Using this Currency?

Being backed by gold, the purchasing power of this currency fluctuates in relation to the price of gold.

This means that as the price of gold increases, the purchasing power of the account increases. On the flip side, however, if the price of gold falls, so does the value of the account. Nonetheless, the risk of significant price fluctuation in gold is small compared to the risk of value fluctuations among fiat currencies, especially the US dollar.

And despite a short-term correction, the price of gold has increased significantly over the past five years. So this factor has worked out to the advantage of anyone holding this currency over that period. And with +$2,000 gold on the horizon, holders of this currency should do quite well in the future.

Now you should know that I’m in no way affiliated with this service, nor do I receive any compensation from it. That said…

I Recently Put the Final Touches on my New Research Report…

This report shares all the details about the new gold-backed electronic currency, and it’s yours free after you take a risk-free trial of the Mining Speculator service.

It’s your chance to get in on the biggest and best buying opportunity in junior gold and silver stocks… ever.

That’s right. The junior gold market is about to blast off, after a brutal beat-down sparked by the financial crisis. Truth is, it’s pushed many gold and silver stocks to new lows…

… Which is why you don’t want to wait a minute longer to position yourself in the Mining Speculator’s mining and precious metals portfolio. Our team of analysts scour the earth for opportunities in gold, as protection against the financial uncertainties engulfing the U.S. and world markets.

It’s the ultimate opportunity in a period of great crisis.

You see, as our government continues to lose control of its ability to manage and prop up markets, gold and silver will undoubtedly make meteoric moves that will stun the populace.

And just in case you still harbor doubts about gold, consider this… reported last week in the Financial Times…

“… Investors in gold are demanding ‘unprecedented’ amounts of bullion bars and coins and moving them into their own vaults as fears about the health of the global financial system deepen.”

And since gold bullion is getting harder and harder to come by, more investors are looking for the next best alternative, and that’s…

Precious Metals Mining Stocks

Bottom line: Junior mining stocks will begin to make major moves to the upside, rewarding those who got in early and held on… and those who get in now at what are, frankly, bargain share prices.

You see, nothing can keep gold from doubling up and hitting $2,000 an ounce… causing shares in our mining exploration companies to skyrocket.

I’m talking about junior mining stocks with the potential to double, triple—even quadruple!

Of course, many people have trouble accepting gold as an investment—even now that they’ve witnessed a financial upheaval that’s shaken our country by the shoulders.

But I also know that those who have heard me out-and followed through with my research and recommendations-have made extraordinary, life-altering returns.

Which is why I maintain…

There’s never been a better time-a more crucial time-to protect your portfolio with gold and precious metals.

And for a brief time, we’re making it easy to do just that… for as little as $25.

To get immediate inside access to the junior mining companies poised for major run-ups – the ones I’ve visited firsthand and carefully selected after exhaustive research and quality controls – simply take a trial of my Mining Speculator advisory.

When you sign up for Mining Speculator, I will immediately send you the free report on the new gold-backed currency mentioned in this editorial.

So, for only $25 you’ll begin to receive my Mining Speculator junior stock advisory… one that held an average 212% gain over five years… plus you’ll get our new special report on “The World’s Only 100% Backed-by-Gold Bank.”

All you have to do is click here to get started.

Good investing,

Greg McCoach, Investment Director, Mining Speculator
Luke Burgess, Editor, Gold World

====================================================

My Note: I do not receive any renumeration or commissions for recommending either the Gold backed banking or the Mining Speculator. As Always be sure to do your own due diligence and read the prospectus before making any investments or deposits into financial institutions.-jschulmansr

Share this:

  • Reddit
  • Facebook
  • LinkedIn
  • More
  • Twitter
  • Pinterest
  • Tumblr
  • Print
  • Email

Like this:

Like Loading...

A Lesson In Geo-Political Energy + Gold News

05 Monday Jan 2009

Posted by jschulmansr in Bollinger Bands, capitalism, commodities, Copper, Currency and Currencies, deflation, diamonds, Finance, Fundamental Analysis, gold, hard assets, How To Invest, How To Make Money, inflation, Investing, investments, Latest News, Make Money Investing, Markets, mining stocks, Moving Averages, oil, Politics, precious metals, silver, small caps, Stocks, Technical Analysis, Today, U.S. Dollar

≈ 1 Comment

Tags

agricultural commodities, alternate energy, Austrian school, banking crisis, banks, bear market, Bollinger Bands, bull market, capitalism, central banks, China, Comex, commodities, communism, Copper, Currencies, currency, deflation, depression, diamonds, dollar denominated, dollar denominated investments, economic, economic trends, economy, financial, Forex, futures, futures markets, gold, gold miners, hard assets, heating oil, India, inflation, investments, Keith Fitz-Gerald, market crash, Markets, mining companies, Moving Averages, natural gas, oil, palladium, Peter Schiff, physical gold, platinum, platinum miners, precious metals, price, price manipulation, prices, producers, production, protection, rare earth metals, recession, risk, run on banks, safety, Saudi Arabia, silver, silver miners, socialism, sovereign, spot, spot price, stagflation, Technical Analysis, timber, U.S. Dollar, volatility, warrants, Water

My Note- Today I present an interesting article about the Geo-Political ramifications of the Battle for the Caspian Seas, plus some of the latest Gold News. Gold today is making a much needed correction in prices, if Gold can hold here and/or we have any increase in tensions of the Middle East; I think the next leg will take prices into the $900-$950 range.- jschulmansr

Geopolitical Energy Centered on the Caspian Sea – Seeking Alpha

By: Michael Fitzsimmons of Musings From the Fitzman

I’ve just finished reading a fascinating book authored by Lutz Kleveman entitled The New Great Game. The book is about Kleveman’s visits to all countries surrounding the Caspian Sea and to the countries involved in actual and proposed oil and gas pipeline routes required to bring Caspian Sea energy assets to the world market. He interviews an amazing cast of intriguing characters along the way.

The investigative journalist delves deeply into the geopolitical implications of world powers struggling to control Caspian Sea energy reserves – some of the largest remaining oil and gas fields in the world. It is fitting the game of chess was invented by the Persians. It is worth purchasing The New Great Game just to gaze at the maps on the inside and backside covers…each central Asian country being ruled by a government or dictator who one minute moves diagonally like a bishop, only years later to morph into a rook and move horizontally and vertically like a knight, and every once in awhile going hay-wire and imitating the unorthodox movement of a knight. Who will win the great game? What will OPEC’s response be to non-OPEC oil production in the Caspian Sea region? How will China and Russia respond to American military might in the region? Only time will tell.

The map below shows the countries surrounding the Caspian Sea which are Russia, Kazakhstan, Turkmenistan, Iran, and Azerbaijan.

Most people are fairly familiar with the oil history of Baku, Azerbaijan dating back to Russian oil discovery and production in the early 1870s. Kleveman relates an interesting story of Swede Robert Nobel who was the older brother of factory owners Ludwig and Alfred Nobel who had become very wealthy producing arms and dynamite. Robert had been sent to Baku with 25,000 rubles to purchase Russian walnut to make rifle butts. Instead, he caught Baku oil fever and bought a small refinery. After only a few years, the Nobel Brothers Petroleum Producing Company vaulted over Rockefeller’s Standard Oil as the largest oil producer in the world. Later, the Nobel’s invented the first oil tanker in a story well told in Daniel Yergin’s The Prize, for which, ironically, Yergin won the Nobel Prize for non-fiction literature in 1992. And yes, the prize is named after the same Nobel family as those men seeking walnut wood for rifle butts in Azerbaijan.

Fast forward to today: Baku Azeri oil is being shipped to the Mediterranean Sea and world markets via the so-called BTC (Baku-Tbilisi-Ceyhan) pipeline. The picture below shows the pipeline’s route from Baku, Azerbaijan through Tbilisi Georgia, and finally to the Mediterranean Turkish port of Ceyhan.

This pipeline was hailed as the “Contract of the Century” by Azeri officials very much interested in getting their oil to market independent of Iranian and Russian involvement. Of course, the US was more than mildly interested in this solution as well. The pipeline is owned by a consortium of energy companies, among them:

  • British Petroleum (BP): 30.1%
  • State Oil Company of Azerbaijan (SOCAR): 25%
  • Chevron (CVX): 8.9%
  • StatOil (STO): 8.71%
  • ConocoPhillips (COP): 2.5%

BP is the BTC pipeline operator.

The big question in today’s energy riddle is how to route the large energy assets of the Caspian Sea to the world market and thereby offer America an alternative to OPEC supplies. Take the giant Tengiz oil field, discovered of the coast of Kazakhstan, as an example. Estimated at up to 24 billion barrels of oil Tengiz is the sixth largest oil field in the world. It is one of the largest oil discoveries in recent history. The Tengizchevroil (TCO) joint venture has developed the field since the early 1990’s. The partners are:

  • Chevron: 50%
  • ExxonMobil (XOM): 25%
  • KazMunayGas (Kazakhstan): 20%
  • LukArco (Russia): 5%

Chevron has predicted that Tengiz could potentially produce up to 700,000 barrels of oil per day by 2010. The field also contains large reserves of natural gas. On the downside, the oil is very high in sulfur content, once reason western technology was so desperately required. Currently the oil from the Tengiz field is piped from Kazakhstan through Russia to the Russian Black Sea port of Novorossiysk via the CPC (Caspian Pipeline Consortium). The BTC pipeline is a competing option, preferred by the US to bypass Russia, but is expensive: the oil must first be tanked across the Caspian Sea from Tengiz to Baku, and then offloaded into the BTC pipeline infrastructure. French energy giant Total is interested in developing a common sense alternative pipeline through Iran which everyone knows is obviously the most economically viable solution, withstanding the geopolitical climate in Iran. Of course the US does not favor this route at all.

The US’s long favored route for Caspian Sea energy was first suggested and studied by Unocal (now part of Chevron). This countries involved in this route are highlighted in color in the picture below.

This so-called Central Asian pipeline was to begin with a natural gas pipeline from huge Turkmenistan gas fields through western Afghanistan to the Pakistani deep water port of Gwadar on the Gulf of Oman (Indian Ocean). The natural gas pipeline was to be followed by an oil pipeline along the same route, serving not only the energy starved countries of Pakistan and India, but the world energy markets as well. The US believes this route, bypassing Russia and Iran, as well as the congested Straits of Hormuz, is in the strategic interest of the US as a secure non-OPEC source of oil.

But the key word in the last sentence was “secure”. Unilateral policy decisions by the US in Iraq and elsewhere have instigated a tide of central Asian anti-American resentment. The Taliban, once supported and funded by the US, are now in control of the pipeline’s route. The pipeline project has been delayed until “control” and “security” has been established. Anti-American opposition in Pakistan is also a problem, regardless of that countries dire need for the energy and potential income the pipeline could deliver.

The US’s oil centric foreign policy agenda is apparently to irritate the two major powers in the Caspian Sea region: Russia and Iran. With the USSR’s disintegration in 1991, all the former Soviet states in the region were being eyed for their energy reserves. At the same time, Russia still considers these former states as within their “sphere of influence”.

Instead of joining with the Russians in mutually beneficial energy projects, technology transfers, and contracts, the US instead decided to take the opposite approach: it first propped up a government in Georgia irritating the Russians. Then the US supported NATO membership for former USSR countries Ukraine and Georgia. The US also proposed missile defense systems on Russia’s western borders, further infuriating the Russians. Russia finally had enough and acted in Georgia as George Bush was attending the Olympics in China. Russian actions put exclamation points on the obvious – it can take out the BTC pipeline any time it wants, and is resentful of American military meddling in its backyard.

The prior secret agreements between Putin and Bush to fight the mutual “terrorists” foes appear to be in the distant past. Recent activities involving Russian natural gas transports through Ukraine underscore the vulnerability of Europe’s energy supplies. Europe currently imports some 40% of its natural gas from Russia, and this amount is bound to increase in the future. This further complicates the puzzle by placing US actions at odds with supposed allies in Europe.

With respect to Iran, the US has military forces in Iraq, Afghanistan, Uzbekistan, Kyrgyzstan and elsewhere in the region – completely surrounding Iran. The US has further tried to isolate Iran (to the dismay of the Europeans who vitally need Iranian energy) by imposing economic sanctions on the country. Iran was one of three countries with distinguished membership in George Bush’s “Axis of Evil”. These US actions have left the Iranians no choice but to develop nuclear weapons in order to protect themselves against the same kind of American aggression they have witnessed elsewhere in the region.

Meantime, flawed US/Israeli policy, combined with Israel’s recent activities in the Gaza strip and the powerful Jewish lobbying efforts in the US for military action in Iran, seem to increase the odds for more conflict in the region.

Have US foreign policy moves in Central Asia been successful? Yes and no.

One bright spot is Iraq. Iraq was always the priority in “the war on terror”, not because the terrorists were there (they are now…) but because Iraq holds the world’s second largest oil reserves after Saudi Arabia. Many of Iraq’s oil fields also have the important advantages of being sweet crude (high quality), are shallow, and are under pressure, making Iraqi production costs very low – in the neighborhood of $10/barrel. For those who actually believe the US government’s marketing job of WMDs, “freedom”, etc. as a pretext for invading Iraq, please note the recent announced that Iraq’s oil resources are now “open for business” and up for bidding. Western oil companies such as BP, ExxonMobil, Chevron, and Royal Dutch Shell (RDS.A) stand to benefit handsomely in Iraq while at the same time boosting the country’s oil production by some 2-3 million barrels over the new few year. So, Iraq can be considered a US success story assuming security is maintained and the oil can reach the market. A big if, but time will tell.

The BTC can also be considered a success. It has operated fairly reliably, and has shown to be a fairly secure source of Caspian Sea oil. This was a huge project, and many people in the oil business doubted its success and completion. But it’s up and running today and survived Russia’s recent invasion of Georgia. That said, the BTC’s continued success is extremely dependent on maintaining security in the area.

Now it’s time to head to Afghanistan and take care of business over there. Boy-oh-boy is that going to be one tough nut to crack. The Afghan/Pakistani issue is so deep I can’t even begin to cover it in enough detail to do the subject justice. Those who believe the US motives in Afghanistan are simply “terrorism” or “freedom” should take note that the US fully supported and funded the Taliban when it was decided they were the best option with respect to getting the Central Asian pipeline built. Unocal sponsored the Taliban on trips to Houston to stay at 5-star hotels and visits to NASA. It was only later when the Taliban wouldn’t “play ball” that the US stopped their support and labeled the Taliban terrorists. Even the US installed Afghani President Hamid Karzai worked as an advisor and consultant to Unocal during the initial Central Asian pipeline feasibility studies.

So, US policies have had some successes in the region as far as oil is concerned. From a humanitarian aspect, well, I’ll leave that up to the reader to figure out on his or her own. From an economic standpoint, one would have to make a detailed analysis of military spending versus the economic benefits in order to come to any conclusions. Perhaps I will write an article on this some day, but for now, I’ll sidestep that question as well.

For the US, I am not such an idealist to think for one minute the symbiotic “Pentagon-Petroleum” relationship will change anytime soon. Further, as a realist, I also understand how important the game being played in Central Asia is. I am aware of the actions the US and other world powers are taking in Central Asia in order to acquire the energy reserves they need to power their economies. My eyes are wide open.

What I continue to struggle with is why the US directs so many resources and dollars toward these overseas strategies while at the same time almost completely ignoring what steps could be taken to reduce our foreign oil requirements by adopting some fairly simple and obvious policy changes. It, quite simply baffles me. Even a cock-sure trader hedges his bets now and again. The most amateur investor knows some diversification is prudent. So, why does the US continue oil centric policies which are certain to lead to more conflict, more debt, more trade deficits, and a weaker economy and currency?

Most readers are very familiar with my proposed energy policy, but I will add the link yet again in the hopes that someday, someone out there with a bit of power and influence will read it and make it happen.

So what does all this have to do with investing you ask? In a word: everything. Where can US investors put their money these days? Financials? Consumer cyclicals? Auto makers? I think not. Despite current low oil prices, the recent strength in the US dollar, and the subject matter of this article, I continue to believe the best opportunity for US investors is to participate in energy companies and to buy gold. Now, I know that some of you who read my articles earlier in the year and went out and bought my recommended stocks got a hurt, and hurt bad, right along with me and everyone else. I’m truly sorry, and feel bad if my advice caused you any pain (at least realize I felt the pain as well!). That said, let’s look at the 2008 returns for some of my picks:

  • British Petroleum (BP): -36.1%
  • Chevron (CVX): -20.7%
  • ConocoPhillips (COP): -41.3%
  • ExxonMobil (XOM): -14.8%
  • Schlumberger (SLB): -57%

Not awfully bad, considering these returns (from this weekend’s WSJ) do not include the nice dividends some of these companies’ payout and the S&P500 was down 38.5% in 2008, its worst year since 1931. At the same time gold held up rather well, gaining 7% in the course of the year.

The bad news was some of my theme picks didn’t do well at all. Energy services, which at one point in 2008 were my “number one investment pick”, simply got hammered. Likewise, my advice to get into strategic metals via Vanguard Precious Metals (VGPMX) was a disaster as the stocks in this fund were sold off big time during the great leverage unwinding.

Making matters worse was the huge distribution VGPMX made at the end of the year which just infuriated me. I actually called Vanguard and asked them how a fund which lost over 60% for the year could possibly justify making a year end taxable distribution that equaled roughly 12% of the fund’s entire NAV?! I mean, if you sold enough to make such huge gains, why the hell is the fund down 60%? If you didn’t sell, and watched the stocks go down, why not sell the losers so that the losers and gainers cancel each other out so that no taxable distribution takes place? I was told I simply “didn’t understand”. They were right, I don’t! Seems to me even a moron could manage a fund better than that. The loss in the fund’s NAV I can understand. The huge year end distribution is simply inexcusable.

What I learned during the year is this: if a person wants to invest in precious metals, buy gold, take personal delivery of it, and bury it in the backyard and forget about it. Sure, people flock to the US dollar in times of crisis, but did anyone see the action in US treasuries last Thursday and Friday, as well as the headline in Barron’s this weekend? The financial mismanagement by the US government, Treasury, and Federal Reserve combined with the lack of a strategic long-term comprehensive energy policy must lead to a long-term weakening of the US currency. So, buy oil, buy gold. When inflation comes back, it will come back very quickly and these hard assets will once again take off like a rocket. I mean, how can the economy not re-inflate with the Federal Reserve printing US dollars as fast as the presses will print them?

My picks for 2009 are as follows: XOM, BP, CVX, COP, SLB and gold bullion, in particular American Eagles and Canadian Maple Leafs.

Goodbye 2008! Indeed, very soon we will be saying goodbye to George W. Bush as well. Let’s all hope that 2009 will be better than 2008. It won’t take much! Let’s also hope that the new administration hedges its foreign policies bets with a bet on the American people and what we can do at home by enacting a strategic long-term comprehensive energy policy. In the meantime, buy Kleveman’s book The New Great Game, enjoy, and learn. The last paragraph of the book sums up my feelings perfectly.

========================================

Get The Book: The New Great Game – by: Lutz Kleveman

========================================

Gold Due for a Pullback; Silver Approaching Resistance- Seeking Alpha

By: Jeff Pierce of Zen Trader

I like gold here as an investment going forward- I just liked it a whole lot better a few weeks ago. I think we at the top of this wedge formation and due for a pullback and the RSI could come back to the previous high around 50. That would be very constructive and bullish allowing this metal to bust through 900 on its next run. While I don’t have a specific price target for where I think it will correct to, the 20-day moving average seems like a reasonable guess.

Obviously if tensions heat up in the Middle East this could fuel another rise in gold and all bets are off. However I’ve learned in the past not to underestimate gold’s ability to correct quickly so I took my profits on Friday and will enter on a pullback. I wanted to be flat going into next week as anything can happen when all the fund managers get back from vacation.

gold

Silver has been up 6 straight days and is fast approaching resistance. I would rather it pause here and gather some strength to possibly break through the 11.75 area instead of shooting straight up using up all it’s firepower. Use any further strength to unload positions and wait for a pullback to add or establish new positions.

slv

=============================================

Profiting From Bernanke’s Super-Fed and Obama’s Newer Deal – Seeking Alpha

By: Naufal Sanaullah of The Gotham Fund and Dorm Room Derivatives

The historic wealth destruction of 2008 was obviously deflationary. Defaults strip away wealth. Institutions respond by selling assets to raise capital. Widespread deleveraging leads to supply expansion in assets and contraction in money and credit (i.e. deflation).

Nevertheless, the response has been unprecedented in its own merit. Government debt held by the public was $5.51 trillion when September began; by the end of 2008, it had risen to $6.37 trillion. The more than $1 trillion expansion in Treasury borrowing surely partially serves to offset the $438 billion budget deficit. But what about the additional half a trillion dollars?

On September 17, the Treasury announced the creation of the the “Supplementary Financing Account” in the Federal Reserve. This is a capital reserve in Fed financed by the Treasury selling new debt and it greatly expands the Federal Reserve’s balance sheet, albeit stealthily. The excess capital is trapped in this Fed account and does not reach currency in circulation. As of January 2, $259 billion is in this Treasury-financed cash pool and counting the Treasury’s “General Account” with the Fed, there is a total of $365 billion sitting at the Fed. The capital itself is money borrowed by the public, so its immediate net effect is deflationary.

On top of that, the Fed in an unprecedented gesture has started incentivizing excess bank reserve deposits by issuing interest on these holdings. Rather than being lent out, liquidity provided to banks by the Fed is thus trapped as it earns interest deposited at the Fed. The Fed is essentially issuing debt, and banks are engaging in what amounts to be a dollar-based Fed vs. interbank carry trade. Banks borrow money from the Fed, deposit them back into the Fed (use borrowed dollars to purchase Fed debt), and profit from the differential between the fed funds and overnight rates (profit off of the difference between the interest rates offered by Federal Reserve and other banks).

Less than $40 billion a year ago, the excess reserve deposits held by the Federal Reserve has ballooned to $860 billion. The banks can also deposit printed money into a Fed category called “Deposits with Federal Reserve Banks, other than reserve balances,” which is what the Supplementary Financing and General Accounts also fall under.

The “Other” subsection of these deposit accounts, which can be construed to represent bank deposits, has increased from $281 million in September to $15 billion today. Both the reserve and non-reserve deposits comprise another huge pool of excess liquidity on the Fed’s balance sheet that doesn’t immediately affect circulated currency.

Another Fed-induced cash trap has been in the form of increased reverse repurchase agreements, which are up to $88 billion. Reverse repurchase agreements are the offering of collateral in exchange for a cash loan. The Fed has utilized reverse repurchase agreements in its liquification of banks. It buys off toxic defaulting assets in exchange for cash and immediately reclaims the cash by selling the banks T-bills. The Fed printed money to pay for these T-bills, so there is excess liquidity that is trapped in time-sensitive debt. But why would the Fed be taking liquidity away from the system?

The Fed’s balance sheet suggests it has been cranking the printing presses like mad. Fed liabilities have expanded to $2.26 trillion, up over 140% since September. However, currency in circulation is up only 7% in that same time period. Where is this “trapped” $1.37 trillion? The answer is the Fed has confined it into temporary cash pools, whether in the Supplementary Financing Account or excess reserve deposits or in time-sensitive T-bills. The Federal Reserve seems to be sequestering all of this cash to buy time for the Treasury to finish its funding activities. What is scary is this wave of future bailout funding is probably not even close to what will be needed for Obama’s infrastructure and stimulus spending, which will be comparable only to FDR’s and will be liquidity injected directly into the economy.

But who is going to keep funding this expansion Treasury debt issuance? The American public is broke and cannot offer its capital in return for terrible yields. Foreign nations don’t have the means or will to continue financing our debt. Commodity prices have collapsed, cutting deeply into foreigners’ export revenues. Oil is down from highs around $150/barrel this past summer to around $40/barrel now.

According to the CIA World Factbook, China has a $6 billion budget surplus. However, it announced a $585 billion economic stimulus package in early November to be invested by the end of 2010. The Chinese government agreed to provide only $170 billion of the the funds, in an effort to prevent an unreconcilable deficit. How will China raise the other $415 billion for continuous use until the end of 2010? Surely, local governments and private banks and businesses can’t finance such a large package in the midst of a historic recession.

The only reserve China can tap into to finance its stimulus package is its $1.9 trillion foreign exchange reserves, $585 billion of which is in US Treasury securities. Also, according to the Guangzhou Daily, in mid November, the People’s Bank of China began an effort to increase its gold reserves from 600 tons to 4500 tons to diversify risk held by its huge dollar debt reserves. Financing its stimulus package and gold purchases would require selling Treasury securities, but becoming a net seller of US debt could have disastrous economic, political, and even militaristic consequences for China, so it will be interesting to see how events unfold. What seems for certain, however, is that China can no longer purchase more American debt to finance the US Treasury (and consequently the Fed).

This is a problem echoed by the rest of the big creditor nations. After China, the biggest holders of American debt securities are Japan, the UK, Caribbean banking centers, and OPEC nations. Japan is facing enormous headwinds as its quality-focused exports are suffering massive demand destruction as its consumers abroad lose wealth at epic proportions in the economic crisis. Japan was a net seller of US Treasuries in 2008 and with the current wealth destruction, it is highly unlikely it will switch to a net buyer of American debt. The British demand for American debt represented Middle Eastern oil-financed investment, but with oil prices collapsing, it will be next to impossible for this proxy demand from the UK to rise and finance additional debt.

The demand for US debt by Caribbean banking centers is because of their tax laws and because of the dollar’s status as the international reserve currency. As the credit crunch leads to liquidity destruction in Caribbean banks and the dollar slowly loses its reserve status, these tax haven banking centers will no longer be able to buy additional US debt. OPEC nations’ US debt demand, similar to the UK’s, is tied to Middle Eastern oil revenues financing American consumption (of their oil exports). As oil prices tank, as will OPEC nations’ economies and they too will have no wealth to buy up more American debt.

Bernie Madoff is well-recognized as the biggest Ponzi scheme in history, at $50 billion. I beg to differ with that claim. The United States has financed debt with debt since the late 80s, when its external debt/GDP broke the 0 mark. Since then, it has risen to over 100% of its GDP (which in itself is quite artificially inflated because of manipulated hedonics-adjusted inflation figures), and now stands at $13 trillion. That is what’s called a debt bubble. Bernie who?

But the debt bubble appears ready to collapse. The literal pyramid scheme is finally running out of investors, and many Treasury ETFs (like SHY, TLT, IEF, and IEI) are showing classic parabolic topping patterns and the next few weeks should confirm or deny my suspicions. Interest rates are at an obvious floor at zero, so there is nowhere to go but up. That means bond prices have nowhere to go but down, and the way bubbles burst, the falling prices will cascade into more selling until the debt bubble deflates and all the spending is financed by quantitative easing. The minute the Treasury finishes its current funding activity, the debt bubble will begin its collapse. Judging by gold backwardation (discussed later) and the bearish charts on the bubbly debt ETFs, I think the debt monetization and dollar devaluation will begin within the next six weeks.

With an insolvent public and no foreign demand for Treasuries, the Federal Reserve will monetize debt to finance its continued bailouts and economic stimulus. This is purely created capital pumped right into the system. This is not anything new for the Fed– for the past two decades, it has kept interest rates artificially low and created massive artificial wealth in the form of malinvestment and debt-financing. In the past, the Fed has been able to funnel the inflationary effects of its expansionary monetary policy into equity values with its low rates, which discourage saving, causing bubble after bubble, in the form of techs, real estate, and commodities. The excess liquidity (the artificial capital lent and spent because of low interest rates and debt financing) was soaked up by the stock market, which gave the appearance of economic growth and production. With inflation being funneled into equity and real estate over the last two decades, illusionary wealth was created and the public remained oblivious to the inflationary risk and the much lower real returns than nominal.

Now that the “artificial wealth bubble” being inflated for the past two decades is finally collapsing, one of two scenarios can occur: capital destruction or purchasing power destruction. Capital destruction occurs when the monetary supply decreases as individuals and institutions sell assets to pay off debts and defaults and savings starts growing at the expense of consumption. This is deflation and the public immediately sees and feels its effect, as checking accounts, equity funds, and wages start declining. Deflation serves no benefit to the Federal Reserve, as declining prices spur positive-feedback panic selling and bank runs, and debt repayments in nominal terms under deflation cause real losses.

Purchasing power destruction is much more desirable by the Fed. Its effects are “hidden” to a certain extent, as the public doesn’t see any nominal losses and only feels wealth destruction in unmanageable price inflation. It breeds perceptions of illusionary strength rather than deflation’s exaggerated weakness. The typical taxpayer will panic when his or her mutual fund goes down 20% but will probably not react to an expansion of monetary supply unless it reaches 1970s price inflationary levels. In addition, the government can pay back its public debt with devalued nominal dollars, which transfers wealth from the taxpayers to the government to pay its debt. Inflation is essentially a regressive consumption tax, which the government wants and the Fed attempts to “hide”. Not only is the Treasury’s debt burden reduced, but the government’s tax revenues inherently increase.

The Fed, in an effort to minimize inflationary perception, has for the last two decades supported naked COMEX gold shorts to keep gold prices artificially low. The Fed, as well as European central banks, unconditionally supported these naked shorts to deflate prices and stave off inflationary perception, as gold prices stay artificially low. This caused gold shorts to be “guaranteed” eventual profit, by Western central banks offering huge artificial supply whenever necessary, causing long positions in gold to be wiped out by margin calls and losses.

Now that the economy is contracting, the Fed won’t be able to funnel the excess liquidity into equities or other similar assets. It also can’t allow the excess liquidity of today, which is different in both its size (already $1.37 trillion) and nature (it is printed “counterfeit” money and not malinvested leveraged and debt-financed capital), to be directly injected into the economy. That would prove to be immediately very inflationary, as more than three times the money is chasing the same amount of goods, technically leading to 300% price inflation. These figures are strictly based on monetization of the Fed’s current liabilities, not including any future deficit spending (which is sure to dramatically increase, especially with Barack Obama’s policies), the American external debt, or unfunded social programs that need payment as Baby Boomers retire.

In order to funnel the excess liquidity into a less harmful asset, the Fed appears to be abandoning its support for gold naked shorts, causing shorts to suffer their own margin calls and cause rapid price expansion in gold. On December 2, for the first time in history, gold reached backwardation. Gold is not an asset that is consumed but rather it is stored, so it is traditionally in what is called a contango market. Contango means the price for future delivery is higher than the spot price (which is for immediate settlement). This is sensible because gold has a carrying cost, in the form of storage, insurance, and financing, which is reflected in the time premium for its futures. Backwardation is the opposite of contango, representing a situation in which the spot price is higher than the price for future delivery.

On December 2, COMEX spot prices for gold were 1.99% higher than December gold futures, which are for December 31 delivery. This is highly unusual and it provides strong evidence to the theory that the Fed is abandoning its support for gold shorts. Backwardation represents a perceived lack of supply (in this case, the artificial supply the Fed would always issue at strategic times no longer existed), causing investors to pay a premium for guaranteed delivery. On May 21, when crude oil futures reached contango, I started waiting patiently for the charts to offer a short sell trigger because the contango represented a supply glut relative to perception and current pricing. Oil was priced at $133/barrel at that time and six weeks later, on July 11, oil topped at $147, and six days later crude broke its 50DMA on volume and triggered a large bearish position against commodities that resulted in some of my most profitable trades last year.

I consider gold’s backwardation as a similar leading indicator to the opposite effect—a dramatic increase in prices. Crude began its most recent backwardation in August 2007 at around $75/barrel and increased dramatically over the next nine months to $133/barrel at contango levels. Backwardation, especially in the case of gold prices, reflects a lack of supply at current prices and is very bullish.

But why would the Fed abandon its support for naked COMEX shorts? What makes gold such a desirable asset to attempt to direct excess liquidity into? The unique nature of gold and precious metals provides its desirability in this Fed operation. Gold has little utility outside of store of value, unlike most commodities (like oil, which is consumed as quickly as it’s extracted and refined), so its supply/demand schedule has unusual traits. Most commodities and assets go down in price as the public loses capital, because the public has less to consume with and that is reflected in demand destruction that leads to price deflation. Gold is not directly consumed and its industrial use and consumer demand (jewelry) is at a lower ratio to its financial/investment demand than almost any other asset in the world.

As a result, gold is relatively “recession-proof,” as evidenced by its relative strength in 2008. Gold prices rose 1.7% last year, which is quite spectacular considering equity values went down 39.3%, real estate values went down 21.8%, and commodity prices went down 45.0% in the same period (as determined by the S&P 500, Case-Shiller Composite, and S&P Goldman Sachs Commodity Indices, respectively). Because gold is not easily influenced by consumer spending, highly inflationary gold prices don’t do any direct damage to the public and are a good way to funnel excess liquidity without economic destruction.

Federal Reserve Chairman Ben Bernanke is a staunch proponent of dollar devaluation against gold and is very supportive of President Franklin D. Roosevelt’s decision to do so in 1934. In the past, manipulating gold prices to artificially low levels was beneficial because it prevented capital flight into a non-productive asset like gold and kept production, investment, and consumption high (even if it were malinvestment and unfunded consumption).

Bernanke’s continued active support of gold price suppression would lead to widespread deflation that would collapse equity values and cause pervasive insolvencies and bankruptcies. Insolvency in insurers removes all emergency “backups” to irresponsible lending and spending, which would surely ruin the economy. Bernanke’s plan seems to be to devalue the dollar against gold with huge monetary expansion, causing equity values to rise and economic stabilization. I’ve heard estimates of 7500 and 8000 in the Dow Jones Industrial Average as being minimum support levels that would cause insurers and banks to realize massive losses, causing widespread insolvencies in them and other weak sectors like commercial real estate that would irreversibly collapse the economy.

This gold price expansion, set off by the massive short squeeze, will continue until gold prices reflect gold supply and Federal Reserve liabilities in circulation. The “intrinsic” value of gold today (called the Shadow Gold Price), calculated dividing total Fed liabilities by official gold holdings, is about $9600/oz, compared to around $865/oz today. This gold price calculation essentially assumes dollar-gold convertibility, as is mandated by the US Constitution and was utilized at various periods of American history. The near-term price expansion in gold, mainly led by abandonment of gold shorts and the first traces of inflationary risk, should show $2000/oz by the end of this year. As the leveraged deals from the pre-crash credit craze mature, with the majority of them maturing in 2011-2014, there will be more monetary expansion for debt repayment, which will structurally weaken the US Dollar (which is inherently bullish for gold) and will also provide new excess liquidity to be funneled into precious metals. This leads me to believe gold will be worth $10,000/oz by 2012.

The US Dollar’s strength as the equity and commodity markets collapsed was due to deleveraging and an effect of the Fed’s temporary sequestration of dollars, taking dollars out of supply. That is over. Oil seems to be putting in a bottom on strong volume, no one is left to buy any more negative real yield securities the Treasury is issuing, and gold has started looking very bullish.

But a good speculator always considers all situations. Even if deflation is to occur, which I see as next to impossible, gold prices should still rise to $1500/oz levels next year, because it has shown relative strength as one of the most viable assets left to invest in. In addition, the short squeeze occurring in gold will provide substantial technical price expansion, even in the absence of dollar devaluation. Because of this, I suggest gold as an investment cornerstone for the foreseeable future.

I see the market breaking down from these levels to about the November lows, starting on Monday. Commercial real estate stocks like Simon Property Group (SPG), Vornado Realty Trust (VNO), and Boston Property Group (BXP) should lead the down move, as well as insurers like Allstate (ALL), Prudential (PRU), and Hartford (HIG), banks like Goldman Sachs (GS) and Morgan Stanley (MS), and retailers like Sears Holdings (SHLD). I recommend short positions (including leveraged bearish ETFs like SRS and FAZ) and buying puts against these stocks for the very near term. If the market indeed breaks down but shows bouncing/strength around 7500-8000 in the Dow Jones, that would confirm to me that the Fed is able and willing to inflate its way out of this crisis and I will sell my bearish positions and buy into bullish gold positions.

Because in inflation the dollar is devalued, I am a proponent of owning bullion and avoiding gold ETFs, but I do believe gold and gold miner stocks will provide great returns over the next few years. Royal Gold (RGLD), Iamgold (IAG), Jaguar Mining (JAG), Anglogold Ashanti (AU), Newmont Mining (NEM), Randgold (GOLD), Goldcorp (GG), and Barricks (ABX) are among my favorite gold equities at this early stage in the process. Their charts are all quite bullish and look to see much more upside. I believe gold will pullback for a few weeks as the market continues lower and deleveraging occurs, but like I said, I don’t believe the Fed will allow the markets to breach its November lows. If indeed deflation wins out and the Fed can’t prevent equity value collapse, I will just hold on to my aforementioned bearish positions and trade in particularly those securities for the foreseeable future, and I suggest you to do the same.

Literally the only thing that I find suspicious in all of this is the fact that I see so many inflationists out there and I even see commercials on TV about precious metals. I usually like to stay contrarian to the public, which I consider irrational and wholly incompetent. But this enormous debt and monetary expansion is a structural problem that common sense may provide better insight for than the most complex of models and theories.

I leave you with this, a quote from Fed Chairman Ben Bernanke about President Franklin D. Roosevelt’s 1934 Gold Reserve Act, which was the greatest theft of wealth I’ve aware of in American history:

“The finding that leaving the gold standard was the key to recovery from the Great Depression was certainly confirmed by the U.S. experience. One of the first actions of President Roosevelt was to eliminate the constraint on U.S. monetary policy created by the gold standard, first by allowing the dollar to float and then by resetting its value at a significantly lower level … With the gold standard constraint removed and the banking system stabilized, the money supply and the price level began to rise. Between Roosevelt’s coming to power in 1933 and the recession of 1937-38, the economy grew strongly.”

My predictions: gold at $2000/oz by the end of the year and $10,000/oz by 2012 and silver at $30/oz by the end of the year and $130/oz by 2012.

Disclosure: Long SRS, SRS calls, TBT, TBT calls, gold bullion.

===============================================

Please Feel Free To Comment on any of these articles! – jschulmansr

Dare Something Worthy Today Too!

Share this:

  • Reddit
  • Facebook
  • LinkedIn
  • More
  • Twitter
  • Pinterest
  • Tumblr
  • Print
  • Email

Like this:

Like Loading...

A Golden Opportunity For 2009

31 Wednesday Dec 2008

Posted by jschulmansr in Bollinger Bands, capitalism, commodities, Copper, Currency and Currencies, deflation, Finance, Fundamental Analysis, gold, hard assets, How To Invest, How To Make Money, inflation, Investing, investments, Latest News, Make Money Investing, Markets, mining stocks, Moving Averages, oil, precious metals, silver, small caps, Stocks, Technical Analysis, Today, U.S. Dollar

≈ Comments Off on A Golden Opportunity For 2009

Tags

agricultural commodities, alternate energy, Austrian school, banking crisis, banks, bear market, Bollinger Bands, bull market, capitalism, central banks, China, Comex, commodities, communism, Copper, Currencies, currency, deflation, depression, diamonds, dollar denominated, dollar denominated investments, economic, economic trends, economy, financial, Forex, futures, futures markets, gold, gold miners, hard assets, heating oil, India, inflation, investments, Keith Fitz-Gerald, market crash, Markets, mining companies, Moving Averages, natural gas, oil, palladium, Peter Schiff, physical gold, platinum, platinum miners, precious metals, price, price manipulation, prices, producers, production, protection, rare earth metals, recession, risk, run on banks, safety, Saudi Arabia, Sean Rakhimov, silver, silver miners, socialism, sovereign, spot, spot price, stagflation, Technical Analysis, timber, U.S. Dollar, volatility, warrants, Water

2008 What a Year! So what does 2009 have in store? In today’s post we explore a “Golden Opportunity” Imagine re couping your 2008 losses and more! Everything is lining up in place for our “Golden Opportunity”, read on and find out how you can benefit in 2009- jschulmansr

Portfolio Advice for 2009: Stick to Gold, Stay Away From Stocks- Seeking Alpha

Source: Sovereign Society- Eric Roseman

Records were broken in 2008 – money-losing records from an investor’s perspective.

U.S. stocks will record their worst calendar year since 1931. As measured by the S&P 500 Index, the broader market tanked 40% this year while the Dow Jones Industrials fell 36%.

U.S. stocks are already “dead money” since 1996. They’ve shown no net gain at all – including dividends. The ongoing market environment is eerily similar to another period of dismal returns – from 1966 to 1982. During those 16 years, the Dow and S&P 500 Index posted zero profits. Adjusted for soaring inflation, the markets actually recorded a loss.

Global equities as measured by the MSCI World Index posted its worst year since inception in 1969. International equities fared even worse with European and Japanese stocks down more than 45% and the MSCI Emerging Markets Index clobbered – down 53% in 2008.

World Markets Got Trashed in 2008

Gold Stocks and Oil Chart

For stocks, the ongoing bear market has resulted in record mutual fund outflows as investors continue to dump their holdings and run for cover into money market funds.

Unfortunately, money market funds are now paying barely any yield at all since the Fed slashed interest rates to effectively 0% on December 16.

Only Treasury bonds, European and Japanese government bonds yielded a profit for investors in a wickedly harsh year for investors. As a currency investor, naturally you already know that the Japanese yen was also a winner against the dollar and euro as the “carry-trade” came to a crushing halt.

So Much for “Diversification”

With the exception of super-safe and low yielding U.S. Treasury bonds, yen and gold, the entire gamut of assets from stocks to non-Treasury bonds all plummeted in 2008.

Commodities, certain currencies, fine art and hedge funds all succumbed to brutal price declines. Overall, 2008 was the first losing year for U.S. and global stocks since 2002 and the worst period to be invested in financial and hard assets in more than 75 years.

Stop-losses rang out like pinball machines in 2008. Diversification across sectors, industries, countries and currencies proved futile. Almost everything was pummeled. By October 10, a panic gripped world markets as the threat of systemic collapse threatened the viability of the banking system.

Chaos to the Rescue

In late 2007, I introduced the TSI Chaos Portfolio to my Sovereign Society readers. It’s a U.S.-based portfolio of six equally-weighted investments, including short-term Treasury bonds, gold, Japanese yen and reverse-index funds that bet against the S&P 500 Index. Recently I added a seventh safe-haven – short-term German government bonds.

This cost-effective strategy dominated my recommendations in 2008 rising more than 17%, including dividends.

For growth investors, hedging your market exposure is vital in a secular bear market. I continue to like the TSI Chaos Portfolio in 2009 even though the stock market has probably suffered the bulk of its declines at this point.

Volatility will remain rampant in an uncertain economic environment marked by growing consumer credit woes, massive government bond issuance to support gargantuan fiscal spending plans and weak corporate earnings. Investors must hold downside market protection.

Short Most Commodities, But Stock Up on Gold/Silver

Starting in October 2007, I recommended my Commodity Trend Alert (CTA) subscribers begin to bet against oil and gas stocks as a way to hedge against the energy sector. At the time, oil prices were racing to US$100 a barrel and the oil stocks were in the midst of a multi-year bull market. We all know how that story fared in 2008.

Since peaking in July, the benchmark CRB Index has crashed more than 50% as the entire commodities complex continues to aggressively deflate in a rapidly slowing global economy.

To protect our natural resource exposure in CTA, I immediately issued a series of reverse-index purchases betting against commodities. We were most successful betting against industrial metals or base metals, as copper and other metals collapsed. That position, still open, has gained a cumulative 80% since August 2008.

And since September, CTA has been riding a broad commodity index to the basement as part of our reverse index strategy – up more than 60%. We also maintain hedges against gold, oil, gas and long-term Treasury bonds.

Gold has also been a strong performer compared to most other assets in 2008. Significantly, gold is the only asset that is completely outside the credit system and the only asset that has no liability.

In 2008, spot gold prices gained a modest 1% – not much in absolute terms but certainly impressive compared to other plunging assets. Silver, more of an industrial metal and therefore more vulnerable to broad economic trends, declined 18%.

Looking ahead to 2009, growth investors will only reluctantly return to stocks. Losses have been massive for investors since late 2007 as mutual fund redemptions hit records.

Stocks might indeed offer better values compared to mid-2007 after plummeting more than 40% from their highs. But domestic consumption in the United States, Japan and Europe is depressed and likely to remain under threat as unemployment rises and savings rates begin to rise again.

The correlation between a higher savings rate and corporate earnings is negative. It’s difficult to be bullish on earnings when the world’s largest economy will remain mired in a period of sluggish growth, debt retrenchment and rising job losses. The same is true for Japan and Germany – the second and third largest economies, respectively.

This is not the time to be aggressively buying stocks. Odds are prices will get cheaper again following any bear market rally. That’s certainly been the case every time stocks have rallied off their lows since October 2007.

Instead, make sure your portfolio includes gold, portfolio hedging strategies and income from high quality investment-grade corporate bonds in 2009.

==================================================

Predictions For 2009: Who Will Be the Winners and Losers? – Seeking Alpha

Source: Tony Daitorio of Oxbury Publishing

Visit: Investing Answers

Visit: Bourbon and Bayonets

The year 2008 is coming to a close. Good riddance! 2008 will be remembered as the year that the chickens came home to roost for America’s brand of “elitist capitalism” and will long be remembered as the year where the greed of so few penalized so many.

In 2008, the vast majority of pension plans and retirement accounts incurred losses of one quarter to one half of their value because of the greed of Wall Street. To me what is most sad is that Wall Street’s greed not only devastated the savings of a generation of Americans but has also shackled future generations of Americans with the bondage of enormous amounts of debt.

Echoes of History

Human greed and financial bubbles are, of course, nothing new. History has many examples of manias and bubbles such as the South Sea Bubble. To me, most striking is the parallel between today’s hedge funds and the investment trusts of the 1920s.

Investment trusts used leverage as do hedge funds. Investment trusts were able to get away with revealing little about their portfolios because the equity bubble of the 1920s conferred an aura of omniscience on their managers. Sound familiar? Their managers, by the way, were also very highly compensated.

Reputations inflated in the bubble of the 1920s promptly evaporated in the 1929 crash and the 1930s bear market. The 1930s bear market also exposed numerous outright swindles by Wall Street. Some of the swindles were all too reminiscent of Bernie Mad(e)off and his Ponzi scheme. I believe that, as in the 1930s, many lofty Wall Street reputations will be washed away.

Recently, the Financial Times had an interesting article about 19th century Victorian England and its literature. Financial crises were part of everyday life at that time, which greatly affected their literature. The article spoke of authors such as Charles Dickens, Anthony Trollope, Elizabeth Gaskell, and William Makepeace Thackeray.

A character in Charles Dickens’ Little Dorrit – Mr. Merdle – whose schemes initially offered his investors huge returns before wiping them out definitely reminds me of Bernie Merdle, I mean Madoff. The literature of those times definitely echoes in our times.

A Penny for My Thoughts?

Obviously, at the end of last year no one predicted the dire straits that we would face in 2008. This just reinforces in my mind one thought. Why does anyone still watch CNBC and listen to what any of those shills has to say? The only person on CNBC that has some brains is my paisano – Rick Santelli. The rest of the people on CNBC are absolutely worthless.

Since at the start of a new year everyone seems to like to make predictions, I thought I would throw my two cents out there for readers to ponder. Please contact Oxbury Publishing for your comments on my predictions or feel free to make your own predictions about the upcoming new year.

The Biggest Loser(s)

Picking the biggest losers for 2009 is relatively easy. You simply find the assets that have the most fat. I believe that in 2009 we will actually have two biggest losers. Which asset classes?

As I said – where the fat is. The fat is where the Wall Street money managers have run to hide and cower in fear for their jobs. That is, of course, the US Treasury Market! As I stated in my previous article – the HMS Treasuries – the “pirates” of Wall Street have loaded all of their ill-gotten booty onto the ship called the HMS Treasuries. I firmly believe that this ship will follow its predecessor, the HMS Titanic, into history and sink below the waves. Remember – both ships were considered to be ultra-safe and “unsinkable”.

A close second ‘biggest loser’ will be the US dollar. The US dollar has been strong in 2008 because of the perverse reaction of Wall Street money managers. An analogy I used in previous articles was that a nuclear blast went off right in the middle of Wall Street.

Even a rudimentary knowledge of science would dictate that you get as far away as possible from the blast. Yet, Wall Street money managers ran full speed toward the nuclear blast – nobody said that Wall Street money managers were smart. Most of them sold all of their assets overseas and moved the assets into dollars.

I believe that this move will prove to be “radioactive” in 2009, as overseas investors seem to be waking up to the fact that the US will need many trillions of dollars to bail out the US economy. Overseas investors may not sell the US dollar outright, but they will not be anxious to add to their positions.

Predictions

My first prediction is that in 2009, ‘bombs’ will continue to go off up and down Wall Street. I predict that the Bernie Madoff $50 billion Ponzi scheme will be just the first of many such major swindles that will be revealed on Wall Street.

I predict that the government will be forced to inject many more trillions of dollars into the black hole laughingly called bank balance sheets, inflating our government’s deficit to levels undreamed of only a few years ago.

However, I also predict that the amount of money sunk into banks will be miniscule in comparison to the amount of money that will be created out of thin air by the Federal Reserve in 2009. This money creation will puncture the balloon of the deflationists.

In astronomy, when talking about the distance between stars, astronomers don’t measure the distance in trillions of miles. Astronomers use light-years as a convenient measure of distance. So instead of trillions of dollars, perhaps some similar measuring stick will be adopted as a measure of how fast the Federal Reserve will be create funny money.

I can hear it now – “yes, in the last light-second the Fed just created $10 trillion of funny money”. Instead of the Big Bang Theory, perhaps there will be the Fed’s Big Buck Theory. This theory will describe how out of deflationary nothingness, the Federal Reserve created a rapidly expanding inflationary economic universe.

Winners?

Will there be any winners in 2009? I guess I have to predict some winners, huh? Which asset classes?

I am looking at the asset classes most beaten down by the forced liquidations of hedge funds and other Wall Street fools.

One such asset class is corporate bonds. Corporate bonds are priced right now by the Wall Street numbskulls for conditions to become worse than the 1930s and a 25% default rate. I predict that corporate bonds will have a very good year.

Another asset that has been sold off by the Wall Street numbskulls who have bought fully into the deflation myth are TIPS or Treasury Inflation Protected Securities. When the Fed’s Big Buck Theory becomes apparent, I predict that TIPS will be a huge winner.

I also predict that most commodities will stage a decent comeback. I believe that gold will have a decent year and re-visit the $1000 per ounce level. I also believe that oil will rebound to a more fundamentally sound price of between $71 and $87 per barrel.

I also predict that the best of bad equity markets will be in the countries that actually have cash and/or assets and do not have to borrow enormous amounts of money. Sovereign debt will become two words that are not spoken in mixed company. I don’t believe it’s a wise economic policy for a nation to rely on the kindness of strangers. Examples of the “better-off” countries would be China and Brazil.

================================================

Will the New GCC Single Currency Include Gold? – Seeking Alpha

Source: Peter Cooper of Arabian Money.Net

Gulf Cooperation Council leaders yesterday concluded their 29th annual summit meeting in Muscat, Oman with a final approval for the creation of a single currency for the six-nation economic bloc, still targeted for 2010.

Saudi Arabia is the largest economy in the GCC and boasts substantial gold reserves. But whether gold will be included in the currency basket has not yet been decided.

Golden opportunity

GCC assistant secretary-general Mohammad Al Mazroui told Gulf News: ‘We first have to decide on the location of the Central Bank, then the Central Bank and Monetary Council will have to decide on the gold reserves for the Central Bank’.

The creation of the GCC single currency – likely to be known as the Khaleeji which means Gulf in Arabic – is a major gold event for two reasons.

First, the breaking of their dollar pegs by the Gulf Arab nations is clearly dollar negative. Secondly, any inclusion of gold either as a part of the monetary basket, or in the reserves of the new GCC Central Bank will create additional demand for the precious metal.

2009 deadline

The project is gathering pace, and no lesser a figure than Saudi Arabia’s King Abdullah has directed that GCC economic integration committees speed up their work and complete the whole exercise by September 2009.

It is only a couple of months since a group of Saudi businessmen allegedly bought $3.5 billion worth of gold, believed to be the largest ever single transaction for the precious metal. Perhaps in 2009 it will be gold rather than local currencies which become of interest to speculators about monetary reform in the GCC.

Gulf countries are keen to break away from the link with the US dollar because it ties them to inappropriate monetary policies that exaggerate the boom-to-bust cycle in their economies.

==================================================

Don’t Miss The Coming Gold Bull- Seeking Alpha

By: Naufai Sanaullah of Dorm Room Derivatives

With the massive monetary expansion experienced in recent months and the promise for unprecedented levels of money and credit supply increase in coming months, the United States Federal Reserve looks on paper to be sending America straight into hyperinflation. Germany’s post-World War I Weimar Republic, post-World War II Hungary, 2001 Argentina, and present day Zimbabwe are all analogous examples of massive debt monetization, which all led to hyperinflationary disaster. Never before has the entire world’s economy been linked to one nation’s, however, as is the case today with the United States.

In a case of economic mutually assured destruction, foreign creditor nations and their central banks can’t afford to spark a run on the US Dollar, because it would kill their own export-based economies, as well as devalue their debt repayments and foreign exchange reserves. But the United States has been financing consumption through debt for decades and has resorted to monetary expansion to finance its debt and deficit spending, which is only going to increase with Barack Obama’s infrastructure and social programs. The Troubled Assets Relief Program (TARP) itself amounts to $700B, all of which will essentially be “printed.” Foreign demand for US debt is all but gone, as creditor nations are now attempting to unwind their USD positions. Huge creditor nations like China and Iran were net sellers of US Treasuries in recent months, attesting to the weakening of the American debt bubble. So where’s all this excess liquidity go?

The answer is gold, and it is the only way to prevent the hyperinflationary scenarios referenced above from materializing in the United States.

The Fed has been on a money printing binge of unprecedented proportions, but has been able to thus far “trap” the excess liquidity from reaching the consumer level, which is what causes price inflation. It started a massive foreign currency sale this summer through the Exchange Stabilization Fund (ESF) that led to a supply increase of Euros and suppression of dollar usage. It has been liquifying troubled banks by issuing them T-bills financed through monetization in exchange for toxic assets by utilizing reverse repurchase agreements. And it has used the recent deleveraging and commodity collapse (partially caused by credit defaults in many of the overleveraged institutions that were supporting the commodity bull) to supply the temporary demand for US Dollars and feeding its own foreign exchange reserves.

But the excess liquidity thus far is trapped in time-sensitive and manipulated instruments now, and without a demand for American debt, it has to go somewhere. As T-bills expire and the stock market descends further, actual currency is going to be released out of sequestration into the economy. The Fed cannot allow the market to breach below its November lows, unless it wants widespread insolvency in insurers and banks, which are legally required to halt operations in the event of insolvency. I’ve heard estimates of 7500 and 8000 in the Dow as being minimum support levels that, if broken for an extended time, would lead to economic collapse in America as financials would all go under. To prevent this and to finance Obama’s deficit spending, actual dollars will have to be injected into the system and they will be.

Weakness in the dollar causes strength in gold, which is something the Fed (through America’s banks) has been suppressing for years. COMEX shorts dominate this suppression of gold prices, but this act will be discontinued to prevent economic collapse. Allowing gold’s price to rise to current fair levels (and then rise further to represent gold’s rising fundamentals) will soak up much of the excess liquidity, preventing hyperinflationary price increases in consumer goods. Gold reached backwardation this month, signifying the big gold market manipulators are abandoning their short positions.

Ben Bernanke is a proponent of dollar devaluation against gold and is a staunch advocate of Frank D. Roosevelt’s decision to do so in 1934 during the Great Depression. Dollar devaluation is one of the government’s most prized tools, as it allows debts to be paid back in devalued nominal terms, transferring risk and purchasing power destruction to American taxpayers, who have no clue what is going on. Inflation is a tax on the people and with a fiat currency, a power-limitless Fed can (and has) tax the hell out of the American people.

The dollar, and fiat currency as a whole, faces collapse now, however, as the artificial wealth created and used in the past few decades is now showing its nature as being just that– artificial. The global monetary system will have to return to some sort of precious metal backing, directly or indirectly, and surging gold prices is essential for this to occur.

Rising gold prices represents the excess liquidity being soaked up and also causes nominal equity values to rise without dramatic rises in consumer goods. Gold has little utility outside of store of value, which is why its price hasn’t collapsed at nearly the same rate other commodities, like oil and natural gas, have. As crude and steel suffered demand destruction from consumers losing wealth quickly, gold was barely touched at all and in fact probably would have shown even more strength hadn’t it been for the aforementioned manipulations of the Fed and the global deleveraging of financial institutions.

Creditor nations like China and Iran are buying as much gold as is possible without dramatically disturbing prices, and Iran has said it wants to convert the majority of its foreign exchange reserves into bullion. Gold-buying sentiment is getting stronger as the massive seigniorage of the Fed, and with gold shorts being abandoned by the Fed, the huge demand is finally going to surface into price expansion.

Technically, gold appears poised to break out of its countertrend down move in its primary bull, leading to much higher prices soon. It broke out of its 50DMA on strong volume recently and is approaching a 200DMA breakout. With backwardation occuring this month, all indicators point to gold surging in the coming months.

Gold and gold miner stocks are also looking quite bullish. I recommend Royal Gold (RGLD), which recently broke out of a great long-term base, as well as El Dorado Gold (EGO), Goldcorp (GG), Iamgold Corp (IAG), Barrick Gold (ABX), Randgold Resources (GOLD), Jaguar Mining (JAG), Anglogold Ashanti (AU), Agnico-Eagle Mines (AEM), and Newpont Mining (NEM) for the coming year. Also, look into buying the Ultrashort 30-year Treasury Bond ETF (TBT) as the US debt bubble collapses and debt monetization starts to show up in the Fed’s balance sheets. I do suggest buying lots of bullion, however, as stock market returns are in nominal dollar-denominated terms.

The American total credit market debt to GDP ratio is at unprecedented highs, well above 350%, and this with ridiculously manipulated inflation numbers artificially deflated through hedonics. The government deficit could top $2 trillion next year. And the Fed is going to print money to pay for it all. The only way to prevent hyperinflation is to return to some sold of hard asset-backed monetary system and to allow gold’s price to rise dramatically.

My prediction: gold breaks $2000/oz in 2009 and $10,000/oz by 2012.

Disclosure: Long gold bullion; no positions in stocks.

================================================

Gold Bugs Have Fed to Thank for Recent Rally

Source: Monday Morning

By Don Miller

The currency markets reaction to the Federal Reserve’s recent interest rate cuts has ignited a rally in gold, as investors weigh the benefits of owning the yellow metal versus U.S. Treasuries and the dollar.

As a result, gold has started to shine again as a stable source of value at a time when the dollar and other commodities – like oil and copper – have fallen hard. The spot price of gold has climbed above $870 an ounce on the New York Mercantile Exchange, up about 20% from its October lows.

Gold has been on roller coaster ride in 2008, moving from its all time high of $1035 in March, to as low as $681 an ounce. Some of that decline occurred during the recent stock market plunge. Many investors were forced to liquidate profitable gold positions in order to raise money to cover their paper losses.

Its decline was then accelerated by the recent onslaught of financial bailouts, as many investors held a preference for liquidity and safety in the form of cash holdings guaranteed by the U.S. government.  That was reflected in the skyrocketing prices of government bonds and investments in government-backed banks, which also lowered yields.
But with the Fed’s recent decision to cut its target interest rate to a range of 0% to 0.25%, the dollar has suffered a significant decline. Suddenly, foreign investors who were scooping up dollars have cut back on their flight to safety, knocking the dollar index (NYBOT: DX) down 10% in the last month.  The index reflects the dollar’s value against the Euro, Japanese Yen, British Pound, Canadian Dollar, Swedish Krona, and Swiss Franc.

The Fed’s interest rate cut may also have given gold a comparative boost in the eyes of investors. Gold, which never pays interest, suddenly doesn’t look so bad when compared to T-bills, which also are paying zero interest lately.

Volatility has risen this year compared to previous years, and the last few months have been the most volatile of all – an indication of investor ambivalence. But any uncertainty about the increasing price of gold may have been waylaid by the Fed’s recent rate cut and its dampening effect on the dollar and Treasuries.

Consequently, don’t expect this rally to be short-lived. As we pointed out in our 2009 Outlook Report on Gold, the fundamentals in the market hold the promise of more gains ahead.

It appears unlikely central bankers around the world will stop stimulating economies, printing money and doing whatever it takes until growth and confidence are restored – even if the cost is rampant inflation.

Consider these wild card inflation indicators that Money Morning Contributing Editor Martin Hutchinson believes will carry gold prices to $1,500 an ounce by the end of 2009:

  • Over $7 trillion of freshly minted U.S. dollars are now in circulation with the aim of saving the global financial system.
  • The incoming Obama administration has promised another $1 trillion or so stimulus package is on the way.
  • It’s likely the Fed’s interest rate cuts will soon be followed by central banks around the world.

These economic stimuli are designed to do one thing – get the consumer spending again. 

The bailout of the banks was the first step, but the banks are still keeping a tight rein on credit. Now the government is trying to get easily available, cheap money back into the hands of the consumer by running the printing presses around the clock.

“The government is pumping money in so many banks, and that money has to come out somewhere,” said Hutchinson.

Some of that money will “come out” into the economy in the form of higher stock prices. That will make consumers wealthier, and could give them more confidence in the economy. More confidence means more spending. As that happens, prices for goods should begin ticking upward, giving another booster shot to gold prices.

For instance some of that money is already going into gold bars and coins. In fact, the U.S. Mint was forced to suspend sales of the popular American Eagle and Buffalo gold coins for extended periods twice in the last year. The mint was unable to secure enough gold blanks from suppliers to match demand.  

“I’ve never seen a case where demand was so high and supply was so short,” Chicago coin dealer Harlan Berk told the Associated Press. 

With massive amounts of capital floating around, the time it takes to re-inflate the global economy will be far shorter than most analysts expect. Governments fear deflation more than anything.  It appears they will only fight inflation when they are assured they have won the first battle, which is growth at any cost.

When inflation kicks in, the dollar’s buying power will suffer long-term.  In fact, we expect a decline in all the world’s paper money, over time.  Historically, investors in gold have prospered during periods of weakening fiat currencies.

That leaves gold as a bright light in the investment world, making it an odds-on favorite to open a new leg of a long-term uptrend
. 
News and Related Story Links:

  • Fortis Metals:
    Fortis Metals Monthly – December 2008
  • Associated Press:
    Woes on Wall Street coincide with gold coin rush
  • Money Morning:
    Five Ways to Play Gold’s Rebound to $1,500 an Ounce

Share this:

  • Reddit
  • Facebook
  • LinkedIn
  • More
  • Twitter
  • Pinterest
  • Tumblr
  • Print
  • Email

Like this:

Like Loading...

Warning! Info The Central Banks and the IMF Does Not Want You To Know

30 Tuesday Dec 2008

Posted by jschulmansr in Bollinger Bands, capitalism, commodities, Copper, Currency and Currencies, deflation, Finance, Fundamental Analysis, gold, hard assets, inflation, Investing, investments, Latest News, Markets, mining stocks, oil, precious metals, silver, small caps, Stocks, Technical Analysis, Today, U.S. Dollar, Uncategorized

≈ Comments Off on Warning! Info The Central Banks and the IMF Does Not Want You To Know

Tags

agricultural commodities, alternate energy, Austrian school, banking crisis, banks, bear market, Bollinger Bands, bull market, capitalism, central banks, China, Comex, commodities, communism, Copper, Currencies, currency, deflation, depression, diamonds, dollar denominated, dollar denominated investments, economic, economic trends, economy, financial, Forex, futures, futures markets, gold, gold miners, hard assets, heating oil, India, inflation, investments, Keith Fitz-Gerald, Marc Faber, market crash, Markets, mining companies, Moving Averages, natural gas, oil, palladium, Peter Schiff, physical gold, platinum, platinum miners, precious metals, price, price manipulation, prices, producers, production, protection, rare earth metals, recession, risk, run on banks, safety, Saudi Arabia, Sean Rakhimov, silver, silver miners, socialism, sovereign, spot, spot price, stagflation, Technical Analysis, timber, U.S. Dollar, volatility, warrants, Water

Warning! Today’s post includes information the Central Banks and The IMF DO NOT Want you to Know! New Peter Schiff on Gold and more… If everyone would start taking delivery on their Gold and Silver Contracts we could create the “rumored” Short Squeeze since there s not enough physical Gold and Silver available to cover all of the Open Short Contracts; and at the same time sustain new buying. The same thing would also apply to taking delivery of Stock Certs in the Precious Metals Mining Companies. Such actions would create massive buying and become a self fulfillingprophecy unto itself. Enjoy! – jschulmansr

President of Euro Pacific Capital On Gold and the Dollar – Peter Schiff–Seeking Alpha

Source: Hard Assests Investor

Mike Norman, HardAssetsInvestor.com (Norman): Well, he’s back. Mr. Doom and Gloom is here … Peter Schiff, president of Euro Pacific Capital and author of the new book just out, “Bull Moves in Bear Markets.”

Peter Schiff, president of Euro Pacific Capital (Schiff): “The Little Book …”

Norman: “The Little Book …”; it’s in The Little Book Series. Well look … the last time you were here, things were kind of going your way, but it looks like things have turned upside down.


All kidding aside, I know your big thing over the last seven or eight years has been gold. We’re very supportive of gold on this show; we think that probably people should have some gold as part of their overall portfolio mix. But let’s just look at what happened.

Several weeks ago, the U.S. stock market had its worst week in history … even going back to the 1930s … worst week in history. I saw a breakdown of various assets – all assets really – stocks, bonds, gold, commodities, oil. Gold was at the bottom of the list. The top-performing asset, and something that you hate, was the U.S dollar.

So how do you explain that? If we are going through the worst economic and financial crisis in history – precisely what gold is supposed to protect against – why would it perform so bad?

Schiff: Well, I think it will perform very well; you got to give it a little bit more time.

Norman: More time or more decimation?

Schiff: No, what’s happening right now, Mike, is just de-leveraging, and so gold is going down for the same reason a lot of stocks are going down, a lot of commodities are going down. There’s a lot of leverage in this system, there’s a lot of margin calls, a lot of liquidation; a lot of people are having to sell whatever they own to pay off their debts.

Norman: But look at where the money is going … the money is going into U.S. sovereigns, Treasuries … it’s going into the U.S. dollar.

Schiff: For now.

Norman: Why for now?

Schiff: Right now there’s some perception of safety there, but it’s the opposite of the leveraging. If you’re selling your assets, you’re accumulating dollars; but ultimately right now, it’s like there’s been this gigantic nuclear explosion in the United States, and everybody is running toward the blast. Pretty soon they’re going to figure out they’re going in the wrong direction.

Norman: You always talk about gold as a currency, and we have seen currencies appreciate – the yen, for example, the dollar tremendously, for example, but gold has not held up.

Schiff: Well, if you actually look at gold versus other currencies, in the last couple of weeks gold has made new record highs in terms of the South African rand, the Canadian and Australian dollars … so gold was not doing as poorly as many of the currencies, and I think this is all short term.

I think you’re going to see a lot of money moving into gold, and if you look at how much gold has gone down from the peak, the peak was about a thousand … it’s off about 25%. Stocks are off 40%. Gold is still up during this year against the Dow.

Norman: Let’s see the performance from this point forward; we’ll look back at this again and we’ll revisit this issue.

Let’s talk about something else, something that you have also … and I just mentioned it … the U.S. dollar. You were very, very negative. In the last month, we have seen unprecedented actions by the U.S. Fed in terms of expansion of the monetary basis; in other words, printing money … what you call printing money … and despite that, the dollar has remained incredibly strong.

How do you explain that according to your logic?

Schiff: Everything the government is doing is inherently negative for the dollar, and all of this…

Norman: It’s not playing out that way.

Schiff: It will; you’ve got to give it time.

I remember when I was on television talking about the subprime and people were telling me it’s no big deal, and I said, just wait a while; give it time.

Look, everything that we’re doing – all the bailouts, all the stimulus packages – this is all being financed by inflation. It’s inherently terrible for the dollar.

Norman: But you just said yourself that everything is deflating.

Schiff: But right now, Mike, you’re getting this de-leveraging, and this is benefitting the dollar, so despite the horrific fundamentals for the dollar, it’s going up anyway.

But ultimately, when this phony rally runs out of steam, the dollar is going to collapse, and that’s when we’re going to have a much greater crisis because now you’re going to have a collapsing dollar, which is going to push long-term interest rates up, commodity prices up.

Norman: I still don’t understand why the dollar is going to collapse. So you’re saying that the Fed is just going to allow … or leave this enormous amount of liquidity in there, that at some point down the road, if we recover, they’re not going Scto take it out?

Schiff: Look, they have no control over it. The Fed is trying to artificially reflate our phony economy, right?

We had this economy that was based on Americans borrowing money and then spending it on products. We have this huge debt finance bubble which is collapsing, and it’s being supported by foreigners.

But when this artificial demand for Treasuries goes away, the Fed is going to try to print a lot of money and the dollar is going to get killed.

Norman: All right; I’m going to ask you to hold on. Folks, check back because we’re going to do the second part of my interview with Peter Schiff, so check back to this site. This is Mike Norman; bye for now.

=============================================

The Manipulation of Gold and Silver Prices – Seeking Alpha

By Peter De Graaf of Pdegraff.com

Here is an article you may want to forward to your favorite mining CEO.

This article deals with the blatant manipulation that has been occurring in the gold and silver markets, and offers a solution. While this scandal has been going on for many years, at last more and more people are becoming aware that it is going on.

One of the first people to document the ongoing attempts to suppress the gold price was Frank Veneroso. Next was Bill Murphy of GATA.org. GATA continues to press the issue. Gata has discovered that the IMF instructed its member banks to treat gold that had been leased to bullion banks and sold into the market as if it were still in the vault! Imagine if an entrepreneur was running his business in this underhanded manner – how long would the government allow that?

A few years ago John Embry, while he was Portfolio Manager at RBC Global Investment Fund – a multi-billion dollar resource fund at the Royal Bank – prepared a memo for the bank’s clients that detailed the manipulation in the gold market.

Ted Butler has written extensively on the manipulation in the silver market.

This is something I have observed first hand since I became interested in silver in the mid-1960’s. It seemed that every time silver reached a peak, an invisible hand came out of nowhere and knocked the price back down to the starting point again. I wrote an article about this titled: ‘Once upon a time, in Never-Never Land.’

Every time a geo-political event, or a serious economic happening, such as the collapse of Bear-Stearns, causes gold to rise, (as it would be expected to do since it has always been a ‘safe haven investment’), the price immediately gets trounced, and investors and producers accept this new price as ‘THE price,’ since the new event has now been discounted.

Whenever common sense tells you something is happening that should cause a rise in the price of gold and silver, you can count on intervention to cap the price. As a result, millions of investors and mining companies have lost billions of dollars that they would have earned if these markets had been allowed to run their normal course.

The manipulation is obvious in the following charts:

click to enlarge

This chart shows steady buying interest that took price from the low at 955.00 on July 14th to 985.00 the next day. The buying took place in Asia, then Europe, and carried over for about an hour in New York, when suddenly, in the space of minutes, an unseen entity dumped gold in the form of futures contracts (green line), without any attempt to obtain the best price possible. In about 5 minutes the gold price was down by 15.00, and the rise was over, as price drifted sideways for the rest of the day.

It was discovered later that several large banks, suspected to be HSBC (HBC) and JPMorgan Chase (JPM) and possibly one other bank, had switched from being ‘net long’ 5,381 gold contracts at the beginning of July 2008, to being ‘net short’ 87,609 gold contracts by the end of July. That is a 94,000 contract ‘turnaround’ and smacks of blatant interference in the market place, since these banks do not produce gold, nor are they likely to be hedging against that much gold in the vaults, since they do not own physical gold. Such a dramatic switch without any change in fundamentals is beyond reason.

Featured is the daily gold chart from October 13th. The blue line shows steady demand followed by consolidation early on Oct 14th, as recorded via the red line. Then a mysterious seller showed up shortly after the COMEX began trading in New York, and in the space of minutes the price was knocked down by 30.00. This is totally illogical, since the seller has no interest in obtaining the best price. His only interest is to destroy the price.

“In 1980 we neglected to control the price of gold. That was a mistake.” Paul Volcker.

“Central banks are ready to lease gold, should the price rise.” Alan Greenspan during Congressional testimony July 24/1998).

Featured is the price action right after the COMEX began trading in New York on October 16th. Within a few minutes the price was knocked down by 35.00 (green line), after the price had established a solid trading range between 830.00 and 850.00 during the previous two days (red and blue lines). This illogical dumping of gold contracts caused margin related selling to bring the price down another 15.00 before bargain hunters were able to level the price around the 800.00 mark.

These are just some of the examples of ‘irrational behavior’ on the part of several large traders on the COMEX, whose actions are not being controlled by the people who oversee the COMEX. While this article deals primarily with gold, the same manipulation exists in the silver markets. To repeat an earlier comment, ‘millions of investors (including miners), have lost billions of dollars because of the manipulation.’ The US government is able to interfere in the markets by way of the Exchange Stabilization Fund which is run by the Federal Reserve and the Treasury Department. The size of the manipulation referred to in this article could not take place without the encouragement that is very likely provided by people who are highly placed in government.

CAUSE AND EFFECT

The effect of this manipulation in the gold and silver markets is an artificial low price. In view of the fact that bullish events are not being allowed to permit prices to rise, nevertheless these events will eventually have a positive effect on the price. The cause is real, but the effect is delayed. The steam in the kettle continues to boil, despite the lid being clamped down. The artificial low price stops the development of mining projects that would have been profitable at the higher price. The artificial low price also cuts into profit margins at every producing mine, making it more difficult to obtain funding for exploration to increase resources. Every mine in the world is at all times a ‘depleting asset’ and needs exploration to postpone the day when the last ounce is mined.

THE MANIPULATORS ONLY HAVE TWO WEAPONS

The ammunition used by the manipulators is provided by two sources: Central banks (including the IMF), and the COMEX. While there is nothing anyone can do about the gold selling that originates with the central banks, there are ways to choke off the amount of precious metal that flows into the COMEX warehouses.
Those of us who are tired of the manipulators picking our pockets need to become active.
In 1978 – 1979 it was a rising silver price that caused gold to rise – silver was the leader. It makes sense therefore to concentrate on silver, especially since the central banks do not have hoards of silver.

A SOLUTION!

Mining companies that supply silver to the COMEX need to find a way to turn their silver into small bars (1 oz to 100 oz), and 1 oz rounds and sell these to the public. Already some mines are doing this by selling from their website, and they are obtaining a hefty premium over the spot price. If your production is limited, join forces with a mine that is already merchandising silver products, or form a sales organization with other small mines. Hire some cracker-jack salespeople; there is a big market out there! Starve the COMEX if you want to see silver sell to realistic prices. Adjusted for inflation, the silver price of 48.00 that we saw in February of 1980, is trading at 4.00 today. (In 1980’s dollars, silver is now selling for 4.00 an ounce!)

Next, (and still communicating to mining CEO’s), instead of keeping money in the bank, or in various kinds of short-term notes, store up silver, and show us that you believe in the product you are producing. Instead of cash on hand, buy futures contracts, and keep rolling them over.

Coin dealers and wholesalers need to buy 5,000 oz bars from the COMEX, take delivery, and contact a refiner who will turn the silver into retail products. If your operation is not large enough for a 5,000 oz purchase then buy silver from people like Jason Hommel, who was smart enough to start doing this on a large scale.

Investors who can afford to spend $55,000.00 should consider buying a silver contract from the COMEX and taking delivery. James Sinclair at JSMineset.com will show you how to go about that.

Finally, anyone who holds any kind of a certificate that promises to deliver silver, needs to make sure that the bank or institution that stores the silver, is willing to provide bar numbers. Otherwise when the day comes to collect, you may find that the silver does not exist. On my website you will find an article that I wrote about a fund that stores gold and silver at a bank in Western Canada. They invite auditors twice a year to audit the inventory.

Cartoon courtesy Gary Varvel, Indy Star.

The Madoff scheme is but one example of the lack of oversight on the part of people who have been placed in the position of protecting the public. In the US Congress, two of the people responsible for the mess that was created by Freddie Mac (FRE) and Fannie Mae (FNM): Congressman Barney Franks and Senator Chris Dodd, are now part of the group that is trying to ‘fix’ the problem. The foxes are in the henhouse! It was Franks and Dodd, who for years received money from Fannie and Freddie, while they stood in the way of people who wanted to tighten the lending standard at these two mortgage lending institutions. Whatever happened to responsibility? Where is the outrage?

Featured is the weekly gold chart. Price is ready to breakout on the upside. The supporting indicators are positive (green dashed arrows). The 7 – 8 week cycles have been short (twice at 6 weeks). We are due for a longer cycle. A close above the blue arrow will indicate that week #4 is the start of a run up to the green arrow. Once 925.00 is reached, then 975 is next. Since Labor day, the Federal Reserve’s assets (including huge amounts of toxic assets), have increased from 905.7 billion to 2.3 trillion dollars. This, along with the increase in the monetary base is going to add to price inflation and will cause a lot of investment money to enter the gold market. The gold rally that started in November has only just begun.

Featured is the weekly silver chart. Price has been rising since late October. The supporting indicators are positive (green dashed arrows). A close above the blue arrow sets up a target at the green arrow.

Thanks to Eric Hommelberg for the idea to use ‘historic spot charts’ to make my case. I applied the 11th commandment: “Thou shalt use every good idea thou comest upon.”

=====================================================

Noteworthy Pundit: Marc Faber’s 2009 Predictions

Source: Tim Iacono of Iacono Research

Despite the stumbling introduction by Joe Kernen and some bizarre in-studio camera work on what appears to be a very old picture of Dr. Doom, this is a pretty good interview.

==================================================

Share this:

  • Reddit
  • Facebook
  • LinkedIn
  • More
  • Twitter
  • Pinterest
  • Tumblr
  • Print
  • Email

Like this:

Like Loading...

All That Glitters! – Gold is Looking Good!

22 Monday Dec 2008

Posted by jschulmansr in Bollinger Bands, capitalism, commodities, Copper, Currency and Currencies, Finance, Fundamental Analysis, gold, hard assets, inflation, Investing, investments, Latest News, Markets, mining stocks, precious metals, silver, small caps, Stocks, Technical Analysis, Today, U.S. Dollar, Uncategorized

≈ Comments Off on All That Glitters! – Gold is Looking Good!

Tags

agricultural commodities, alternate energy, Austrian school, banking crisis, banks, bear market, Bollinger Bands, bull market, capitalism, central banks, China, Comex, commodities, communism, Copper, Currencies, currency, deflation, depression, diamonds, dollar denominated, dollar denominated investments, economic, economic trends, economy, financial, Forex, futures, futures markets, gold, gold miners, hard assets, heating oil, India, inflation, investments, Keith Fitz-Gerald, market crash, Markets, mining companies, Moving Averages, natural gas, oil, palladium, Peter Schiff, physical gold, platinum, platinum miners, precious metals, price, price manipulation, prices, producers, production, protection, rare earth metals, recession, risk, run on banks, safety, Saudi Arabia, Sean Rakhimov, silver, silver miners, socialism, sovereign, spot, spot price, stagflation, Technical Analysis, timber, U.S. Dollar, volatility, warrants, Water

My Note: The Charts are looking great for Gold and Silver. Included in today’s post, the latest from Peter Schiff on Gold, An overview of the Charts for Gold and Silver. Finally, a very interesting article on Comex and a short squeeze, what could happen? My Disclosure Long Precious Metals and Stocks and more… Get aboard the Gold Train now… Last Call! – jschulmansr

Peter Schiff: Outlook for The Gold Market

By: Peter Schiff of Euro Pacific Capital

The Wall Street Transcript recently interviewed Peter Schiff, President and Chief Global Strategist of Euro Pacific Capital, Inc., on his outlook for the gold market. Key excerpts follow:

TWST: These are somewhat trying times. What has this meant so far for the gold market and where do we go from here?

Mr. Schiff: Gold has actually held up very well compared to other asset classes. If you look at the price of gold relative to its peak, it’s only off about 25%, whereas if you look at stock markets around the world, most are off 50% or more, certainly if you price them in US dollars. If you look at how gold has held up relative to industrial metals, relative to energy, relative to agriculture, gold has done extremely well. I think the fact that it has gone down in dollars has caused a lot of people to assume that gold is not performing in this correction whereas, in fact, it has. Also if you look at gold in terms of other currencies, recently you’ve seen all-time record highs in the price of gold in South African rand, in Australian dollars, in Canadian dollars. So gold has actually had a very strong, stealth move when viewed from the prism of something other than the US dollar.

TWST: Why does everybody key in on the US dollar side of the equation?

Mr. Schiff: Because gold was priced in dollars, it’s traded in dollars and so we all look at it as the dollar price, and the fact that gold has not made a new high in dollars during this economic crisis has led some to believe that maybe it’s lost its luster, it’s not a safe haven. But this rise of the dollar is very suspicious to me, I don’t think it’s justified. But it’s been the unlikely beneficiary of all the problems. You’ve got the problem centered in the US economy; the epicenter of the financial crisis is in America. The reason that the world is in trouble is mainly because of bad loans made to Americans and it’s our economy that I think is a complete facade, a house of cards that has now collapsed, so this dollar rally actually makes no sense.

And especially in light of the monetary policies that we pursued over the course of the last six months, the bailouts, the stimulus, all of the things that are likely to happen with Barack Obama saying that the sky is the limit on budget deficits, we’re going to print money until we run out of trees. Everything that we are doing is so negative for the dollar, yet the dollar has managed to rally. So I think temporarily the fundamentals are on hold, but I think once the dollar really resumes its decline, you’re going to see gold really shine again not only in terms of the dollar. It will continue to do well against other currencies, but it will do particularly well against the dollar.

TWST: Isn’t gold normally the “safe haven” that investors seek?

Mr. Schiff: I think it’s a safe haven. A lot of people are seeking safety right now in the US dollar, but that makes no sense to me. That’s like jumping out of the frying pan into the fire. I think the dollar is a fundamentally flawed currency that is doomed to collapse, and temporarily it’s benefiting from the fact that it’s seen as the alternative to everything else. People are worried about all asset classes, nobody wants to own anything and somehow by default, the dollar is the opposite of owning other things. People are keeping score in terms of dollars and I’d certainly think that some of the most impaired financial institutions are in the United States. I think some of the losses are very heavy here and that has made a lot of American institutions — investment banks, hedge funds, mutual funds —liquidate assets all around the world, many assets in other countries; those institutions require the liquidation of those currencies to repatriate the dollars necessary to meet their margin calls, to fund their redemptions, and so that might also be temporarily propping up the dollar.

TWST: Has the supply/demand situation in gold changed at this point because of the problems with the hedge funds?

Mr. Schiff: Yes, I think that the credit crunch has certainly put the screws on a lot of gold exploration. A lot of the junior miners are basically on the verge of going bankrupt right now. I’m sure a lot of projects are on hold; a lot of exploration is simply not going to get funded. This is simply improving the supply and demand imbalances that have favored gold for some time and other commodities too. Certainly in industrial metals, in the energy complex, a lot of exploration, a lot of development projects have been cancelled or are never going to see the light of day for many, many years because of the credit crunch and because of the fear of falling prices, which I think is unwarranted. But even when prices start to recover, I think there will be a lot of suspicion of the rally. So people are going to be reluctant to commit capital to a market they have no confidence in.

So I think the supply and demand imbalances for commodities are going to continue, and that commodities themselves are still one of the best asset classes around the world to own. As for the commodity producers, it all depends on their balance sheets. Some of them are going to be spectacular buys. Looking at the gold complex, I think one positive development I’ve seen has been the strength of the South African miners, which seem to have bottomed first. They started to decline before the overall sector; when many of the Canadian miners were making new highs, the South African stocks were falling. But it seems like the South Africans have bottomed here. They’ve made significant rallies, some of them have even doubled from their lows and they seem to be stronger. So they topped out first; maybe the fact that they have bottomed first is a positive sign. Maybe they are going to lead on the way up just like they led on the way down.

TWST: How about on the political side of the equation? What’s going to be the position of central banks now relative to gold?

Mr. Schiff: The Bank of Canada just slashed rates down to 1.5%. Central banks all around the world are reducing interest rates. It’s the most inflationary monetary policy globally that we have ever experienced and ever will experience in our lifetime. That’s a very favorable market for gold. When central banks are just putting the pedal to the metal on the printing presses and driving interest rates down to nothing, how can you not own gold? Gold is money, the supply of gold is going to grow very slowly over time, and the supply of all fiat currencies is going to grow rapidly. You’re looking at maybe 10%, 20% per year or more annual increases in money supply in every country in the world, and then they pay you next to nothing for holding it. If you want to take currency that is rapidly being debased and you want to deposit it someplace, you are barely getting interest, so why not own gold instead? Even though gold doesn’t pay interest, at least it’s not being debased.

TWST: What about the central banks selling gold? Are they going to back off now due to the financial crisis?

Mr. Schiff: At some point, the central bank selling is going to turn into buying. Who are these guys kidding? They need to have real reserves behind their currencies. They can’t simply hold the US dollars and say our currency has real value because it’s backed by the dollar. When the dollar is backed by nothing and being rapidly debased and paying no interest — our rates are down to 1% and likely to head lower. What’s the justification for foreign central banks holding dollar deposits rather than gold, when the dollar yields next to nothing? It doesn’t make any sense. So I think central banks are going to become buyers and the central banks that own the most gold are going to have the most influence, the strongest currencies, etc. I think people are going to see that and right now, if you look at the percentage of gold owned by central banks, it’s at the lowest it’s ever been.

TWST: Silver and platinum have come down much more than gold. Is that because of supply/demand or just because of what’s going on in the market?

Mr. Schiff: I think there are more industrial uses for those metals and so more of this whole idea that the global economy is going to collapse and no one is going to buy anything is hurting those metals relative to gold. I think gold is more of a pure monetary metal. Sure there’s some jewelry demand for gold, but it’s not used as much in industry, and I think it’s more of a monetary metal, a safe haven metal and so, because of that function, it is holding on to its value. I think there are a number of individuals around the world who understand the difference between gold and fiat money, and I think a lot of people are worried and want to protect their wealth. There is a minority of investors who see through the smokescreen and are not buying US Treasuries, they are buying gold. At some point, the people who are doing that are going to be the ones who are going to be vindicated as gold prices ultimately make new highs, and I still think that we could hit $2,000 an ounce next year in the price of gold.

ps- Peter Schiff has been very accurate recently!-jschulmansr

============================================

Great Looking Precious Metals Charts

By: Jeff Pierce of Zen Trader

I’ve had mixed results trading gold stocks in the past but those stocks have some of the best looking charts in the market pointing to higher prices very soon. I’m not going to speculate on why they’re rising when you consider how much money has been printed by the US and the inflation/deflation debate, but the fact is, they are rising and have the right price/volume action you want to see for near term price appreciation.

While I am near term cautious on the overall markets, I do have a buy signal on the gold/silver stocks as they have the capability to rise even when the general markets are falling.

aipc

While SLV didn’t rebound like the individual stocks in the silver sector did on Friday, it does look poised to move higher after a retest of the higher trendline of the triangle formation below.

aipc

============================================

Gold and Precious Metals Likely to Improve in 2009

By: Boris Sobolev of Resource Stock Guide


In this short update we focus on the long term technical picture for gold and precious metals stocks since the fundamentals have not changed and remain bullish. The technical picture, however, is getting very interesting.

Gold price action in the past half a year can best be characterized (especially after the recent rally) as consolidation. Such a consolidation is reasonable after a huge spike last year into early 2008, where gold exploded from $650 to over $1000 per ounce.

The long term monthly chart is encouraging. There is the clearly evident higher lows pattern, the RSI has bottomed and the MACD histogram is starting to curve higher.

Most importantly the 20-month Exponential Moving Average (EMA) is turning up, reversing a first-time-in-eight-years bearish turn downward. It is very important to see gold close above the 20-month EMA two months in a row; this would give further evidence of a bullish reversal.

The bull market in gold will resume in full force after gold penetrates its downtrend line which is currently at around $930.

Another bullish factor for gold is the renewed investment demand by the StreetTRACKS Gold Shares (GLD). Gold holdings have now reached an all-time-high of 775 tonnes.

On the monthly charts of a Gold Bugs Index ($HUI), highly significant buy signals have been generated. There have been successively higher lows for three months in a row, the RSI has bottomed and started moving higher, the stochastic indicator reversed from a very low level (a rare signal) and the MACD histogram is starting to curve.

Chart15

These long term reversals in indicators are highly reliable and rarely fail. There is a good probability that 2009 will turn out to be a complete opposite of the brutal 2008 for the precious metal stocks.

As stated several times before, we are starting to accumulate precious metals stocks having low exposure to base metals, with high gold and silver grade deposits, healthy balance sheets and prospects for internal growth.

===============================================

Will Comex Default on Gold and Silver?

By: Avery Goodman

Avery B. Goodman is a licensed attorney concentrating in securities law related cases. He holds a B.A. in history from Emory University, and a Juris Doctorate from the University of California at Los Angeles Law School. He is a member of the roster of neutral arbitrators of the National Futures Association (NFA) and the Financial Industry Regulatory Authority (FINRA).


With investment advisors like the former NASDAQ Chairman Bernard Madoff being prosecuted for fraud, it is natural for people to begin to seek stores of wealth that are not subject to counterparty risk. The precious metals have been relatively safe stores of wealth for the past 10,000 years. Many people are going back to basics, turning back to the precious metals, as places to put their money, in these uncertain times.

Gold and silver were once the most stable of all goods. Extreme volatility, however, is now a part of their nature. It comes from being made a part of the commodities casino, known as the American futures market, where speculators are allowed to use margin to control 14 times as much metal as they actually have money to buy. When the price drops a little, the “stop loss” orders of these leveraged players are triggered, and that amplifies the price move such that the price collapses on the futures market. Similarly, when gold fever begins, the prices can shoot into the sky, as the leveraged longs begin buying again. That is why the price for futures based gold and silver is still very low compared to March, 2008, even though the real world investment demand for both metals is higher than it was, back then (higher than ever before in history, actually), mining supply for gold is down by 5%, and the mine based supply of silver has utterly collapsed.

It should be noted that precious metal volatility is a short and sometimes medium term phenomenon. Since 1913, when the Federal Reserve was created, the dollar has depreciated by 97% against gold. The dollar has depreciated by about 90% against silver in that same 95 year time period. Gold has also appreciated tremendously in price as compared to 8 years ago, 2.5 times against the Euro and 3 times against the dollar. Rational people, therefore, cannot deny that, using a multi-year or, even more, a century long point of view, gold and silver are the best stores of wealth. When looking at long term family legacies, therefore, a large position in gold and silver should be a part of every estate plan. That is especially true now, given that demand currently substantially exceeds supply, the imbalance has every likelihood of becoming more severe in the near future, and the “futures” exchange prices are now very low compared to the real market.

In the last decade, central banks selling and leasing made up the long time shortfall between supply and demand. But, given the financial crisis, and the fear that the U.S. dollar will eventually collapse, central banks no longer want to hold all their exchange reserves in U.S. dollar cash, U.S. dollar denominated bonds and other investments. They are also unwilling to hold everything in other paper currencies, like the Euro. Some governments, including those in Europe and the USA, still have large gold hoards. But, China wants to buy 3,600 tons of additional gold for its reserves. The only way that this demand can be fulfilling without exploding the price is through a “privately negotiated” off-market sale of IMF gold. European banks don’t want to continue selling what gold hoards they still have left, after 20 to 30 years of participation of selling and leasing gold.

In the case of silver, almost all government stockpiles are now gone. The only ones left are in Russia and China, and China restricted the export of silver last year. The U.S.A., for example, has already expended every last ounce of its strategic silver reserves years ago. The U.K. and all other western nations exhausted their supplies even before the U.S.A. Newly mined supplies have never been sufficient, and demand continues to increase. The imbalance between supply and demand is becoming especially severe, and, in the case of silver, is going to increasingly be a difficult industrial use issue in the next few years.

Because of the severe shortages, retail dealers are charging hefty premiums for both gold and silver. This is dissuading many people from buying, but it shouldn’t, because there are ways to buy the metals without paying any premium at all. Gold and silver are selling cheaply, without premiums, on the American futures markets. Most futures contracts allow buyers to demand delivery of the metal, so the futures market is an excellent way to obtain comparatively cheap precious metals. This has already been noticed by astute investors. In the past, most traders used futures markets solely for purposes of speculation. Normally, delivery demands average less than 1% each month. Now, however, because of the premiums available in the real market, buying a futures contract and demanding physical delivery upon maturity has become a cheap method of obtaining substantial quantities of physical gold and silver. With respect to the December contract, for example, exchange records show that more than 5% of people holding open standard sized (100 ounce) gold futures contracts, and about 10% holding open silver futures contracts (5,000 ounce) demanded delivery. The delivery demands are happening even more often among deliverable mini-contracts (33.2 ounce gold/1,000 ounce silver) purchased on the NYSE-Liffe exchange.

Some speculate that clearing members of the exchanges, who have sold gold and silver short on the futures market, will eventually be bankrupted by these delivery demands. According to these skeptics, the gold and silver consists mostly of fake claims to vaulted supplies that do not exist. They say that futures contracts are nothing more than “fake paper gold” and most refuse to buy on the futures markets, opting, instead, to pay huge premiums at retail gold and silver dealers. The skeptics may be right about the failure to keep adequate supplies of vaulted metal, but it doesn’t really matter. If you buy gold and silver on the futures exchanges, you will get your metal, whether or not the short sellers are trying to defraud you, and I’ll now explain why.

The Commodities Futures Trading Commission is charged with the responsibility to monitor and regulate American futures markets. In spite of this, the futures markets have morphed from a legitimate place to hedge the risk of commodities, into a worldwide casino, which has a gaming commission that claims all of games of chance are really “investing”. This is nonsense. The exchanges are mostly used as gambling halls, with banks as casino operators, and speculators serving in the role of casino guests. All types of bets, from taking odds on interest rates to taking odds on the volatility of the stock markets (with no underlying security except the VIX!) are allowed, and are available to anyone who enjoys games of chance. If the CFTC ever bothered to enforce its own enabling act, and associated regulations, most of these games of chance would be quickly closed. For example, CFTC regulations require 90% of all deliverable commodity contracts (including gold and silver) to be covered by stockpiles of the real commodity, and/or real forward contracts from real producers (like miners). In practice, however, CFTC has never done a spot audit of even one vault. We really have no idea whether or not short sellers really have the gold or silver that they claim to have. We can assume that they probably don’t, given that the number of futures contracts issued has often exceeded the entire known supply of silver, for example, in the entire world.

Indeed, in spite of rampant speculation as to their identity, in truth, we don’t even know who the short sellers are. Other countries, like Japan, have full disclosure of identities and positioning, in open and transparent futures markets, but this is not true of the much larger futures markets based in America. American futures markets are mostly opaque, because the CFTC keeps the information secret. Lack of transparency always is a recipe for fraud and corruption. The likelihood of widespread violations, occurring at exchanges regulated by CFTC, is very high. Logical people, therefore, can make some reasonable assumptions. It is quite likely that the sellers on COMEX do not have 90% of their silver contracts, for example, backed by stockpiles of the metal.

Yet, adherence to Federal regulation is an implicit provision in the terms and conditions of every futures contract. If COMEX and/or NYSE-Liffe short sellers are entering into naked short contracts, they are violating market rules, falsely presenting their contracts to the public, and doing all this with a premeditated intent to defraud buyers. Knowingly making false assertions and promises is fraud in the inducement. Violation of the market rules is also “fraud upon the market”, and a federal and state felony level crime that can result in a long jail sentence. The vast majority of short positions in gold and silver appear to be held by only 2 – 3 American banks, so, it would be extraordinarily easy to pinpoint the perpetrators. Potentially, they could be prosecuted for market manipulation, common law fraud, state and federal RICO actions, as well as other counts.

In other words, a large scale default on COMEX or NYSE-Liffe would not only trigger the paying of money damages, but would also involve criminal liability. Even if a few individuals within the federal government are complicit, as has been alleged, and the U.S. Justice Department refused to prosecute, there are enough politically ambitious state prosecutors to take up the baton. Futures market short sellers would pay a heavy price if there were ever a big default. Because of this, they will spend whatever money is needed to make sure it never happens.

If a clearing member of an exchange fails to deliver, the futures exchanges are legally liable on the debt. If a clearing member goes bankrupt, performance becomes the obligation of the exchange. If a short position holder cannot or does not deliver, the exchange must either deliver, or pay in an amount equal to the difference between the contract price, and the amount of money needed to buy the physical commodity in the open market. Generally speaking, contract holders are allowed to purchase silver or gold on the spot market in a reasonably prompt manner, and all costs of doing so must be reimbursed.

Contrary to the claims of some sincere but misguided metal aficionados, while gold and silver may be occasionally in so called “backwardation”, both are readily available at the right price. That price, of course, may be considerably higher than the reported prices on futures markets. Precious metal will continue to be available so long as the price is “right”. If short sellers on COMEX are really as naked as some claim, the only result of technical “default” at the COMEX will be a huge “short squeeze”, sending precious metals prices to the roof. During this squeeze, movement of the U.S. dollar, up or down, will be irrelevant. If delivery demands exceed supplies in futures market warehouses, metal will be purchased on the spot market. Short sellers or the exchange will be forced to make good on whatever price is paid.

Here’s how it would work. Let’s say you buy a futures contract for February delivery of 100 ounces of gold at $800 per ounce in December. In February, spot gold is selling for $1,000 per ounce, and you deposit the full cash cost of your futures contract into your account, instructing your broker to issue a demand for delivery. The counterparty can’t deliver because the COMEX warehouse runs out of “registered” metal. There is a huge short squeeze as short sellers run around the world physical market, trying to buy gold. The short seller misses the last day to deliver. Because everyone starts hearing about the missed deliveries, by the next day after the last possible delivery date, spot gold in London starts selling for $1,359 per ounce. Your commodities broker must take the money you deposited and buy the commodity on the spot market for $1,359. The broker will be reimbursed by the short seller and/or the exchange in the amount of $55,900, plus any expenses you incurred in buying physical gold on the spot market. In the end, you get your gold or silver at the price you paid for the futures contract, regardless of the default.

A number of well intentioned, but misinformed, precious metal commentators have claimed that exchanges will escape from this obligation by a declaring a co-called “force majeure” event. Force majeure is a legal doctrine which says that compliance with a contract is excused if an “act of God” makes it impossible to comply. Formal force majeure provisions exist in many NYMEX contracts, including gas and oil contracts, for example. After recent hurricanes in Louisiana, a NYMEX committee declared force majeure, and an extension of time for delivery of natural gas pursuant to the contracts. Unlike gas, however, which is produced from the ground, or must be moved long distances under sometimes difficult conditions, gold and silver are commodities that normally reside in vaults, and are easily transported. It should be noted that, as of this date, no formal written force majeure provision exists in the specifications of COMEX gold and silver contracts. Admittedly, force majeure is a legal doctrine that is implied in every contract, and need not be written down. However, higher gold prices and/or failure to comply with the 90% cover rule are not acts of God and will not excuse contract performance.

Let’s say, as some claim, that short sellers have enmeshed themselves in a web of fake contracts, wherein third parties are contracted to deliver metal to them, even though both the short sellers and the third parties know that these contracts are fake, and there really is no metal to deliver. This web of lies assumedly is designed to protect against claims that they are selling “naked” shorts. The existence of such contracts doesn’t matter to the concept of force majeure. The obligation to deliver cannot be changed by a mere failure of “third” parties to deliver. Failure of contracts owed to short sellers are not acts of God. Failure of third parties to honor their contracts does not excuse performance of the short seller’s obligation to deliver to the final contract holder. It certainly does not alter the obligation of the exchange to guarantee delivery.

Some are still skeptical. What if the entire COMEX and NYSE-Liffe exchanges fail? I doubt that will happen. First, let me say that I do not agree with bailouts. Companies, whether in the financial district or in Detroit, should fend for themselves. No one should be allowed to become parasites who feed on the taxpayers, as the big banks and automakers have now become. If companies make mistakes, behaving in an inefficient and/or outright stupid manner, they and their executives should pay the price. The process of creative destruction is essential to prosperity in a capitalist system. Bad actors and inefficient operators should be swept away to make room for innovation and steadier hands. But, my views are not shared by the U.S. government or most other governments around the world. A large number of the clearing members of both COMEX and NYSE-Liffe have already been bailed out by their respective governments. Huge institutions like JP Morgan (JPM), Citigroup (C), Morgan Stanley (MS), Merrill Lynch (MER), Goldman Sachs (GS), Bank of America (BAC), UBS and Credit Suisse (CS) are considered “too big to fail.”

Can you imagine the exchanges not being too big to fail, when their individual members are? What chance do you think there is of the Federal Reserve allowing the entire COMEX or NYSE-Liffe exchange going bankrupt? In my opinion, the chance is close to zero. A massive failure to deliver is highly unlikely, but, if it did happen, and if the exchanges were unable to comply with their legally binding guarantee, the government will step in and provide gold from Fort Knox and enough money to buy silver in the open market, no matter what the price. The end result will merely be a huge price increase, and an end to the assumed legitimacy of futures market prices, not a default.

Summing things up, if you want to buy gold and silver, but don’t want to pay high premiums, buy them on futures exchanges. First, open a futures account with a commodities broker. Make sure it is a real commodities broker and not an imitation. Stock brokers, like Interactive Brokers, ThinkorSwim, MBTrading, and a number of others claim to be “futures brokers.” In truth, they are not. They can only offer you speculation, and not hedging services. They will not deliver, and will forcibly sell you out of your positions, even at great loss to you, if it comes too close to the delivery date. So, instead, make certain that you open your account with a real commodities broker, like RJOFutures.com, PFGBest, lind-waldock.com, MF Global, e-futures.com or any other broker willing to arrange deliveries. You can speculate just as easily, using a commodities broker, as you can using a stock broker that dabbles in futures. But, if you want delivery, you must have a real commodities broker. Steer clear of stock brokers unless you want to buy stocks.

Middle class families, looking for safety in precious metals, but who don’t have enough money to buy 100 ounce contracts, can buy deliverable mini-gold and mini-silver contracts on the NYSE-Liffe futures exchange. The mini-contracts require delivery of as little as 33.2 ounces of gold and 1,000 ounces of silver. If you want delivery, however, make sure you do not buy COMEX based miNY gold and/or miNY silver contracts. These COMEX mini-contracts are cash settled. The standard contracts, however, on both the COMEX and the NYSE-Liffe (consisting of 100 ounces of gold and 5,000 ounces of silver) are all deliverable.

The highly leveraged nature of gold and silver futures contracts create high levels of volatility. That should be kept in mind when you decide to put a large portion of your investment assets into precious metal. Big price rises and deep dips are commonplace. Most of these market movements occur without much regard for the forces of supply and demand in the real world market. If you need the money tomorrow, steer clear. But, if you want to preserve your family legacy with something that will take you safely through depressions and hyperinflations, over years and decades, gold and silver are good choices.

If you demand delivery and just put your bars in a safe place, you don’t need to worry about the volatility. The price is sure to rise in the longer term because of the fundamentals. Remember, as you watch the dizzying roller coaster of so-called “official spot” prices, that you are buying for the long term and/or for emergency use. Day to day price fluctuations should be ignored.

By way of disclosure, I hold interests in GLD, IAU and SLV as well as
physical gold.

================================================

Final Note: The more buyers who take delivery on their Gold or Silver contracts, the greater the chance of a “short squeeze”- jschulmansr

Share this:

  • Reddit
  • Facebook
  • LinkedIn
  • More
  • Twitter
  • Pinterest
  • Tumblr
  • Print
  • Email

Like this:

Like Loading...

Kinross Gold Leads Gold Sector Rebound – Seeking Alpha

10 Wednesday Dec 2008

Posted by jschulmansr in Bollinger Bands, commodities, Copper, Currency and Currencies, diamonds, Finance, Fundamental Analysis, gold, hard assets, inflation, Investing, investments, Latest News, Markets, mining stocks, oil, precious metals, silver, small caps, Stocks, Technical Analysis, Today, U.S. Dollar, uranium

≈ Comments Off on Kinross Gold Leads Gold Sector Rebound – Seeking Alpha

Tags

agricultural commodities, alternate energy, Austrian school, banking crisis, banks, bear market, Bollinger Bands, bull market, capitalism, central banks, China, Comex, commodities, communism, Copper, Currencies, currency, deflation, depression, diamonds, dollar denominated, dollar denominated investments, economic, economic trends, economy, financial, Forex, futures, futures markets, gold, gold miners, hard assets, heating oil, India, inflation, investments, Keith Fitz-Gerald, market crash, Markets, mining companies, Moving Averages, natural gas, oil, palladium, Peter Schiff, physical gold, platinum, platinum miners, precious metals, price, price manipulation, prices, producers, production, protection, rare earth metals, recession, risk, run on banks, safety, Saudi Arabia, Sean Rakhimov, silver, silver miners, socialism, sovereign, spot, spot price, stagflation, Technical Analysis, timber, U.S. Dollar, volatility, warrants, Water

Kinross Gold Leads Gold Sector Rebound – Seeking Alpha

By: Sam Kirtley of Gold-prices.biz

Sam Kirtley has been involved in investment in the financial markets for a number of years and has experience in stock investment and analysis as well as options trading. He is now a writer and analyst for various websites including uranium-stocks.net, gold-prices.biz, and silver-prices.net.

Gold stocks have been bouncing back recently, but few can challenge the extraordinary recovery of Kinross Gold (KGC), which has more than doubled since its low below $7. This is a sign that KGC is indeed one of the best gold mining companies in the world, since it has bounced back the furthest and the fastest.

(click to enlarge)

Technically some good signs from KGC are that the Relative Strength Index is moving higher having bounced up off the oversold zone at 30. Similarly, the MACD is trending northwards and is now in positive territory, but can still rise a lot further before giving an oversold signal.

If one is to have favourite shares, Kinross Gold Corp would certainly be one of ours, as it has been a holding of ours for years now, although we have traded the ups and downs when the opportunities presented themselves.

Having originally acquired Kinross at $10.08, after a large rally Kinross then went through a bit of a pull back so we signalled to our readers to “Add To Holdings” at discounted levels of around $11.66. We also gave another ‘Kinross Gold BUY’ signal when we purchased more of this stock on the 20th August 2007 for $11.48. On 31st January, 2008, we reduced our exposure to this stock when we sold about 50% of our holding for an average price of $21.96 locking in a profit of about 93.60%. On the 24th July, 2008, we doubled our holding with a purchase at $18.28 giving us a new average purchase price of $14.50.

As well as trading the stock, we have also dabbled in options contracts with Kinross, buying call options in KGC on the 16th June, 2008, paying $2.68 per contract and selling them on the 28th June 2008 for $5.30 per contract generating a 100% profit in two weeks. We then re-purchased them after they dropped for $2.50, and we are still holding them, although at a significant paper loss.

The reason we like Kinross Gold Corp so much is that it fits our criteria almost perfectly. When we look for a gold stock to buy, we are looking for solid fundamentals, a stable geopolitical situation and most importantly, leverage to the gold price itself.

As far as the fundamentals go, Kinross is a mid to large cap gold producer with a market cap of $9.47 billion. Some may consider this too large a company to offer decent leverage to the gold price, but as shown by the recent performance of the stock price, Kinross is definitely providing that leverage.

As well as leverage to rising gold prices, Kinross is also growing well as a company in its own right. Having made a gross profit of $390.40M in 2006 and then $501.80M in 2007 and with the Sep 08 quarterly profits at $269.80M, Kinross appears to be on track for another good year of record profits. There is also something in the financials that is particularly helpful in the present credit environment. In the last report from KGC, out of the $1284.80M in current assets, Kinross has a massive $322.90M in cash. This means it is well positioned to face any liquidity issues and will not be forced to try and raise money in the current difficult credit conditions.

Therefore, we continue to like Kinross and maintain our stock and option position in the company. Kinross Gold Corp is not only well positioned to benefit from rising gold price, but it is also a great company in its own right, with good growth potential. A full list of the stocks we cover can be found in our free online portfolio at http://www.gold-prices.biz.biz.

=============================================

Goldcorp Expected to Get 40% Gold and Silver Reserve Boost at Penasquito

Source: Financial Post Trading Desk

By: Jonathan Ratner

 Goldcorp provided an update for the Penasquito project in Mexico on Monday, a day ahead of its tour for analysts and shareholders.

The miner said its capital cost estimate is less than 10% higher than the original estimate of US$1.494-billion and construction continues to progress well.

When engineering work is complete, Goldcorp expects an approximate increase of 30% in gold reserves and a 15% to 20% increase in silver, lead and zinc reserves for year-end reporting.

There is also the potential for initial resources to be declared for bulk mineable and high-grade underground zones, as well as the Noche Buena property nearby, noted Canaccord Adams analyst Steven Butler. He assumes reserve additions will be roughly 40% for gold and silver and around 16% for lead and zinc.

Concentrate shipments are scheduled to being in the fourth quarter of 2009 and commercial production is expected for the following quarter. Meanwhile, shipments of large trial lots are anticipated in 2009 now that concentrate samples have been provided to select smelters, Mr. Butler said in a research note.

The analyst also noted that Goldcorp’s optimization efforts are underway. They include the possibility of recovering precious metals from low-grade lead ore that was previously considered uneconomic, the potential for underground bulk mining beneath currently defined open pits, and the possibility of cheaper power from a dedicated facility through a partnership with an independent provider.

Canaccord rates Goldcorp a “buy” with a price target of US$32 per share.

Jonathan Ratner 

<!–
–>========================================

The Fed Still Manipulates Gold and The Markets

By: Jake Towne of Yet Another Champion of the Constitution

In a dynamic duo of articles published last weekend, I predicted the fall of the Dollar via a Gold-based perspective, and a US Treasury-based perspective. I want to round off and perhaps even reinforce my theory with a few more opinions and thoughts, which of course may be faulty as the major decisions are still at the mercy and discretion of the Fed, whom I have learned to never underestimate. To be a real “expert” in economics today requires one to be an “expert” in predicting government interventions, so it is all guesswork unless one is an insider. I am highly interested if there are any crucial facts I am missing by the way, please leave any counterarguments below.

I own some gold and if gold goes down I’ll buy some more and if gold goes up I’ll buy some more. Gold during the course of the bull market, which has several more years to go, will go much higher. – Jim Rogers, famed commodities trader, last week

I have written previously how the Fed creates and destroys money, but the example I used of open market operations (OMOs) has changed dramatically in 2008. The Fed is, on a daily basis, still altering its Treasury holdings, but more importantly propping up other assets by buying them, such as mortgage-based securities, Citigroup (C), AIG, etc. The Fed balance sheets have plunged from its historical levels of ~95% Treasury securities to less than 32% Treasuries, which hampers OMOs since the assets purchased will likely find no willing buyer on the market.

It may seem like the Fed is creating lots of money (and they are) but remember that $7.76 trillion, $8.5 trillion, WHATEVER the new number will be by the end of this week, pales in comparison to the amount of financial derivatives in existence, which per the BIS at last count (and just over-the-counter!) was $684 trillion. I am not sure if I ever wrote this phrase in this column before, but I’ve always viewed the financial crisis as a “Triple-D” crisis. Dollar. Debt. Derivatives.

There is another method of money destruction that I have not overlooked and want to mention. In an economic “disintegration” or a monster of a recession, money can also be destroyed by corporate, government and private bankruptcies.

In the debt-based world we live in, I think money destruction could be seen in shocking scales far exceeding the imaginations of the Keynesian-economics-based minds of the Fed and other central bankers. For instance, comparatively there has been much less noise in the commercial mortgage markets. However, if a lot of businesses fail, which has been known to happen in any recession, how do you suppose those mortgages will be repaid to the banks? In such a scenario, central bankers have just two options: create replacement money to re-inflate supply, or revalue the currency to an asset (very likely gold, after all central bankers do not hold at least some gold for their collective health, the yellow stuff is nice life insurance for fiat currency, ain’t it?).

In this eye-popping December 4 essay by James Conrad, he reasons the central bankers will revalue to some sort of a gold standard to escape oblivion, and the price of gold will go from $750 per ounce to $7500-9000. [Remember the “price” is not REALLY going up, after all 1 ounce of gold is the same from day to day. What it really means is that all fiat currencies are going to be massively devalued as the worthless scraps of paper and electrons they really are!]

There is a legal requirement that, in every futures contract that promises to deliver a physical commodity, the short seller must be 90% covered by either a stockpile of the commodity or appropriate forward contracts with primary producers… Things, however, are changing fast. As previously stated, the first major mini-panic among COMEX gold short sellers happened last Friday. As of Wednesday morning, about 11,500 delivery demands for 100 ounce ingots were made at COMEX, which represents about 5% of the previous open interest. Another 2,000 contracts are still open, and a large percentage of those will probably demand delivery. These demands compare to the usual ½ to 1% of all contracts.

Time for Captain Calculator! On December 5, the open interest was 264,796 contracts (at 100 troy ounces per bar). This equates to 823 tonnes, a very significant amount equal to about 10% of the total gold reserves claimed by the United States, the world’s largest holder. There are 26.5 million ounces in contracts and only 2.9 million ounces in COMEX warehouses to cover deliveries as Dr. Fekete notes here. Over 40% of the warehouse totals will be delivered before January 1.

Where is the gold to cover the rest of the contracts? In the ground? In central bank vaults? At the GLD London vault? I do not know the answer, but I agree with Fekete’s comment on gold’s recent backwardation and Conrad, the traders requesting delivery are skeptical there is enough.

Conrad then proceeds to outline a very convincing (to me) proof that ends with:

It is only a matter of time before gold is allowed to rise to its natural level. Assuming that about half of the current increase in Fed credit is eventually neutralized, the monetized value of gold should be allowed to rise to between $7,500 and $9,000 per ounce as the world goes back to some type of gold standard. In the nearer term, gold will rise to about $2,000 per ounce, as the Fed abandons a hopeless campaign to support COMEX short sellers, in favor of saving the other, more productive, functions of the various banks and insurers.

Revaluation of gold, and a return to the gold standard, is the only way that hyperinflation can be avoided while large numbers of paper currency units are released into the economy. This is because most of the rise in prices can be filtered into gold. As the asset value of gold rises, it will soak up excess dollars, euros, pounds, etc., while the appearance of an increased number of currency units will stimulate investor psychology, and lending and economic output will increase, all over the world. Ben Bernanke and the other members of the FOMC Committee must know this, because it is basic economics.


Hyperinflation is nasty stuff. I first wrote about it in my July article “Calling All Wheelbarrows: Hyperinflation in America? (Part 2/2)” and a fellow Nolan Chart columnist, Republicae, with far more experience than I wrote “The Hyper-Inflationary Trigger.”

Jim Sinclair, precious metals expert, comments here:

I recently completed the same mathematics that helped me so much in 1980 to determine the price that would be required to balance the international balance sheet of the US.

Balancing the international balance sheet is gold’s mission in times of crisis.

I recently did the math again and was sadly shocked to see what the price of gold would have to be to balance the international balance sheet of the USA today. That price for gold is more than twice Alf’s projected maximum gold price.


Alf Field’s maximum projection is $6,000 per troy ounce. Wow, guess Captain Calculator can take a vacation! On that note I would like to end with a reminder to the republican, Republican, and the third person who is reading this:

“We renew our allegiance to the principle of the gold standard and declare our confidence in the wisdom of the legislation of the Fifty-sixth Congress, by which the parity of all our money and the stability of our currency upon a gold basis has been secured.”

– Republican National Platform, 1900

“We believe it to be the duty of the Republican Party to uphold the gold standard and the integrity and value of our national currency.”

– Republican National Platform, 1904

“The Republican Party established and will continue to uphold the gold standard and will oppose any measure, which will undermine the government’s credit or impair the integrity of our national currency. Relief by currency inflation is unsound and dishonest in results.”

– Republican National Platform, 1932 [Above are sourced from H.L. Mencken, A New Dictionary of Quotations on Historical Principles from Ancient and Modern Sources (1985, p. 471)

“We must make military medicine the gold standard for advances in prosthetics and the treatment of trauma and eye injuries.”

– the only mention of gold in the Republican National Platform, 2008. Try searching for ‘gold’ or ‘dollar’ here.

Well, the Gold Standard ended in the US in 1914 when the first unbacked and “unsound” Federal Reserve Notes were printed. Ok, I hate the Fed, but fellow columnist Gene DeNardo phrased it best in his intriguing article “MV=PT A Classic Equation and Monetary Policy“:

When the economy grows in a healthy way, we all share in the profit as our currency becomes stronger and is able to purchase more.

========================================

Inflation on Sale as Deflation Dominates Markets

By:  Eric Roseman of  The Sovereign Society

The time to start building fresh positions in oil, gold, silver and TIPs has arrived. Even distressed real estate should be accumulated if credit can be secured.

Over the next 6-12 months the United States, Europeans, Japanese and Chinese will eventually arrest deflation. And long before that materializes, hard assets will begin a major reversal following months of crippling losses.

Since peaking in July, the entire gamut of inflation assets has collapsed amid a growing threat of deflation or an environment of accelerated price declines. The last deflation in the United States occurred in the 1930s, purging household balance sheets, corporations, states, municipalities and even the government following two New Deals.

Thus far, U.S. CPI or the consumer price index has not turned negative year-over-year. Yet as oil prices continue to lose altitude and other commodities have been crushed, input costs and price pressures continue to decline dramatically since October. The only major component of CPI that continues to post modest year-over-year gains is wages. And with unemployment now rising aggressively this quarter it’s highly likely wage demands will also come to a screeching halt.

Plunging Bond Yields Discount Danger

In the span of just six months, foreign currencies (except the yen), commodities, stocks, non-Treasury debt, real estate and art have all declined sharply in value in the worst panic-related sell-off in decades. More than $10 trillion dollars’ worth of asset value has been lost worldwide in 2008.

What’s working since July? U.S. Treasury bonds and the U.S. dollar as investors scramble for safety and liquidity.

On December 5, 30-day and 60-day T-bills yielded just 0.01% – the lowest since the 1930s while the benchmark 10-year T-bond traded below 2.55% – its lowest yield since Eisenhower was president in 1955. Even 30-year bonds have surged as the yield recently dropped below 3% for the first time in more than four decades.

The market is now pricing a severe recession and – possibly – another Great Depression. Despite a series of formidable regular market interventions by central banks since August 2007, the credit crisis is still alive and kicking. The authorities have not won the battle …at least not yet.

Heightened inter-bank lending rates, soaring credit default swaps for sovereign government debt and plunging Treasury yields all confirm that the primary trend is still deflation.

To be sure, credit markets worldwide have improved markedly since the dark days of early October. Investment-grade corporate debt is rallying, commercial-paper is flowing again and companies are starting to issue debt once more – but only the highest and most liquid of companies. For the most part, banks are still hoarding cash and borrowers can’t obtain credit.

The real economy is now feeling the bite as consumption falls off a cliff, foreclosures soar and the unemployment rate surges higher. These primary trends are deflationary as broad consumption is severely curtailed, with consumers preparing for the worst economy since 1981 and rebuilding devastated household balance sheets.

But at some point over the next 12 months, the market might transition from outright deflation or negative consumer prices to some sort of disinflation or at least an environment of stable prices. That’s when inflation assets should start rallying again.

Inflate or Die: The Name of the Game in 2009

The battle now being waged by global central banks, including the Federal Reserve is an outright attack on deflation. Through the massive expansion of credit, the Fed and her overseas colleagues are on course to print money like there’s no tomorrow to finance bulging fiscal spending plans, bailouts, tax cuts and anything else that helps to alleviate economic stress.

Earlier in November, the Fed announced it would target “quantitative easing” and “monetization,” unorthodox monetary policy tools rarely or never used in the post-WW II era.

Without getting too technical, the term “quantitative easing” means the Fed will act as the buyer of last resort to monetize Treasury debt and other government agency paper in an attempt to bring interest rates down. Quantitative easing aims to flood the financial system with liquidity and absorb excess cash through monetization or purchasing of government securities.

Through monetary policy, the Fed controls short-term lending rates but cannot influence long-term rates that are largely set by the markets; the Fed now hopes it can influence long-term rates through quantitative easing. And since its announcement two weeks ago, long-term fixed mortgage rates have declined sharply.

These and other open market operations directed by the Fed and Treasury will eventually arrest the broad-based deflation engulfing asset prices. It will take time. Inflation is the desired goal and is the preferred evil to deflation, a monetary phenomenon that threatens to destroy or seriously compromise the financial system. Policy-makers have studied the Great Depression, including Fed Chairman Bernanke, and the consequences of failed central bank and government intervention in times of severe economic duress are unthinkable.

Ravenous Monetary Expansion

According to Federal Reserve Board data, the Fed is now embarking on a spectacular expansion of credit unseen in the history of modern financial markets.

Lichtensteins Banner

The total amount of Federal Reserve bank credit has increased from $800 billion dollars to $2.2 trillion dollars (or from 6% to 15% of gross domestic product) as the central bank expands its various liquidity facilities in an attempt to preserve normal functioning of the financial system.

The Fed’s ongoing operations to arrest falling prices are targeted namely at housing – the epicenter of this financial crisis. It is highly unlikely that the United States economy will bottom until housing prices find a floor. Quantitative easing hopes to stabilize this market.

Buy Gold Now

Relative to other assets in 2008, gold prices have declined far less. The ongoing liquidity squeeze has forced investors to dump assets, including gold to raise dollars. I suspect this short-term phenomenon will end in 2009 once the ongoing panic subsides and credit markets become largely functional again.

Gold should be accumulated now ahead of market stabilization. As the financial system gradually comes back to life over the next several months or sooner, the dollar should commence another period of weakness; there will be little incentive to hold dollars with short-term rates at or close to zero percent. The Fed will be in no hurry to raise lending rates.

Still, the Japanese experience in the 1990s warns investors of the travails of long-term deflation.

The Japanese, unlike the United States, only started to seriously attack falling prices in the economy in 1998 through massive fiscal spending. In contrast, the U.S. is already throwing everything at the crisis after just 17 months.

I expect the United States to print its way out of misery and, over time, and conquer deflation. But the cost will be humungous and at the expense of the dollar, U.S. financial hegemony and calls for a new monetary system anchored by gold.

It’s literally “inflate or die” for global central banks. Inflation will win.

My Note: If you haven’t START BUYING PRECIOUS METALS NOW! Especially GOLD -I AM!    jschulmansr


Share this:

  • Reddit
  • Facebook
  • LinkedIn
  • More
  • Twitter
  • Pinterest
  • Tumblr
  • Print
  • Email

Like this:

Like Loading...

Time to Revise Our Gold Expectations – Seeking Alpha

08 Monday Dec 2008

Posted by jschulmansr in Bollinger Bands, capitalism, commodities, Copper, Currency and Currencies, deflation, Finance, Fundamental Analysis, gold, hard assets, Investing, investments, Latest News, Markets, mining stocks, precious metals, silver, small caps, Stocks, Technical Analysis, Today, U.S. Dollar, uranium

≈ Comments Off on Time to Revise Our Gold Expectations – Seeking Alpha

Tags

agricultural commodities, alternate energy, Austrian school, banking crisis, banks, bear market, Bollinger Bands, bull market, capitalism, central banks, China, Comex, commodities, communism, Copper, Currencies, currency, deflation, depression, diamonds, dollar denominated, dollar denominated investments, economic, economic trends, economy, financial, Forex, futures, futures markets, gold, gold miners, hard assets, heating oil, India, inflation, investments, Keith Fitz-Gerald, market crash, Markets, mining companies, Moving Averages, natural gas, oil, palladium, Peter Schiff, physical gold, platinum, platinum miners, precious metals, price, price manipulation, prices, producers, production, protection, rare earth metals, recession, risk, run on banks, safety, Saudi Arabia, Sean Rakhimov, silver, silver miners, socialism, sovereign, spot, spot price, stagflation, Technical Analysis, timber, U.S. Dollar, volatility, warrants, Water

Time to Revise Our Gold Expectations – Seeking Alpha

Source: FP Trading Desk

The price of gold is showing signs of stability after gold stocks got crushed in the commodity sell-off early this fall. However, we are clearly not in the $1000-plus gold price environment many had anticipated under these dire economic conditions, nor have traditional multiples returned, says Credit Suisse analyst Anita Soni.

Apart from a brief period earlier this year, when gold hit an all-time high above $1030 an ounce, the yellow metal has not performed true to course. The first quarter advance proved to be a bubble with large-scale institutional speculators driving the price sharply higher… and then sharply lower over the next seven months, according to Jeffrey Nichols, managing director at American Precious Metals Advisors.

Mr. Nichols told the China Gold & Precious Metals Summit in Shanghai on Thursday:

In spite of the lack of direction and day-to-day price volatility in the gold market this year, at least we can say that no other asset class has held its value quite so well.

“Clearly the standard 1 to 2 times price-to-net asset value [NAV] paradigm no longer applies, particularly for the more junior stocks,” Ms. Soni said in a research note, adding that exposure to base metal by-products is no longer a guarantee of lower cash costs. For senior producers, P/NAV multiples are around 0.5 times, while they range for 0.66x for mid-tier names and as much as 1x for small market cap companies.

Until longer-term valuation fundamentals matter again, Ms. Soni believes she has determined an appropriate near-term basis for valuing gold equities. It uses spot commodity prices plus 10% to determine net asset values: $850 per ounce for gold, $10.50 for silver, $1.80 per pound of copper and $0.58 for zinc.

This produces returns between 30% and 60%, which she considers a reasonable near-term basis for valuation until gold moves upward again. Ms. Soni has also produced target prices and net asset values for the long term, with an extra 10% for gold again, or $930, a level she said is “imminently achievable.”

As a result of these changes, Credit Suisse has upgraded its rating on Kinross Gold Corp. (KGC) to “outperform,” while Yamana Gold Inc. (AUY) and Northgate Minerals Corp. (NXG) have been downgraded to “neutral.” Target price reductions for the miners it covers range from 18% to 80%.

“The issues in the mid-tier space are those of operational risk and to a lesser extent, the spectre of potential funding shortfall,” Ms. Soni said. Yamana’s recent production and cost revisions have not been well-received, sending its share price multiple from near-senior levels to the discounted mid-tier level.

She cited several other near-term issues that could weigh on the stock. Its production ramp-up will likely be slower than expected and the market may show a lack of patience with this.

Yamana’s capital program funding could get very tight if current market conditions and commodity prices persist, which may make it very hard for the company to resist issuing equity given the success Agnico-Eagle Mines Ltd. (AEM) and Red Back Mining Inc. (RBIFF.PK) have had with their recent financings.

Cut-backs to preserve capital will hurt its value in terms of adding exploration and growth opportunities, and Yamana currently has significant exposure to copper.

And while Ms. Soni suggested that Yamana is perhaps the best candidate for a takeover given its low valuation and a few very good assets, particularly El Penon in Chile, she says this is not enough to recommend it as an “outperform.”

Share this:

  • Reddit
  • Facebook
  • LinkedIn
  • More
  • Twitter
  • Pinterest
  • Tumblr
  • Print
  • Email

Like this:

Like Loading...

GoldMoney – Alert!

02 Tuesday Dec 2008

Posted by jschulmansr in Bollinger Bands, capitalism, commodities, Copper, Currency and Currencies, deflation, Finance, Fundamental Analysis, gold, inflation, Investing, investments, Latest News, Markets, mining stocks, Moving Averages, oil, precious, precious metals, silver, Stocks, Technical Analysis, Today, U.S. Dollar, Uncategorized

≈ 1 Comment

Tags

agricultural commodities, alternate energy, Austrian school, banking crisis, banks, bear market, Bollinger Bands, bull market, capitalism, central banks, China, Comex, commodities, communism, Copper, Currencies, currency, deflation, depression, diamonds, dollar denominated, dollar denominated investments, economic, economic trends, economy, financial, Forex, futures, futures markets, gold, gold miners, hard assets, heating oil, India, inflation, investments, James Turk, Keith Fitz-Gerald, market crash, Markets, mining companies, Moving Averages, natural gas, oil, palladium, Peter Schiff, physical gold, platinum, platinum miners, precious metals, price, price manipulation, prices, producers, production, protection, rare earth metals, recession, risk, run on banks, safety, Saudi Arabia, silver, silver miners, socialism, sovereign, spot, spot price, stagflation, Technical Analysis, timber, U.S. Dollar, volatility, warrants, Water

GoldMoney – Alert!

James Turk

A Successful Test of Support

In the last alert I referred to “the growing body of evidence” indicating that “the correction in gold that began after making a new record high in March above $1020 is ending.” Importantly, this point is confirmed by the following monthly chart presenting gold’s rate of exchange against the US dollar.

To explain this key development in technical terms, after making a new record high this past March, gold retraced back toward its previous record (marked in the above chart by the dashed line). Gold did the same thing back in 1978 after breaking above $200 in July that year (marked by the red circle), its previous record high. Gold climbed another 17% through October 1978, and then corrected the following month by testing $200. Support at that level held.

From there gold never looked back. It began a stellar advance that took it to $681.50, its month-end close in January 1980, the level that was just successfully tested.

The big difference between now and back then is the time needed to re-test support. The correction lasted only one month in 1978, but is now already eight months old. There are a number of reasons for this different result, but one is not the gold cartel. It was active back in the late 1970s too, dishoarding 775 tonnes from the International Monetary Fund in a vain and useless attempt to make the dollar look better by trying to cap the gold price.

The clear conclusion is that governments, even when they coordinate their effort, cannot in the end stop the market from bidding up the price of gold. So it is logical to expect a new record high for gold soon against the US dollar. It is noteworthy that gold closed this past month at new record highs against the British pound, Canadian dollar, Indian rupee and South African rand.

The driving force to exit national currencies and to buy gold is the same now as it was in the 1970s. Gold is better money than national currencies.


Published by GoldMoney
Copyright © 2008. All rights reserved.
Edited by James Turk, alert@goldmoney.com

Share this:

  • Reddit
  • Facebook
  • LinkedIn
  • More
  • Twitter
  • Pinterest
  • Tumblr
  • Print
  • Email

Like this:

Like Loading...

Golden Choice For Bailout Inflation Protection – Forbes.com

28 Friday Nov 2008

Posted by jschulmansr in Bollinger Bands, capitalism, commodities, Copper, Currency and Currencies, deflation, Finance, gold, hard assets, inflation, Investing, investments, Latest News, Markets, mining stocks, Moving Averages, oil, precious metals, silver, small caps, Stocks, Technical Analysis, Today, U.S. Dollar, Uncategorized

≈ 1 Comment

Tags

agricultural commodities, alternate energy, Austrian school, banking crisis, banks, bear market, Bollinger Bands, bull market, capitalism, central banks, China, Comex, commodities, communism, Copper, Currencies, currency, deflation, depression, diamonds, dollar denominated, dollar denominated investments, economic, economic trends, economy, financial, Forex, futures, futures markets, gold, gold miners, hard assets, heating oil, India, inflation, investments, market crash, Markets, mining companies, Moving Averages, natural gas, oil, palladium, physical gold, platinum, platinum miners, precious metals, price, price manipulation, prices, producers, production, protection, rare earth metals, recession, risk, run on banks, safety, Saudi Arabia, silver, silver miners, socialism, sovereign, spot, spot price, stagflation, Technical Analysis, timber, U.S. Dollar, volatility, warrants, Water

Golden Choice For Bailout Inflation Protection – Forbes.com

John Dobosz, 11.26.08, 11:50 AM EST

Gold and gold miners have taken flight in recent days as the world begins to focus on an inflationary future.

Since the problems associated with the current financial crisis began to take on a particular menace last summer, the response of our monetary institutions has involved moves that most students of economics would call inflationary, like aggressive reduction in targeted short-term lending rates and credit creation at a feverish pace.

Thanks to the deflationary forces that accompanied the unwinding of leverage in the financial system and in the flagging economy at large, the dollar actually rallied and gold suffered big time. From a post Jimmy Carter high of $1,011 in March, spot gold tumbled 30% down to $712 an ounce.

Now, however, investors seem to be awakening to the inflationary impact of the moves by the Federal Reserve and the Treasury Department. Over the past three weeks, gold has staged a rally, and over just the past week, it has looked more like a lift-off. Spot gold was above $830 for much of this holiday-shortened trading week, a gain of more than 15% from lows earlier this month, with most of that coming just since Thursday.

Moving higher more rapidly than gold bullion itself are shares of gold miners. The Philadelphia Gold and Silver Mining Index (XAU) added nearly 43% in just the past three days. This could indicate simply that the miners were more deeply oversold, or, if it persists, it could mean that investors are looking for escalating gold prices down the line. Either way, it looks like gold and the miners are staging a decent rally that could last until the first quarter of next year, according to Curt Hesler, editor of Professional Timing Service.

Hesler has several mining stocks that he likes for playing the new buoyancy in gold shares, from blue chips like Goldcorp (nyse: (GG) – news – people ) to smaller names like Yamana Gold (nyse: (AUY) – news – people ) and the tiny like US Gold Corp. (amex: (UXG) – news – people ). For smaller investors, perhaps it’s best to buy a basket of miners and jump on the train.

A great way to get into gold miners is through the Fidelity Select Gold (FSAGX) fund, a diversified grab bag that holds a small amount of gold bullion and a long roster of mining companies. Its biggest holdings are in Barrick Gold (nyse: (ABX) – news – people ), Goldcorp and Newmont Mining (nyse: (NEM) – news – people ) and Agnico Eagle (nyse: (AEM) – news – people ).

The expense ratio of FSAGX is one of the things to like most about this fund. At 0.81% it’s nearly half the 1.47% charged by most precious metals funds. Another nice feature is that it trades throughout the day, and you can get in and out when you like and even use limit orders when buying.

Lately the fund has been volatile, but it’s going in the right direction for the bulls. It’s up 40% in the past month. Of course, prior to that, it lost half of its value from late September through late October, overshooting even the steep correction in gold. Many advisers recommend an allocation of 5% to 10% in your portfolio to inflation hedges, like gold.

Click here to sign up to receive Stock of the Week next Monday morning.

Share this:

  • Reddit
  • Facebook
  • LinkedIn
  • More
  • Twitter
  • Pinterest
  • Tumblr
  • Print
  • Email

Like this:

Like Loading...

Simple Moving Averages Make Trends Stand Out

17 Monday Nov 2008

Posted by jschulmansr in Bollinger Bands, commodities, Copper, Currency and Currencies, deflation, Finance, gold, hard assets, inflation, Investing, investments, Latest News, Markets, mining stocks, Moving Averages, oil, precious metals, silver, Technical Analysis, Today, U.S. Dollar, Uncategorized, uranium, Water

≈ Comments Off on Simple Moving Averages Make Trends Stand Out

Tags

agricultural commodities, alternate energy, Austrian school, banking crisis, banks, bear market, bear stearns, Bollinger Bands, bull market, capitalism, central banks, China, Comex, commodities, communism, Copper, Currencies, currency, deflation, depression, diamonds, dollar denominated, dollar denominated investments, economic, economic trends, economy, financial, Forex, futures, futures markets, gold, gold miners, hard assets, heating oil, India, inflation, investments, market crash, Markets, mining companies, Moving Averages, natural gas, oil, palladium, physical gold, platinum, platinum miners, precious metals, price, price manipulation, prices, producers, production, protection, rare earth metals, recession, risk, run on banks, safety, silver, silver miners, socialism, sovereign, spot, spot price, stagflation, Technical Analysis, timber, U.S. Dollar, volatility, Water

Simple Moving Averages Make Trends Stand Out

By: John Devcic of BK TRADER FX    The 5 Things That Move The Currency Market

Moving averages are one of the most popular and often-used technical indicators. The moving average is easy to calculate and, once plotted on a chart, is a powerful visual trend-spotting tool. You will often hear about three types of moving average: simple, exponential and linear. The best place to start is by understanding the most basic: the simple moving average (SMA). Let’s take a look at this indicator and how it can help traders follow trends toward greater profits.

Trendlines
There can be no complete understanding of moving averages without an understanding of trends. A trend is simply a price that is continuing to move in a certain direction. There are only three real trends that a security can follow:

  • An uptrend, or bullish trend, means that the price is moving higher. 
  • A downtrend, or bearish trend, means the price is moving lower.  
  • A sideways trend, where the price is moving sideways.

The important thing to remember about trends is that prices rarely move in a straight line. Therefore, moving-average lines are used to help a trader more easily identify the direction of the trend. (For more advanced reading on this topic, see The Basics Of Bollinger Bands and Moving Average Envelopes: Refining A Popular Trading Tool.)

Moving Average Construction
The textbook definition of a moving average is an average price for a security using a specified time period. Let’s take the very popular 50-day moving average as an example. A 50-day moving average is calculated by taking the closing prices for the last 50 days of any security and adding them together. The result from the addition calculation is then divided by the number of periods, in this case 50. In order to continue to calculate the moving average on a daily basis, replace the oldest number with the most recent closing price and do the same math.

No matter how long or short of a moving average you are looking to plot, the basic calculations remain the same. The change will be in the number of closing prices you use. So, for example, a 200-day moving average is the closing price for 200 days summed together and then divided by 200. You will see all kinds of moving averages, from two-day moving averages to 250-day moving averages.

It is important to remember that you must have a certain number of closing prices to calculate the moving average. If a security is brand new or only a month old, you will not be able to do a 50-day moving average because you will not have a sufficient number of data points.

Also, it is important to note that we’ve chosen to use closing prices in the calculations, but moving averages can be calculated using monthly prices, weekly prices, opening prices or even intraday prices. (For more, see our Moving Averages tutorial.)

Figure 1: A simple moving average in Google Inc.
Source: StockCharts.com

Figure 1 is an example of a simple moving average on a stock chart of Google Inc. (Nasdaq:GOOG). The blue line represents a 50-day moving average. In the example above, you can see that the trend has been moving lower since late 2007. The price of Google shares fell below the 50-day moving average in January of 2008 and continued downward.

When the price crosses below a moving average, it can be used as a simple trading signal. A move below the moving average (as shown above) suggests that the bears are in control of the price action and that the asset will likely move lower. Conversely, a cross above a moving average suggests that the bulls are in control and that the price may be getting ready to make a move higher. (Read more in Track Stock Prices With Trendlines.)

Other Ways to Use Moving Averages           
Moving averages are used by many traders to not only identify a current trend but also as an entry and exit strategy. One of the simplest strategies relies on the crossing of two or more moving averages. The basic signal is given when the short-term average crosses above or below the longer term moving average. Two or more moving averages allow you to see a longer term trend compared to a shorter term moving average; it is also an easy method for determining whether the trend is gaining strength or if it is about to reverse. (For more on this method, read A Primer On The MACD.)

Figure 2: A long-term and shorter term moving average in Google Inc.
Source: StockCharts.com

Figure 2 uses two moving averages, one long-term (50-day, shown by the blue line) and the other shorter term (15-day, shown by the red line). This is the same Google chart shown in Figure 1, but with the addition of the two moving averages to illustrate the difference between the two lengths.

You’ll notice that the 50-day moving average is slower to adjust to price changes, because it uses more data points in its calculation. On the other hand, the 15-day moving average is quick to respond to price changes, because each value has a greater weighting in the calculation due to the relatively short time horizon. In this case, by using a cross strategy, you would watch for the 15-day average to cross below the 50-day moving average as an entry for a short position.

Figure 3: A three-month
Source: StockCharts.com

The above is a three-month chart of United States Oil (AMEX:USO) with two simple moving averages. The red line is the shorter, 15-day moving average, while the blue line represents the longer, 50-day moving average. Most traders will use the cross of the short-term moving average above the longer-term moving average to initiate a long position and identify the start of a bullish trend. (Learn more about applying this strategy in Trading The MACD Divergence.)

Support and Resistance
Support and resistance, or ceilings and floors, refer to the same thing in technical analysis.

  • Support is established when a price is trending downward. There is a point at which the selling pressure subsides and buyers are willing to step in. In other words, a floor is established.  
  • Resistance happens when a price is trending upward. There comes a point when the buying strength diminishes and the sellers step in. This would establish a ceiling. (For more explanation, read Support & Resistance Basics.)

In either case, a moving average may be able to signal an early support or resistance level. For example, if a security is drifting lower in an established uptrend, then it wouldn’t be surprising to see the stock find support at a long-term 200-day moving average. On the other hand, if the price is trending lower, many traders will watch for the stock to bounce off the resistance of major moving averages (50-day, 100-day, 200-day SMAs). (For more on using support and resistance to identify trends, read Trend-Spotting With The Accumulation/Distribution Line.)

Conclusion
Moving averages are powerful tools. A simple moving average is easy to calculate, which allows it to be employed fairly quickly and easily. A moving average’s greatest strength is its ability to help a trader identify a current trend or spot a possible trend reversal. Moving averages can also identify a level of support or resistance for the security, or act as a simple entry or exit signal. How you choose to use moving averages is entirely up to you.

For further reading on moving averages, check out Simple Moving Averages And Volume Rate-Of-Change and Basics Of Weighted Moving Averages.

by John Devcic, (Contact Author | Biography)

John Devcic is a freelance writer, market historian and private speculator. After investing in a mutual fund right out of high school and losing his initial investment of $350, Devcic began to believe he could do better with his money then the so-called experts could. Over the years a healthy and sometimes unhealthy obsession with how the markets work and how they worked in the past has made Devcic a true market historian. He reminds himself at all times that the market – while ever-changing – always seems to repeat itself.

Share this:

  • Reddit
  • Facebook
  • LinkedIn
  • More
  • Twitter
  • Pinterest
  • Tumblr
  • Print
  • Email

Like this:

Like Loading...

Subscribe

  • Entries (RSS)
  • Comments (RSS)

Archives

  • March 2020
  • February 2020
  • January 2020
  • November 2012
  • October 2012
  • August 2011
  • January 2011
  • December 2010
  • November 2010
  • October 2010
  • September 2010
  • August 2010
  • July 2010
  • June 2010
  • May 2010
  • April 2010
  • March 2010
  • September 2009
  • August 2009
  • July 2009
  • June 2009
  • May 2009
  • April 2009
  • March 2009
  • February 2009
  • January 2009
  • December 2008
  • November 2008
  • October 2008
  • September 2008
  • August 2008
  • July 2008
  • June 2008
  • April 2008
  • December 2007
  • October 2007
  • September 2007
  • June 2007
  • May 2007
  • April 2007
  • March 2007
  • February 2007
  • January 2007

Categories

  • #(subject)
  • 10 year Treasuries
  • 17898337
  • 20 yr Treasuries
  • 2008 Election
  • 90 Day Challenge
  • @replies
  • Achievement
  • advertising
  • agricultural commodities
  • alternate energy
  • Alternate Fuel Sources
  • alternative Energy
  • ANV
  • appscout
  • ask for help
  • Austrian school
  • AUY
  • Bailout News
  • banking crisis
  • banking crisis banks bear market bull central deflation depression economic trends economy financial futures gold inflation crash Markets precious metals price protection recession safety silver plati
  • banks
  • Barack
  • Barack Dunham
  • Barack Hussein Obama
  • Barack Obama
  • Barry Dunham
  • Barry Soetoro
  • bear market
  • Bear Trap
  • Bernanke
  • best twitter apps
  • bible
  • Bildenberger's
  • bilderbergers
  • Body By ViSalus
  • Bollinger Bands
  • Bollinger Bands Saudi Arabia
  • bonds
  • Brad Zigler
  • Brian Tang
  • bull market
  • cancer
  • capitalism
  • categorize your tweets
  • CDE
  • CEF
  • cell phone
  • central banks
  • CFR
  • Chemotherapy
  • Chicago Tribune
  • China
  • Christian
  • cobalt
  • Columbia University
  • Comex
  • commodities
  • communism
  • computer security
  • Computers and Computing
  • Conservative
  • Conservative Resistance
  • Contrarian
  • Copper
  • Council on Foreign Relations
  • crash
  • Credit Default
  • Crude Oil
  • Currencies
  • currency
  • Currency and Currencies
  • CyberKnife
  • D.c. press club
  • Dan Norcini
  • Dare
  • DARE SOMETHING WORTHY TODAY
  • deflation
  • Dennis Gartman
  • depression
  • desktop client
  • DGP
  • DGZ
  • diamonds
  • Diet and Dieting
  • digsby
  • direct-messaging
  • dollar denominated
  • dollar denominated investments
  • Doug Casey
  • Dow Industrials
  • economic
  • Economic Recovery
  • economic trends
  • economy
  • EGO
  • Electoral College
  • Electors
  • Euro
  • Fed Fund Rate
  • Federal Deficit
  • federal reserve
  • Finance
  • financial
  • follow the money
  • follow the news
  • Forex
  • fraud
  • Free Speech
  • FRG
  • Fundamental Analysis
  • futures
  • futures markets
  • G-20
  • gata
  • GDX
  • gearlog
  • Geitner
  • GeoThermal Power
    • Geothermal Energy
  • GG
  • GLD
  • gold
  • Gold Bubble
  • Gold Bullion
  • Gold Investments
  • gold miners
  • Gold Price Manipulation
  • Government Spending
  • Green Energy
  • Greg McCoach
  • GTU
  • hacking
  • hard assets
  • Harvard Law School
  • hawaii
  • Health and Wellness
  • heating oil
  • hellotxt
  • Hepatitis C
  • HL
  • how to change
  • How To Invest
  • How To Make Money
  • how to use twitter
  • hyper-inflation
  • IAU
  • id theft
  • IMF
  • India
  • Indonesia
  • Indonesian Citizenship
  • inflation
  • Investing
  • investments
  • Iran
  • Israel
  • Japan
  • Jay Taylor
  • Jeffrey Nichols
  • Jim Rogers
  • Jim Sinclair
  • Joe Biden
  • Joe Foster
  • John Embry
  • John McCain
  • joyner
  • Jschulmansr
  • Julian D.W. Phillips
  • Junior Gold Miners
  • Keith Fitz-Gerald
  • kennedy
  • Latest News
  • legal documents
  • Liability
  • Long Bonds
  • majors
  • Make Money Investing
  • maltz
  • manipulation
  • Marc Faber
  • Mark Hulbert
  • Market Bubble
  • market crash
  • Markets
  • Michael Zielinski
  • mid-tier
  • mining companies
  • mining stocks
  • mobile client
  • monetization
  • monitter
  • Moving Averages
  • NAK
  • name change
  • NASDQ
  • natural born citizen
  • natural gas
  • Natural Resources
  • New World Order
  • NGC
  • Nouriel Roubini
  • Nuclear Energy
  • Nuclear Weapons
  • Nutrition
  • NWO
  • NXG
  • Oath of Allegiance of the President of the United State
  • obama
  • Occidental College
  • oil
  • Options
  • PAL
  • Paladium
  • PALL
  • palladium
  • pcmag
  • Peter Brimelow
  • Peter Grandich
  • Peter Schiff
  • Peter Spina
  • Phillip Berg
  • physical gold
  • platinum
  • platinum miners
  • pockettweets
  • Politics
  • poser
  • Positive Motivation Prayer Changes Lives
  • PPLT
  • pr
  • precious
  • precious metals
  • Presidential Election
  • price
  • price manipulation
  • prices
  • producers
  • production
  • promote
  • promotion
  • Prophecy
  • protection
  • Proton Beam Therapy
  • psycho-cybenetics
  • psychology
  • Quantitative Easing
  • rare earth metals
  • recession
  • Religion
  • resistance
  • retweetist
  • risk
  • Risk Reversal
  • RT
  • run on banks
  • S&P 500
  • safety
  • Sarah Palin
  • Saudi Arabia
  • Sean Rakhimov
  • search
  • search twitter
  • search.twitter.com
  • security
  • Security Suites
  • SEO
  • Short Bonds
  • Siliver
  • silver
  • silver miners
  • Silver Price Manipulation
  • simpleology
  • SLV
  • SLW
  • small caps
  • socialism
  • Something
  • sovereign
  • Sovereign Debt
  • spot
  • spot price
  • stagflation
  • Stimilus
  • Stimulus
  • stock market
  • Stocks
  • Strategic Metals
  • Strategic Minerals
  • Strategic Resources
  • SWC
  • tag
  • tag and search
  • TARP
  • Technical Analysis
  • Ted Bultler
  • text message
  • The Fed
  • Tier 1
  • Tier 2
  • Tier 3
  • timber
  • tiny url
  • TIPS
  • Today
  • top apps
  • top twenty twitter apps
  • top twitter apps
  • treason
  • Treasury
  • tricks
  • Twapps
  • tweepler
  • tweet
  • tweet from your phone
  • tweetburner
  • tweetdeck
  • Tweeting
  • tweets
  • tweetscan
  • tweetvisor
  • twhirl
  • twibs
  • twidroid
  • twistori
  • twitbin
  • twitdom
  • twitpic
  • twitpoll
  • twitstat
  • Twitter
  • Twitter Fan Wiki
  • twitter for beginners
  • twitterberry
  • twittercounter
  • twitterfall
  • twitterfeed
  • TwitterFox
  • twitterholic
  • twitterific
  • twitterverse
  • twittervision
  • TwitTown
  • twitturly
  • twtpoll
  • U.S.
  • u.s. constitution
  • U.S. Dollar
  • U.S. Government unfunded Debt
  • U.S. Treasury Dept
  • Uncategorized
  • uranium
  • Uranium Miners
  • use @
  • ViSalus
  • volatility
  • voter fraud
  • warrants
  • Water
  • we the people foundation
  • Website
  • Weight Loss
  • Worthy
  • XAU

Meta

  • Register
  • Log in

Blog at WordPress.com.

loading Cancel
Post was not sent - check your email addresses!
Email check failed, please try again
Sorry, your blog cannot share posts by email.
Cancel

 
Loading Comments...
Comment
    ×
    <span>%d</span> bloggers like this: