• Recommended Sites & Links
  • About

Dare Something Worthy Today Too!

~ FreeCryptoBitCoins, Cryptocurrency, BitCoin, Ethereum, BitCoin Cash, Ethereum Classic, LiteCoin, DogeCoin, Gold & Precious Metals, Investing & Investments, Stocks and Stock Markets, Financial Markets & Market Timing, Technical Analysis, Oil and Energy Markets, Hard Assets Investing, BlockChain, Airdrops, Earn Free Bitcoin…

Dare Something Worthy Today Too!

Category Archives: deflation

Gold Supply and Demand + Troubling Questions For Obama

12 Friday Dec 2008

Posted by jschulmansr in 2008 Election, Barack Obama, capitalism, commodities, Copper, Currency and Currencies, deflation, Electoral College, Finance, Free Speech, Fundamental Analysis, gold, hard assets, id theft, inflation, Investing, investments, Markets, mining stocks, oil, Politics, precious metals, Presidential Election, silver, small caps, socialism, Stocks, Technical Analysis, Today, u.s. constitution, U.S. Dollar, Uncategorized

≈ Comments Off on Gold Supply and Demand + Troubling Questions For Obama

Tags

2008 Election, agricultural commodities, alternate energy, Austrian school, banking crisis, banks, Barack Dunham, Barack Hussein Obama, Barack Obama, Barry Dunham, Barry Soetoro, bear market, Bollinger Bands, bull market, capitalism, central banks, Chicago Tribune, China, Columbia University, Comex, commodities, communism, Copper, Currencies, currency, Currency and Currencies, D.c. press club, deflation, depression, diamonds, dollar denominated, dollar denominated investments, economic, economic trends, economy, Electoral College, Electors, Finance, financial, Forex, fraud, Free Speech, futures, futures markets, gold, gold miners, hard assets, Harvard Law School, hawaii, heating oil, id theft, India, Indonesia, Indonesian Citizenship, inflation, Investing, investments, Joe Biden, John McCain, Keith Fitz-Gerald, Latest News, legal documents, market crash, Markets, mining companies, Moving Averages, name change, natural born citizen, natural gas, Oath of Allegiance of the President of the United State, Occidental College, oil, palladium, Peter Schiff, Phillip Berg, physical gold, platinum, platinum miners, Politics, poser, precious metals, Presidential Election, price, price manipulation, prices, producers, production, protection, rare earth metals, recession, risk, run on banks, safety, Sarah Palin, Saudi Arabia, Sean Rakhimov, silver, silver miners, socialism, sovereign, spot, spot price, stagflation, Stocks, Technical Analysis, timber, Today, treason, u.s. constitution, U.S. Dollar, Uncategorized, volatility, voter fraud, warrants, Water, we the people foundation

Gold Supply and Demand

By Luke Burgess of  Gold World

Jesse Lauriston Livermore is perhaps the most famous stock trader of the early 20th century.

Famous for amassing and subsequently losing several multi-million dollar fortunes, Livermore also shorted the stock market heavily during the crashes of 1907 and 1929.

Livermore, who was also known as the Boy Plunger, is famed for making—and losing—several multi-million dollar fortunes and short selling during the stock market crashes in 1907 and 1929.

One of Livermore’s core trading rules was…

Be Right and Sit Tight

It’s simple…

Invest in a growing trend and have the courage to hold long-term for really big gains.

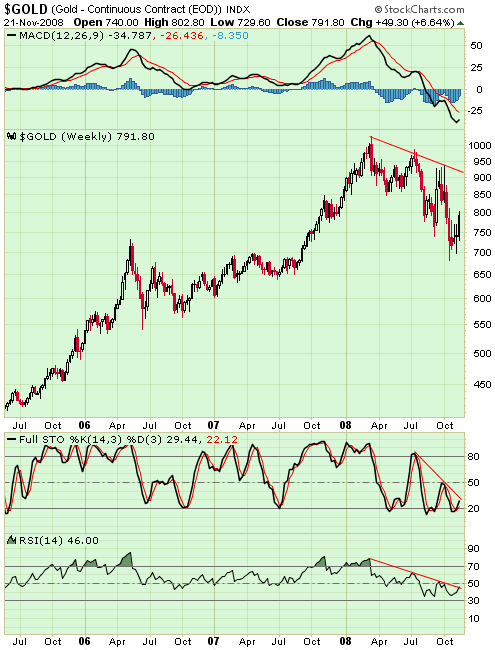
Clearly, the gold bull market is one such growing trend. And investors who “sit tight” will undoutbly see big gains by owning the precious metal now.

Buy Gold Now

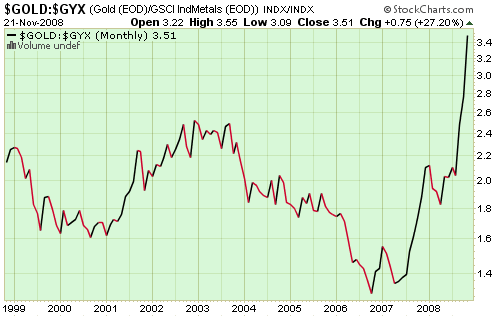
The bull market has already pushed gold prices over 300% higher since 2001. And now with the world’s demand for gold is starting to significantly outpace supplies, even higher prices are on the horizon.

During the third-quarter there was a colossal 10.5 million ounce deficit (worth $8.5 billion) in world’s supply and demand of gold. World gold demand increased over 50% since the second-quarter while supplies dropped 64% year-on-year.

Gold demand, particularly in the investment sector, is currently at all-time highs. But estimates suggest that the world will only produce 76.8 million troy ounces during 2008. This represents a 9% decline in world gold production since 2001.

20081208_world_gold_production.png

Gold Mine Supplies to Continue Falling

The world financial meltdown has forced the shut down of hundreds of gold mines around the world and slashed exploration and development budgets across the board. And the near-term future of new investment still looks pretty grim.

The effects of these budget cutbacks won’t be felt in the gold market for several months to years. But the lack of investment money going into gold mines right now-and probably for over the next several months-will certainly have an effect on global gold supplies in the future.


And the lack of these supplies will positively affect gold prices.

The global economic crisis has motivated miners of all metals to cut back on exploration and development activities. Below is a just partial list of mine closures and delays that have been announced over the past several weeks:

August 21
HudBay Minerals [TSX: HBM] closes its Balmat zinc mine and concentrator.

October 13
Intrepid Mines [TSX: IAU, ASX: IAU] postpones the development of the Mines Casposo gold/silver project.

October 20
Polymetal, Russia’s largest silver miner, cuts its production forecast and says it will consider revising its investment plan for next year.

October 20
First Nickel [TSX: FNI] suspends production at its Lockerby nickel mine.

October 21
Freeport-McMoRan Copper & Gold [NYSE: FCX] announced that the company will defer mine expansions and put off restarting at least one operation.

October 21
North American Palladium [AMEX: PAL, TSX: PDL] temporarily closes its Lac des Iles platinum-group metals mine.

November 6
Thompson Creek Metals [NYSE: TC, TSX: TCM] postpones the development of its Davidson molybdenum mine.

November 10
Rio Tinto [NYSE: RTP, LON: RIO] cut its Australian iron-ore production by about 10%.

November 10
Freeport-McMoRan Copper & Gold [NYSE: FCX] cut molybdenum production at its Henderson mine by 25%.

November 10
Platinum and chrome producer Xstrata Alloys and its South African joint-venture partner, Merafe Resources, temporarily suspends six furnaces of the Xstrata-Merafe chrome venture.

November 11
Arehada Mining [TSX: AHD] temporarily shut down of operations at its zinc/lead/silver mine and plant.

November 11
Frontera Copper [TSX: FCC] suspends mining activities at its Piedras Verdes operation.

November 13
Lundin Mining [NYSE: LMC, TSX: LUN] suspends zinc production from its Neves-Corvo copper/zinc mine, and put another operation, Aljustrel, on care and maintenance until metal prices recover.

November 13
Anvil Mining [TSX: AVM, ASX: AVM] suspends the fabrication and construction works for its Kinsevere Stage II solvent extraction-electrowinning plant.

November 14
Geovic Mining [TSX: GMC] delays construction and financing for its Nkamouna cobalt project.

November 17
Teal Exploration & Mining [TSX: TL] cut output at the Lupoto copper project’s small-scale mining operation

November 18
Stillwater Mining [NYSE: SWC] scales down operations at its East Boulder mine, reduces capital expenditure and cut jobs.

November 18
The world’s third-largest platinum-miner, Lonmin, announces the closure of South African mines, and says it will halt growth projects.

November 19

First Majestic Silver [TSX: FR] temporarily suspends all activities at its Cuitaboca project.

November 19
Weatherly International [LON: WTI] announces the closing two of its copper mining projects in Namibia.

November 20
Hochschild Mining [LON: HOC] announces that the company will delay its San Felipe zinc project.

November 21
Katanga Mining [TSX: KAT] temporarily halts mining operations at the Tilwezembe open pit and ore processing at its Kolwezi concentrator.

Novmeber 21
Apogee Minerals [TSX-V: APE] halts production at its La Solucion silver/lead/zinc mine, in Bolivia.

November 24
Norilsk Nickel put its Waterloo and Silver Swan underground mines into care and maintenance.

November 26
Bindura Nickel announces the closure of two nickel mines, and its smelter and refinery operations.

December 1
The Xstrata-Merafe joint venture suspends operations at another five ferrochrome furnaces, bringing the company’s offline capacity to 906,000 tonnes per year, or more than half of its annual production capability.

December 3
BHP Billiton [NYSE: BHP, ASX: BHP] reduces manganese and alloy production.

December 8
Companhia Vale do Rio Doce, the world’s biggest iron-ore producer, has suspended operations at two pellet plants.

With demand soaring and supplies plummeting, there’s never been a better time to own gold. Gold prices could go to as high as $5,000 once this gold bull market plays out.

Be right and sit tight.

Buy gold.

Good Investing,

Luke Burgess
Managing Editor, Gold World

P.S. It’s simple, really. Demand is soaring. Supplies are plummeting. And if you don’t buy gold now, you may not get the chance to later.

==============================================

Troubling Questions For Obama Team

By: Linda Chavez of GOPUSA

A corruption scandal in President-elect Obama’s backyard is the last thing this country needs. But like it or not, that’s exactly what we have in the unfolding drama of Illinois Gov. Rod Blagojevich’s arrest earlier this week for trying to sell Barack Obama’s Senate seat. The federal prosecutor in the case — Patrick Fitzgerald, the man whose investigation of the Valerie Plame leak case nearly paralyzed the Bush White House for a time — has made it clear that nothing ties Obama directly to the Blagojevich scheme. But the timing of Fitzgerald’s announcement raises some serious questions.

Apparently, Fitzgerald knew that Blagojevich was trolling for bidders for the Obama seat in the waning days of the general election. Before the first votes were counted to elect Obama president, Blagojevich was so confident in Obama’s victory he was already soliciting bids for the seat. And Fitzgerald already had substantial evidence that Blagojevich was engaged in major corruption before the governor put a “for sale” sign on the Senate seat. So why didn’t the federal prosecutor act prior to the election? Had he done so, of course, it could have damaged Obama.

Many would argue that bringing down another Illinois Democrat before the election would have smelled like a dirty trick. The federal prosecutor, after all, was a Republican appointee, and the McCain campaign had already run ads trying to tie Obama to political corruption in Chicago. One of Obama’s early financial supporters, land developer Tony Rezko, was convicted on corruption charges earlier this year, and Rezko figures prominently in the Blagojevich scandal. Had Blagojevich been forced to do a perp walk before Election Day, voters might have asked why Obama had endorsed Blagojevich just two years earlier, considering the governor was at that time under investigation for taking bribes. The endorsement would have been yet another example of Obama’s bad judgment in his associations from Rezko to the Rev. Wright to Bill Ayers.

But even if Fitzgerald acted fairly and prudently by not moving against Blagojevich in the heat of a political campaign, why did he decide to act this week? His explanation was that he was trying to stop “a political corruption crime spree.” Under existing Illinois law, the governor has final authority to appoint someone to fill a vacant U.S. Senate seat and wiretaps suggest Blagojevich was about to do just that. According to the criminal complaint, Blagojevich had found at least one bidder — identified only as Senate Candidate 5 — who offered to raise the governor $500,000 and another $1 million if he got the appointment. Perhaps Fitzgerald simply wanted to go public before Blagojevich sealed the deal.

But there are other possible explanations. Fitzgerald’s hand may have been forced by the Chicago Tribune, which reported Dec. 5 that Blagojevich’s phone lines were being tapped. This information signaled everyone — the governor and anyone talking to the governor or his aides — that they could become ensnared in a huge criminal investigation leading to indictments.

President-elect Obama has emphatically denied that he ever talked to Blagojevich about his Senate replacement. And certainly Fitzgerald has done everything he can to confirm that Obama is not implicated in any way. But there are a number of unanswered questions about what contact members of the president-elect’s team might have had with the governor or his aides, directly or through intermediaries. A number of aides, including the incoming White House Chief of Staff, Rahm Emmanuel, and former campaign leader David Axelrod, have long-standing ties to Blagojevich. And Axelrod has already had to revise his earlier assertion that Obama had spoken with Blagojevich about candidates to replace him in the Senate.

The president-elect has said “I want to gather all the facts about any staff contact that may have taken place. We’ll have those in the next few days and we’ll present them.”

The president-elect’s credibility is on the line. For the good of the country, we must all hope this scandal doesn’t infect anyone in the new administration. The best way to ensure that is for the president-elect and his aides to be forthcoming quickly.

—

Linda Chavez is the author of “An Unlikely Conservative: The Transformation of an Ex-Liberal.”

COPYRIGHT 2008 CREATORS SYNDICATE, INC.

============================================

Chicago Politics Stains Obama 

By: Michael Barone of US News And World Report

I have not seen it recorded whether John F. Kennedy, after he was elected president in 1960, held conversations with Massachusetts Gov. Foster Furcolo as to who would be appointed to fill his seat in the Senate. History does record that Furcolo, just nine days before turning the governorship over to the Republican elected to succeed him, appointed one Benjamin A. Smith II, a college roommate of Kennedy’s and former mayor of Gloucester, who chose not to seek the seat in the next election in 1962, which happened to be the year in which Edward Kennedy turned 30 and was therefore old enough to run for it.

Memory tells me that there was little fuss made of this at the time. Ambassador Joseph P. Kennedy obviously wanted someone appointed to keep the seat warm for Teddy, and so it was done. And Edward Kennedy has turned out to be an able and accomplished senator.

That was a different tableau from the one we have seen unfold in Chicago this past week. Furcolo was an intelligent man, disappointed to have failed to win the state’s other Senate seat and destined not to win elective office again. But he knew that it would not pay to buck the Kennedys.

Rod Blagojevich, the governor who under Illinois statute has the power to appoint a senator to fill out the remaining two years of Barack Obama’s Senate term, is made of different stuff. He was arrested last Tuesday, and the U.S. attorney filed a criminal complaint and made public tapes of Blagojevich seeking personal favors in return for the Senate seat.

Obama denied having conversations with Blagojevich about his choice, though his political strategist David Axelrod said last month that Obama had. Obama declined further comment when asked whether his staff members had discussed the matter with the governor, but he then promised to reveal the details later.

In the ordinary course of things, there would be nothing wrong with such conversations (did Foster Furcolo decide on Benjamin A. Smith II without prompting?). And the construction of the evidence most negative to Obama one can currently make is that someone in Team Obama suggested nominating Obama insider Valerie Jarrett, Blagojevich simply refused or asked for something improper in return and Team Obama promptly broke off communications. Any impropriety in this version was on Blagojevich’s part, not on Obama’s.

Still, these are not headlines the Obama transition team wants. So far, the president-elect has won wide approval for his performance since the election, with poll numbers significantly higher than George W. Bush or Bill Clinton got in their transition periods. His leading foreign, defense and economic appointments have won high praise from all sides, in some cases more from conservatives than liberals. And in a time of financial crisis and foreign threats, he has seemed to keep a clear head and a steady hand.

He has appeared to avoid all but small mistakes, and his theme of unifying the nation — muted perhaps necessarily in the adversary environment of the campaign — has come forth loud and clear.

From all this the Blagojevich scandal is an unwanted distraction. It is a reminder that, for all his inspirational talk of hope and change, Obama, like Blagojevich, are both products of Chicago Democratic politics, which is capable of producing leaders both sublime and sordid.

Obama has not always avoided the latter. For 20 years he attended the church of the Rev. Jeremiah Wright, now thrown under the bus, and for more than a decade engaged in mutually beneficial exchanges political and financial with the political fixer Tony Rezko, now in federal custody.

Blagojevich, never a close political ally, has now been thrown under the bus, too, and seems likely to share Rezko’s fate. Obama fans can point out, truthfully, that other revered presidents had seamy associates and made common cause on their way up with men who turned out to be scoundrels. Franklin Roosevelt happily did business with Chicago Mayor Ed Kelly, though warned that he was skimming off money from federal contracts. John Kennedy no more thought to deny a request from the Mayor Daley of his day than Obama has thought to buck the Mayor Daley of his.

But as Kennedy supposedly said of a redolent Massachusetts politician, “Sometimes party loyalty asks too much.” The man in question was the Democratic nominee for governor and was not elected. Until Patrick Fitzgerald released his tapes, Barack Obama never said the same of Rod Blagojevich.

Obama has profited greatly from his careful climb through Chicago politics. But there is an old saying that in politics nothing is free — there is just some question about when you pay the price. Obama is paying it now.

To read more political analysis by Michael Barone, visit http://www.usnews.com/baroneblog

COPYRIGHT 2008 U.S. NEWS AND WORLD REPORT

DISTRIBUTED BY CREATORS SYNDICATE INC.

Share this:

  • Click to share on Reddit (Opens in new window) Reddit
  • Click to share on Facebook (Opens in new window) Facebook
  • Click to share on LinkedIn (Opens in new window) LinkedIn
  • More
  • Click to share on X (Opens in new window) X
  • Click to share on Pinterest (Opens in new window) Pinterest
  • Click to share on Tumblr (Opens in new window) Tumblr
  • Click to print (Opens in new window) Print
  • Click to email a link to a friend (Opens in new window) Email
Like Loading...

Gold (H)edges Gold Stocks + New CBOE Gold and Silver Options

09 Tuesday Dec 2008

Posted by jschulmansr in capitalism, commodities, Copper, Currency and Currencies, deflation, Finance, Fundamental Analysis, gold, hard assets, inflation, Investing, investments, Latest News, Markets, mining stocks, oil, precious metals, silver, small caps, Stocks, Technical Analysis, U.S. Dollar, Uncategorized, uranium

≈ Comments Off on Gold (H)edges Gold Stocks + New CBOE Gold and Silver Options

Tags

agricultural commodities, alternate energy, Austrian school, banking crisis, banks, bear market, Bollinger Bands, bull market, capitalism, central banks, China, Comex, commodities, communism, Copper, Currencies, currency, deflation, depression, diamonds, dollar denominated, dollar denominated investments, economic, economic trends, economy, financial, Forex, futures, futures markets, gold, gold miners, hard assets, heating oil, India, inflation, investments, Keith Fitz-Gerald, market crash, Markets, mining companies, Moving Averages, natural gas, oil, palladium, Peter Schiff, physical gold, platinum, platinum miners, precious metals, price, price manipulation, prices, producers, production, protection, rare earth metals, recession, risk, run on banks, safety, Saudi Arabia, Sean Rakhimov, silver, silver miners, socialism, sovereign, spot, spot price, stagflation, Technical Analysis, timber, U.S. Dollar, volatility, warrants, Water

Gold (H)edges Gold Stocks – Features and Interviews – Hard Assets Investor

By: Brad Zigler of Hard Assets Investor

This is an excellent teaching article- jschulmansr

I suppose I shouldn’t have been surprised by the number of visitors to the San Francisco Hard Assets Conference who wanted to talk about wrestling the risk of their gold stock investments. After all, 2008 has turned out brutal for gold miners. Witness the AMEX Gold Miners Index off by 46% for the year.

Some of the conferees have been puzzling over their hedging options. And there are plenty of them: options, futures and exchange-traded notes, to name a few. This array leaves many wondering which hedge is optimal.

If you’re pondering that question yourself, you first have to ask yourself just what risk you want to hedge. In a so-called “perfect” hedge, price risk is completely checked, effectively locking in the present value of an asset until the hedge is lifted.

Is that what you really want, though?

A less-than-perfect hedge neutralizes only a portion of the risk subsumed within an investment. Gold stocks, for example, provide exposure to both the gold and equity markets. Hedging a gold stock with an instrument that derives its value solely from gold may dampen the volatility impact of the metal market upon your portfolio, but leaves you with equity risk. This may be perfectly acceptable if you feel stocks in general – and your issues in particular – are likely to appreciate. Hedge out the gold exposure and you’re more likely to see the value that the company’s management adds. If any.

We touched on this subject in recent Desktop columns (see “Gold Hedging: Up Close And Personal” and “More On Hedging Gold Stocks“).

More than one Desktop reader asked why the articles proposed a hedge strategy employing inverse gold exchange-traded notes – namely, the PowerShares DB Gold Double Short ETN (NYSE Arca: DZZ) – instead of stock-based derivatives such as options on the Market Vectors Gold Miners ETF (NYSE Arca: GDX).

Well, we’ve mentioned one of the advantages of a gold-based hedge already, but the question deserves a more detailed answer. Let’s suppose, for illustrative purposes, you hold 1,000 shares of a gold mining issue now trading at $50 and are concerned about future downside volatility. [Note: The prices shown in the illustrations below are derived from actual market values.]

AMEX Gold Miners Index And ETF

The AMEX Gold Miners Index is a modified market-capitalization-weighted benchmark comprised of 33 publicly traded gold and silver mining companies.

While price movements in the index are generally correlated with the fluctuations of its components and other mining issues, the relationship isn’t perfect. Close, but not perfect. The Gold Miners Index represents the market risk, or beta, specific to gold equities. Any hedge that employs an index-based derivative will need to be beta-adjusted to compensate for any differences in the securities’ volatilities.

You have to consider the proper index-based derivative to be used in the hedge. The GDX exchange-traded fund could be shorted, but that would require the use of margin, something that some investors might abhor.

If you’re not put off by margin, you’ll first need to size your hedge. And for that, you’ll need a beta coefficient for your stock. A quick-and-dirty beta can be approximated by taking the quotient of the securities’ volatilities or standard deviations (you can get a stock’s standard deviation through Web sites such as Morningstar and SmartMoney, or you can derive a beta more formally through a spreadsheet program such as Excel).

Gold Stock Volatility ÷ ETF Volatility = 94.8% ÷ 81.8% = 1.16

The ratio tells you how to calculate the dollar size of your hedge. If your stock is trading at $50, your $50,000 position would require $58,000 worth of GDX shares sold short. If GDX is $23 a copy, that means you‘ll need to short 2,522 shares.

Once hedged, you’ll still carry residual risk. The volatility correlation could shift over the life of the trade, leaving you over- or underhedged. So you’ll need to monitor the position for possible adds or subtractions. Hedging is not a “get it and forget it” proposition.

You’ll also need fresh capital to place and maintain the hedge. There’s the initial cash requirement of $29,000 (50% of $58,000) and possibly more if you hold your hedge through significant rises in GDX’s price.

GDX Options

You can avoid margin altogether by using certain GDX options instead of a short sale. Purchasing puts on GDX, for example, gives you open-ended hedge protection against declines in gold equities like a GDX short sale but with a clearly defined and limited risk. There’s no margin required, but you’ll have to pay a cash premium to buy the insurance protection. And, like an insurance contract, the coverage is time-limited.

Let’s say you can purchase a one-month option that permits you to sell 100 GDX shares, at $22 a copy, for a premium of $245. Keep in mind that the put conveys a right, not an obligation. You’re not required to sell GDX shares. At any time before expiration, you can instead sell your put to realize its current value, or you can allow the option to expire if it’s not worth selling.

Just how does the put protect you? Let’s imagine that, just before expiration, GDX shares have fallen to $10. Your put guarantees you the right to sell GDX shares at a price that’s now $12 better than the current market. That’s what your option should be worth: $12 a share, or $1,200. If you sell it now, you’d realize a $955 gain that can be used to offset any concomitant losses on your gold stock.

To figure out how many puts are necessary to fully hedge your stock position, you’ll need to extend the ratio math used previously.

Option prices only move in lockstep with their underlying stocks when they’re “in the money” like the put illustrated above. The expected change in an option premium is expressed in the delta coefficient. If the delta of the $22 put, when GDX is $23, is .40, the option premium is expected to appreciate by 40 cents for every $1 GDX loses.

The arithmetic used to construct the full hedge is:

[Stock Value ÷ (Delta x 100 Shares)] x Beta = [$50,000 ÷ (.40 x 100)] x 1.16 = 1,450 puts

Here’s where the efficacy of the GDX options hedge really breaks down. GDX’s high price volatility has inflated the cost of hedge protection to impractical levels. The hedge would cost $245 x 1,450, or $355,250; much more than the potential loss that would be incurred if you remained unprotected. Clearly, the cost of hedging gold equity market risk, like the cost of insurance after a catastrophe, has been puffed up to protect the insurer.

Of course, you can elect to hedge only a portion of your stock position, but the high premium necessitates a large “deductible” on your market risk.

Wrapping Up

You’ll note that some gold mining issues have options themselves. Using these as hedges in the current market presents another set of problems.

Given that the volatilities for individual issues are higher than that of GDX, the stock contracts are even more expensive than index options. Using stock options, too, would hedge away management alpha. Individual options, as well, are inefficient if you hold multiple mining issues in portfolio.

Now, consider the contrasting benefits attached to using the DZZ double inverse gold notes in your hedge: 1) no overpriced insurance cover, 2) you get to keep your stock’s equity and management risk; you’re only hedging out gold’s volatility, 3) a single purchase can hedge any number of mining issues in portfolio, and 4) your insurance doesn’t expire.

Seems to me that DZZ has the edge.

===============================================

Today’s Grab Bag- Brad Ziegler Hard Assets Investor

Cheaper Oil and Silver + Gold Options 

Real-time Inflation Indicator (per annum): 7.9%

A couple of quick items for your consideration this morning.

Merry New Year from the EIA

The U.S. Energy Information Administration (EIA) has issued its monthly short-term forecasts for oil prices. In the words of this little corner of sunshine in the Department of Energy:

 “The current global economic slowdown is now projected to be more severe and longer than in last month’s Outlook, leading to further reductions of global energy demand and additional declines in crude oil and other energy prices.”

The EIA has set an average price forecast for West Texas Intermediate (WTI) crude oil at $100 per barrel. That’s the average for all of 2008. Keep in mind that, year-to-date, WTI has traded at an average barrel price of about $104. Now, we’ve only got 15 trading days left in 2008. To bring the current average price down $4 in that time, the sell-off pace has to quicken some.

In essence, the EIA – if you put any faith in its forecasts – is telling you to short oil. And this while the quarterly NYMEX oil contango has ballooned to a record $7.21 a barrel (need background on contango? See “Oil Demand Perking Or Peaking?”).

 NYMEX Crude Oil Quarterly Contango 

NYMEX Crude Oil Quarterly Contango

Back in November, the EIA eyed a $112 average price for 2008. Do I need to tell you that they missed the mark on that one?

Looking ahead, the EIA thinks WTI crude will average $51 a barrel in 2009.

Never let it be said that your stingy government didn’t give you something for the holidays.

And now, ladies and gentlemen, SLV options

Frustrated that you haven’t been able to play your favorite option trades in the silver market? Be vexed no longer. The Chicago Board Options Exchange (CBOE) has come to your rescue. Yesterday, CBOE launched option trading on two metals grantor trusts, the iShares COMEX Gold Trust (NYSE Arca: IAU) and the iShares Silver Trust (NYSE Arca: SLV). Both trusts hold physical metals.

This is both a first and a “two-fer” for the options bourse. Back in June, CBOE inaugurated trading in the SPDR Gold Shares Trust (NYSE Arca: GLD); options on a silver grantor trust haven’t been traded on an organized exchange before.

The American-style options will trade on the January expiration cycle, initially with contracts maturing in December, January, April and July.

Share this:

  • Click to share on Reddit (Opens in new window) Reddit
  • Click to share on Facebook (Opens in new window) Facebook
  • Click to share on LinkedIn (Opens in new window) LinkedIn
  • More
  • Click to share on X (Opens in new window) X
  • Click to share on Pinterest (Opens in new window) Pinterest
  • Click to share on Tumblr (Opens in new window) Tumblr
  • Click to print (Opens in new window) Print
  • Click to email a link to a friend (Opens in new window) Email
Like Loading...

Time to Revise Our Gold Expectations – Seeking Alpha

08 Monday Dec 2008

Posted by jschulmansr in Bollinger Bands, capitalism, commodities, Copper, Currency and Currencies, deflation, Finance, Fundamental Analysis, gold, hard assets, Investing, investments, Latest News, Markets, mining stocks, precious metals, silver, small caps, Stocks, Technical Analysis, Today, U.S. Dollar, uranium

≈ Comments Off on Time to Revise Our Gold Expectations – Seeking Alpha

Tags

agricultural commodities, alternate energy, Austrian school, banking crisis, banks, bear market, Bollinger Bands, bull market, capitalism, central banks, China, Comex, commodities, communism, Copper, Currencies, currency, deflation, depression, diamonds, dollar denominated, dollar denominated investments, economic, economic trends, economy, financial, Forex, futures, futures markets, gold, gold miners, hard assets, heating oil, India, inflation, investments, Keith Fitz-Gerald, market crash, Markets, mining companies, Moving Averages, natural gas, oil, palladium, Peter Schiff, physical gold, platinum, platinum miners, precious metals, price, price manipulation, prices, producers, production, protection, rare earth metals, recession, risk, run on banks, safety, Saudi Arabia, Sean Rakhimov, silver, silver miners, socialism, sovereign, spot, spot price, stagflation, Technical Analysis, timber, U.S. Dollar, volatility, warrants, Water

Time to Revise Our Gold Expectations – Seeking Alpha

Source: FP Trading Desk

The price of gold is showing signs of stability after gold stocks got crushed in the commodity sell-off early this fall. However, we are clearly not in the $1000-plus gold price environment many had anticipated under these dire economic conditions, nor have traditional multiples returned, says Credit Suisse analyst Anita Soni.

Apart from a brief period earlier this year, when gold hit an all-time high above $1030 an ounce, the yellow metal has not performed true to course. The first quarter advance proved to be a bubble with large-scale institutional speculators driving the price sharply higher… and then sharply lower over the next seven months, according to Jeffrey Nichols, managing director at American Precious Metals Advisors.

Mr. Nichols told the China Gold & Precious Metals Summit in Shanghai on Thursday:

In spite of the lack of direction and day-to-day price volatility in the gold market this year, at least we can say that no other asset class has held its value quite so well.

“Clearly the standard 1 to 2 times price-to-net asset value [NAV] paradigm no longer applies, particularly for the more junior stocks,” Ms. Soni said in a research note, adding that exposure to base metal by-products is no longer a guarantee of lower cash costs. For senior producers, P/NAV multiples are around 0.5 times, while they range for 0.66x for mid-tier names and as much as 1x for small market cap companies.

Until longer-term valuation fundamentals matter again, Ms. Soni believes she has determined an appropriate near-term basis for valuing gold equities. It uses spot commodity prices plus 10% to determine net asset values: $850 per ounce for gold, $10.50 for silver, $1.80 per pound of copper and $0.58 for zinc.

This produces returns between 30% and 60%, which she considers a reasonable near-term basis for valuation until gold moves upward again. Ms. Soni has also produced target prices and net asset values for the long term, with an extra 10% for gold again, or $930, a level she said is “imminently achievable.”

As a result of these changes, Credit Suisse has upgraded its rating on Kinross Gold Corp. (KGC) to “outperform,” while Yamana Gold Inc. (AUY) and Northgate Minerals Corp. (NXG) have been downgraded to “neutral.” Target price reductions for the miners it covers range from 18% to 80%.

“The issues in the mid-tier space are those of operational risk and to a lesser extent, the spectre of potential funding shortfall,” Ms. Soni said. Yamana’s recent production and cost revisions have not been well-received, sending its share price multiple from near-senior levels to the discounted mid-tier level.

She cited several other near-term issues that could weigh on the stock. Its production ramp-up will likely be slower than expected and the market may show a lack of patience with this.

Yamana’s capital program funding could get very tight if current market conditions and commodity prices persist, which may make it very hard for the company to resist issuing equity given the success Agnico-Eagle Mines Ltd. (AEM) and Red Back Mining Inc. (RBIFF.PK) have had with their recent financings.

Cut-backs to preserve capital will hurt its value in terms of adding exploration and growth opportunities, and Yamana currently has significant exposure to copper.

And while Ms. Soni suggested that Yamana is perhaps the best candidate for a takeover given its low valuation and a few very good assets, particularly El Penon in Chile, she says this is not enough to recommend it as an “outperform.”

Share this:

  • Click to share on Reddit (Opens in new window) Reddit
  • Click to share on Facebook (Opens in new window) Facebook
  • Click to share on LinkedIn (Opens in new window) LinkedIn
  • More
  • Click to share on X (Opens in new window) X
  • Click to share on Pinterest (Opens in new window) Pinterest
  • Click to share on Tumblr (Opens in new window) Tumblr
  • Click to print (Opens in new window) Print
  • Click to email a link to a friend (Opens in new window) Email
Like Loading...

GoldMoney – Alert!

02 Tuesday Dec 2008

Posted by jschulmansr in Bollinger Bands, capitalism, commodities, Copper, Currency and Currencies, deflation, Finance, Fundamental Analysis, gold, inflation, Investing, investments, Latest News, Markets, mining stocks, Moving Averages, oil, precious, precious metals, silver, Stocks, Technical Analysis, Today, U.S. Dollar, Uncategorized

≈ 1 Comment

Tags

agricultural commodities, alternate energy, Austrian school, banking crisis, banks, bear market, Bollinger Bands, bull market, capitalism, central banks, China, Comex, commodities, communism, Copper, Currencies, currency, deflation, depression, diamonds, dollar denominated, dollar denominated investments, economic, economic trends, economy, financial, Forex, futures, futures markets, gold, gold miners, hard assets, heating oil, India, inflation, investments, James Turk, Keith Fitz-Gerald, market crash, Markets, mining companies, Moving Averages, natural gas, oil, palladium, Peter Schiff, physical gold, platinum, platinum miners, precious metals, price, price manipulation, prices, producers, production, protection, rare earth metals, recession, risk, run on banks, safety, Saudi Arabia, silver, silver miners, socialism, sovereign, spot, spot price, stagflation, Technical Analysis, timber, U.S. Dollar, volatility, warrants, Water

GoldMoney – Alert!

James Turk

A Successful Test of Support

In the last alert I referred to “the growing body of evidence” indicating that “the correction in gold that began after making a new record high in March above $1020 is ending.” Importantly, this point is confirmed by the following monthly chart presenting gold’s rate of exchange against the US dollar.

To explain this key development in technical terms, after making a new record high this past March, gold retraced back toward its previous record (marked in the above chart by the dashed line). Gold did the same thing back in 1978 after breaking above $200 in July that year (marked by the red circle), its previous record high. Gold climbed another 17% through October 1978, and then corrected the following month by testing $200. Support at that level held.

From there gold never looked back. It began a stellar advance that took it to $681.50, its month-end close in January 1980, the level that was just successfully tested.

The big difference between now and back then is the time needed to re-test support. The correction lasted only one month in 1978, but is now already eight months old. There are a number of reasons for this different result, but one is not the gold cartel. It was active back in the late 1970s too, dishoarding 775 tonnes from the International Monetary Fund in a vain and useless attempt to make the dollar look better by trying to cap the gold price.

The clear conclusion is that governments, even when they coordinate their effort, cannot in the end stop the market from bidding up the price of gold. So it is logical to expect a new record high for gold soon against the US dollar. It is noteworthy that gold closed this past month at new record highs against the British pound, Canadian dollar, Indian rupee and South African rand.

The driving force to exit national currencies and to buy gold is the same now as it was in the 1970s. Gold is better money than national currencies.


Published by GoldMoney
Copyright © 2008. All rights reserved.
Edited by James Turk, alert@goldmoney.com

Share this:

  • Click to share on Reddit (Opens in new window) Reddit
  • Click to share on Facebook (Opens in new window) Facebook
  • Click to share on LinkedIn (Opens in new window) LinkedIn
  • More
  • Click to share on X (Opens in new window) X
  • Click to share on Pinterest (Opens in new window) Pinterest
  • Click to share on Tumblr (Opens in new window) Tumblr
  • Click to print (Opens in new window) Print
  • Click to email a link to a friend (Opens in new window) Email
Like Loading...

Don’t Give Up on Gold Just Yet!+ Peter Schiff Bonus!

02 Tuesday Dec 2008

Posted by jschulmansr in capitalism, commodities, Copper, Currency and Currencies, deflation, Finance, Fundamental Analysis, gold, hard assets, inflation, Investing, investments, Latest News, Markets, mining stocks, Moving Averages, oil, precious metals, silver, Stocks, Technical Analysis, Today, U.S. Dollar, Uncategorized

≈ Comments Off on Don’t Give Up on Gold Just Yet!+ Peter Schiff Bonus!

Tags

agricultural commodities, alternate energy, Austrian school, banking crisis, banks, bear market, Bollinger Bands, bull market, capitalism, central banks, China, Comex, commodities, communism, Copper, Currencies, currency, deflation, depression, diamonds, dollar denominated, dollar denominated investments, economic, economic trends, economy, financial, Forex, futures, futures markets, gold, gold miners, hard assets, heating oil, India, inflation, investments, Keith Fitz-Gerald, market crash, Markets, mining companies, Moving Averages, natural gas, oil, palladium, Peter Schiff, physical gold, platinum, platinum miners, precious metals, price, price manipulation, prices, producers, production, protection, rare earth metals, recession, risk, run on banks, safety, Saudi Arabia, silver, silver miners, socialism, sovereign, spot, spot price, stagflation, Technical Analysis, timber, U.S. Dollar, volatility, warrants, Water

Don’t Give Up on Gold Just Yet – Seeking Alpha

By: Keith Fitz-Gerald of Monday Morning

If you were counting on gold to boost your returns this year, chances are you’ve been cruelly disappointed. In fact, when it comes to gold-related investments, virtually every category is down, making this one of the worst years in history for gold investors.

So, why is it that the largest of the large futures traders have some of the lowest net short positions in years? And what does this tell us about gold prices in the near future?

I’ll get to that in a minute. But first …

What Went Wrong?

In my analysis, I’ve identified the three missteps most investors made. First, investors did what they’d been told to do. But in their panic, they flocked to gold on the assumption that the yellow metal would perform as advertised. They forgot the “safety first” strategy that we’ve emphasized this year – one that included a safer, more-conservative way of buying gold.

Strike one.

Adding insult to injury, very few investors (Money Morning readers aside) failed to understand that the massive “de-leveraging” process that’s been part and parcel of the global financial crisis would put downward pressure on virtually every asset class at the same time. And that includes gold. As we’ve seen in the last few months, during times of global panic, investors around the world want the safety of U.S. dollars – and a lot of them – even more than they want gold right now.

Strike two.

But, above all else, most investors failed to realize that gold, just like any other asset, produces the best returns when it is attractively priced. So most investors made the classic mistake of piling in on the basis of performance. In other words, they bought in at the top.
Strike three.

What’s Changed?

During times of crisis, investors have been taught to latch onto those asset classes with the highest relative stability – including gold and precious metals. More often than not, investors who have followed these time-proven practices have been handsomely rewarded for doing so.

This time around, however, the parameters have changed, as the increased use of such “derivative” securities as “credit default swaps” has exacerbated the fallout from the global financial crisis, and touched off the aforementioned de-leveraging process. As asset markets have melted down, hedge funds, financial institutions worldwide, and even government-controlled sovereign wealth funds have taken heavy losses, forcing them to deal with unprecedented margin calls and redemption requests. Because this has never before been part of their crisis-management process, institutional investors have engaged in a massive, concerted effort to sell anything that’s at all liquid – including gold.

Making matters worse, the so-called “carry trade” unwound with a vengeance, forcing offshore investors to buy U.S. dollars in order to offset the sell-off of dollar-denominated assets. In contrast to what you’re hearing on the news, this really is not a sign that the dollar is any stronger than other currencies. Instead it signifies that the greenback is still the global currency of choice – much to the chagrin of Russia, Venezuela and others who begrudgingly tie themselves to it.

It also highlights something that most investors forget, or perhaps never knew in the first place. For better or worse, the dollar is the most liquid of the world’s reserve currencies. Part of that’s because many assets – especially oil – are still predominately traded in dollars.

The problem is that the dollar’s healthy appearance may be just that – an appearance that covers up an inner ill health. These still-hidden maladies have been worsened by the recent machinations of “Bailout Ben” – U.S. Federal Reserve Chairman Ben S. Bernanke – and U.S. Treasury Secretary Henry M. “Hank” Paulson Jr., whose fix-it programs have created a financial Frankenstein that will chase American taxpayers for years.

When the dollar was rallying back in May, and many experts were lauding the move as a turnaround in the making for the long-languishing U.S. currency, we warned investors not to be taken in by the market’s head fake. There were just too many underlying problems for the dollar’s rally to be sustainable. Ultimately, that rally sputtered, and the dollar reversed course and continued its decline.

This time, we again suspect that the dollar is rising too far too fast and that the spike we’ve seen in recent months may be nothing more than a flameout in the making.

However, given the relationship between the greenback and the yellow metal, this leads us to believe that gold could move higher next year if investors lose faith that the dollar merits their nearly exclusive attention right now.

Two pieces of closely related information appear to support this theory:

First, even though gold prices have tanked – a reality that under ordinary circumstances would mean more supply is available – dealers of gold bullion have experienced widespread physical shortages during the third quarter, according to the World Gold Council, a top trade association for the gold-mining industry. That, in turn, led dealers to both charge more and pay more than the spot price would indicate. Particularly strong demand was noted in China, India and the Middle East.

According to a Nov. 19 press release, the World Gold Council also noted that identifiable investment demand for gold in the third quarter was up $10.7 billion to 382 tons – double the levels of a year ago. At the same time, retail investment demand rose 121% to 232 tons, with especially for gold bars and gold coins reported in the Swiss, German and U.S. markets.

At the same time, the SPDR Gold Trust (GLD) – the largest exchange-traded fund (ETF) that invests in the yellow metal – noted that it now holds 755.06 tons of gold in trust, up 6.12 tons from the prior week. This is significant because authorized market participants like GLD have to add metal and increase their trading float when buying pressure is higher than selling pressure. This suggests that gold may be reaching the end of its downside run and that it may behave more like investors expect it to in the months ahead.

Second, we find it especially interesting that the largest of the commercial futures traders now hold the smallest net short positions they have held in several years. According to the U.S. Commodities Futures Trading Commission (CFTC), large commercial traders combined net short positions reflect only 71,116 contracts net short, one of the lowest net short positions the CFTC has reported since January 2006.

Historically, low net short positions have proven to be bullish influences. And net short levels of less than 30% total open interest have proven to be especially bullish.

The wild card here, of course, is that the markets are working through a de-leveraging process that’s far from over, meaning that normal supply and demand relationships are out of whack. Longer-term, however, everything we know about those relationships still appears to be intact.

That’s why we suggest that investors make gold a part of their investment program – if for no other reason than we are approaching levels typically associated with higher, rather than lower, returns.

But we can’t just pile in.

Short-term market conditions will transform anything other than a measured approach into a hazardous foray.

That’s why, when it comes to gold, we’ve repeatedly recited the market mantra: “Gold works over time, but not all the time.” [For insights on actual gold-investing strategies, check out the Money Morning special investment research report, “The Best Way to Use Gold to Protect Your Portfolio and Profit.” The report is free of charge.]

[Editor’s Note: Money Morning Investment Director Keith Fitz-Gerald is one of the top investment commentators in the global marketplace today. A noted columnist and a highly sought after speaker, Fitz-Gerald is also a gifted forecaster. Indeed, he’s especially distinguished himself during the current financial crisis, having told investors to expect historic levels of market volatility and having accurately predicted such crisis “aftershocks” as the big spike in energy and commodity prices that took place earlier this year. A new Money Morning report identifies five such aftershocks that are still to come, and explains how savvy investors can employ such “trigger events” as potential gateways to major profits. To read this report, which details all five of the aftershocks to expect, please click here. And don’t forget to check out Fitz-Gerald’s recently published 2009 stock market forecast, part of Money Morning’s ongoing “Outlook 2009” economic forecast series.]

=====================================================

Dare Something Worthy Today Too! Bonus! Peter Schiff

Peter Schiff Was Right!

Peter Schiff Analogies


$2000 Gold in 2009 says Peter Schiff

Share this:

  • Click to share on Reddit (Opens in new window) Reddit
  • Click to share on Facebook (Opens in new window) Facebook
  • Click to share on LinkedIn (Opens in new window) LinkedIn
  • More
  • Click to share on X (Opens in new window) X
  • Click to share on Pinterest (Opens in new window) Pinterest
  • Click to share on Tumblr (Opens in new window) Tumblr
  • Click to print (Opens in new window) Print
  • Click to email a link to a friend (Opens in new window) Email
Like Loading...

Golden Choice For Bailout Inflation Protection – Forbes.com

28 Friday Nov 2008

Posted by jschulmansr in Bollinger Bands, capitalism, commodities, Copper, Currency and Currencies, deflation, Finance, gold, hard assets, inflation, Investing, investments, Latest News, Markets, mining stocks, Moving Averages, oil, precious metals, silver, small caps, Stocks, Technical Analysis, Today, U.S. Dollar, Uncategorized

≈ 1 Comment

Tags

agricultural commodities, alternate energy, Austrian school, banking crisis, banks, bear market, Bollinger Bands, bull market, capitalism, central banks, China, Comex, commodities, communism, Copper, Currencies, currency, deflation, depression, diamonds, dollar denominated, dollar denominated investments, economic, economic trends, economy, financial, Forex, futures, futures markets, gold, gold miners, hard assets, heating oil, India, inflation, investments, market crash, Markets, mining companies, Moving Averages, natural gas, oil, palladium, physical gold, platinum, platinum miners, precious metals, price, price manipulation, prices, producers, production, protection, rare earth metals, recession, risk, run on banks, safety, Saudi Arabia, silver, silver miners, socialism, sovereign, spot, spot price, stagflation, Technical Analysis, timber, U.S. Dollar, volatility, warrants, Water

Golden Choice For Bailout Inflation Protection – Forbes.com

John Dobosz, 11.26.08, 11:50 AM EST

Gold and gold miners have taken flight in recent days as the world begins to focus on an inflationary future.

Since the problems associated with the current financial crisis began to take on a particular menace last summer, the response of our monetary institutions has involved moves that most students of economics would call inflationary, like aggressive reduction in targeted short-term lending rates and credit creation at a feverish pace.

Thanks to the deflationary forces that accompanied the unwinding of leverage in the financial system and in the flagging economy at large, the dollar actually rallied and gold suffered big time. From a post Jimmy Carter high of $1,011 in March, spot gold tumbled 30% down to $712 an ounce.

Now, however, investors seem to be awakening to the inflationary impact of the moves by the Federal Reserve and the Treasury Department. Over the past three weeks, gold has staged a rally, and over just the past week, it has looked more like a lift-off. Spot gold was above $830 for much of this holiday-shortened trading week, a gain of more than 15% from lows earlier this month, with most of that coming just since Thursday.

Moving higher more rapidly than gold bullion itself are shares of gold miners. The Philadelphia Gold and Silver Mining Index (XAU) added nearly 43% in just the past three days. This could indicate simply that the miners were more deeply oversold, or, if it persists, it could mean that investors are looking for escalating gold prices down the line. Either way, it looks like gold and the miners are staging a decent rally that could last until the first quarter of next year, according to Curt Hesler, editor of Professional Timing Service.

Hesler has several mining stocks that he likes for playing the new buoyancy in gold shares, from blue chips like Goldcorp (nyse: (GG) – news – people ) to smaller names like Yamana Gold (nyse: (AUY) – news – people ) and the tiny like US Gold Corp. (amex: (UXG) – news – people ). For smaller investors, perhaps it’s best to buy a basket of miners and jump on the train.

A great way to get into gold miners is through the Fidelity Select Gold (FSAGX) fund, a diversified grab bag that holds a small amount of gold bullion and a long roster of mining companies. Its biggest holdings are in Barrick Gold (nyse: (ABX) – news – people ), Goldcorp and Newmont Mining (nyse: (NEM) – news – people ) and Agnico Eagle (nyse: (AEM) – news – people ).

The expense ratio of FSAGX is one of the things to like most about this fund. At 0.81% it’s nearly half the 1.47% charged by most precious metals funds. Another nice feature is that it trades throughout the day, and you can get in and out when you like and even use limit orders when buying.

Lately the fund has been volatile, but it’s going in the right direction for the bulls. It’s up 40% in the past month. Of course, prior to that, it lost half of its value from late September through late October, overshooting even the steep correction in gold. Many advisers recommend an allocation of 5% to 10% in your portfolio to inflation hedges, like gold.

Click here to sign up to receive Stock of the Week next Monday morning.

Share this:

  • Click to share on Reddit (Opens in new window) Reddit
  • Click to share on Facebook (Opens in new window) Facebook
  • Click to share on LinkedIn (Opens in new window) LinkedIn
  • More
  • Click to share on X (Opens in new window) X
  • Click to share on Pinterest (Opens in new window) Pinterest
  • Click to share on Tumblr (Opens in new window) Tumblr
  • Click to print (Opens in new window) Print
  • Click to email a link to a friend (Opens in new window) Email
Like Loading...

Ten investing rules that will help you weather this stormy market – MarketWatch

28 Friday Nov 2008

Posted by jschulmansr in capitalism, commodities, Currency and Currencies, deflation, Finance, Fundamental Analysis, gold, inflation, Investing, investments, Latest News, Markets, mining stocks, Moving Averages, precious metals, small caps, Stocks, Technical Analysis, Today, U.S. Dollar, Uncategorized

≈ Comments Off on Ten investing rules that will help you weather this stormy market – MarketWatch

Tags

10 Rules of Investing, agricultural commodities, alternate energy, Austrian school, banking crisis, banks, bear market, Bollinger Bands, bull market, capitalism, central banks, China, Comex, commodities, communism, Copper, Currencies, currency, deflation, depression, diamonds, dollar denominated, dollar denominated investments, economic, economic trends, economy, financial, Forex, futures, futures markets, gold, gold miners, hard assets, heating oil, India, inflation, investments, market crash, Markets, mining companies, Moving Averages, natural gas, oil, palladium, physical gold, platinum, platinum miners, precious metals, price, price manipulation, prices, producers, production, protection, rare earth metals, recession, risk, run on banks, safety, Saudi Arabia, silver, silver miners, socialism, sovereign, spot, spot price, stagflation, Technical Analysis, timber, U.S. Dollar, volatility, warrants, Water

Ten investing rules that will help you weather this stormy market – MarketWatch

By Jonathan Burton, MarketWatch

LIFE SAVINGS

Learn a lesson — before you get one

Ten rules to remember about investing in the stock market

Especially now. Investment rules are tailor-made for tough times, allowing you to stick to a plan just when you need it most. Indeed, a rulebook is important in any market climate, but it tends to get tossed when stocks are soaring. That’s why sage investors warn people not to confuse a bull market with brains.
So with the economy looking more and more like the oil-shocked, stagflation-strapped 1970s, and stocks recoiling from rising unemployment, record energy prices and falling home values, it makes sense to dust off the old playbook and see how it applies today.
One of the most relevant lists of rules, from a legendary Wall Street veteran, is also among the least known. Beginning in the late 1950s, Bob Farrell pioneered technical analysis, which rates a stock not only on a company’s financial strength or business line but also on the strong patterns and line charts reflected in the shares’ trading history. Farrell also broke new ground using investor sentiment figures to better understand how markets and individual stocks might move.
Over several decades at brokerage giant Merrill Lynch & Co., Farrell had a front-row seat to the go-go markets of the late 1960s, mid-1980s and late 1990s, the brutal bear market of 1973-74, and October 1987’s crash. Out of those and other experiences came Farrell’s 10 “Market Rules to Remember.”
These days, Farrell lives in Florida, and efforts to contact him were unsuccessful. Still, the following rules he advocated resonate during volatile markets such as this:
1. Markets tend to return to the mean over time…
By “return to the mean,” Farrell means that when stocks go too far in one direction, they come back. If that sounds elementary, then remember that both euphoric and pessimistic markets can cloud people’s heads.
“It’s so easy to get caught up in the heat of the moment and not have perspective,” says Bob Doll, global chief investment officer for equities at money manager BlackRock Inc. “Those that have a plan and stick to it tend to be more successful.”
2. Excesses in one direction will lead to an opposite excess in the other direction…
Think of the market as a constant dieter who struggles to stay within a desired weight range but can’t always hit the mark.
“In the 1990s when we were advancing by 20% per year, we were heading for disappointment,” says Sam Stovall, chief investment strategist at Standard & Poor’s Inc. “Sooner or later, you pay it back.”
3. There are no new eras — excesses are never permanent…
This harkens to the first two rules. Many investors try to find the latest hot sector, and soon a fever builds that “this time it’s different.” Of course, it never really is. When that sector cools, individual shareholders are usually among the last to know and are forced to sell at lower prices.
“It’s so hard to switch and time the changes from one sector to another,” says John Buckingham, editor of The Prudent Speculator newsletter. “Find a strategy that you believe in and stay put.”
4. Exponential rapidly rising or falling markets usually go further than you think, but they do not correct by going sideways…
This is Farrell’s way of saying that a popular sector can stay hot for a long while, but will fall hard when a correction comes. Chinese stocks not long ago were market darlings posting parabolic gains, but investors who came late to this party have been sorry.
5. The public buys the most at the top and the least at the bottom…
Sure, and if they didn’t, contrarian-minded investors would have nothing to crow about. Accordingly, many market technicians use sentiment indicators to gauge investor pessimism or optimism, then recommend that investors head in the opposite direction.
Some closely watched indicators have been mixed lately. At Investors Intelligence, an investment service that measures the mood of more than 100 investment newsletter writers, bullish sentiment rose last week to 44.8% from 37.9% the week before. Bearish sentiment slipped to 31.1% from 32.2%. Meanwhile, the American Association of Individual Investors survey was less positive, with bearish sentiment at 45.8% and bulls at 31.4% .
Learn a lesson — before you get one!
6. Fear and greed are stronger than long-term resolve…
Investors can be their own worst enemy, particularly when emotions take hold.
Stock market gains “make us exuberant; they enhance well-being and promote optimism,” says Meir Statman, a finance professor at Santa Clara University in California who studies investor behavior. “Losses bring sadness, disgust, fear, regret. Fear increases the sense of risk and some react by shunning stocks.”
After grim trading days like Friday’s nearly 400-point tumble, coming after months of downward pressure on stocks, it’s easy to think you’re the patsy at this card table. To counter those insecure feelings, practice self-control and keep long-range portfolio goals in perspective. That will help you to be proactive instead of reactive.
“It’s critical for investors to understand how they’re cut,” says the Prudent Speculator’s Buckingham. “If you can’t handle a 15% or 20% downturn, you need to rethink how you invest.”
7. Markets are strongest when they are broad and weakest when they narrow to a handful of blue-chip names…
Markets and individual sectors can move in powerful waves that take all boats up or down in their wake. There’s strength in numbers, and such broad momentum is hard to stop, Farrell observes. In these conditions you either lead, follow or get out of the way.
When momentum channels into a small number of stocks, it means that many worthy companies are being overlooked and investors essentially are crowding one side of the boat. That’s what happened with the “Nifty 50” stocks of the early 1970s, when much of the U.S. market’s gains came from the 50 biggest companies on the New York Stock Exchange. As their price-to-earnings ratios climbed to unsustainable levels, these “one-decision” stocks eventually sunk.
Chart of SPX
8. Bear markets have three stages — sharp down, reflexive rebound and a drawn-out fundamental downtrend…
Is this a bear market? That depends on where you draw the starting line. With Friday’s close, the S&P 500 Index (SPX):
(SPX) 896.24, +8.56, +1.0%) is down 13.1% since its October 9 peak. Not the 20%-plus decline that typically marks a bear, but a vicious encounter nonetheless.
Where are we now? A chart of the S&P 500 shows a couple of sharp downs and subsequent rebounds in the past six months, with a tighter trading range since April. It remains to be seen if we can avoid a tortured period of the kind seen from 2000 to 2002, when sporadic rallies couldn’t snap a slow, protracted decline.
9. When all the experts and forecasts agree — something else is going to happen…
As Stovall, the S&P investment strategist, puts it: “If everybody’s optimistic, who is left to buy? If everybody’s pessimistic, who’s left to sell?”
Going against the herd as Farrell repeatedly suggests can be very profitable, especially for patient buyers who raise cash from frothy markets and reinvest it when sentiment is darkest.
10. Bull markets are more fun than bear markets (unless you are shorting the markets)…
No kidding!
DARE SOMETHING WORTHY TODAY TOO! Bonus: Top Performing Precious Metals Mutual Funds
TOP PERFORMING PRECIOUS METALS FUNDS
FUND 1-Month
Return
1-Year
Return
3-Year
Return
ProFunds Precious Metals (PMPIX)

42.6%

-68.8

-21.6%

Fidelity Select Gold (FSAGX)

35.4

-42.4

0.5

American Century Global Gold (BGEIX)

34.8

-48.5

-4.2

OCM Gold Fund (OCMGX)

34.1

-45.6

1.4

Evergreen Precious Metals (EKWBX)
32.5

-43.5

2.4

Franklin Gold and Precious Metals (FKRCX)

32.0

-50.6

-2.6

Van Eck Intl Investors Gold (INIVX)

31.9

-49.4

2.3

USAA Precious Metals & Minerals (USAGX)

31.6

-47.4

3.0

GAMCO Gold AAA (GOLDX)

31.6

-48.6

-1.4

DWS Gold & Precious Metals (SCGDX)

31.1

-49.8

-3.5


Through 11/24/08. Source: Morningstar.com


Share this:

  • Click to share on Reddit (Opens in new window) Reddit
  • Click to share on Facebook (Opens in new window) Facebook
  • Click to share on LinkedIn (Opens in new window) LinkedIn
  • More
  • Click to share on X (Opens in new window) X
  • Click to share on Pinterest (Opens in new window) Pinterest
  • Click to share on Tumblr (Opens in new window) Tumblr
  • Click to print (Opens in new window) Print
  • Click to email a link to a friend (Opens in new window) Email
Like Loading...

Smart Money Is Starting to Pour into Gold Stocks- Seeking Alpha

24 Monday Nov 2008

Posted by jschulmansr in commodities, Copper, Currency and Currencies, deflation, Finance, gold, hard assets, inflation, Investing, investments, Latest News, Markets, mining stocks, precious metals, silver, U.S. Dollar, Uncategorized

≈ 1 Comment

Tags

agricultural commodities, alternate energy, Austrian school, banking crisis, banks, bear market, Bollinger Bands, bull market, capitalism, central banks, China, Comex, commodities, communism, Copper, Currencies, currency, deflation, depression, diamonds, dollar denominated, dollar denominated investments, economic, economic trends, economy, financial, Forex, futures, futures markets, gold, gold miners, hard assets, heating oil, India, inflation, investments, market crash, Markets, mining companies, Moving Averages, natural gas, oil, palladium, physical gold, platinum, platinum miners, precious metals, price, price manipulation, prices, producers, production, protection, rare earth metals, recession, risk, run on banks, safety, Saudi Arabia, silver, silver miners, socialism, sovereign, spot, spot price, stagflation, Technical Analysis, timber, U.S. Dollar, volatility, warrants, Water

Smart Money Is Starting to Pour into Gold Stocks- Seeking Alpha 

By: Boris Sobolev of Resource Stock Guide.com

In our last update, we expected short term weakness in gold followed by an upward reversal.

In the short term, in order to avoid seeing gold close below $700, it must move above resistances of $780-810 relatively quickly and stabilize close to that range.

And we got exactly what was needed, although the metal is yet to stabilize near the $800s. Gold briefly touched $699, making a higher low, and continued to consolidate between $720 and $750. On Friday, gold spiked 57 points or almost 8% to its first resistance of $800.

While there is some resistance near $825-$850 for the short term, the weekly chart for gold is starting to look promising. But before the downtrend line (now between $900 and $920) is penetrated, we cannot say that the correction in gold is over and that the new stage of the gold bull market has begun.

Fundamentals remain exceptionally bullish on all fronts. Real interest rates are negative while inflation expectations have little room to go lower. A huge wave of fiscal stimulus is on the way.

The independent research house GFMS Ltd. had the following to say about gold demand:

Dollar demand for gold reached an all-time quarterly record of US$32bn in the third quarter of 2008. Tonnage demand was also 18 percent higher than a year earlier.

Identifiable investment demand, which incorporates demand for gold through exchange traded funds (ETFs), bars and coins, was the biggest contributor to overall demand during the quarter; it was up to US$10.7bn (382 tonnes), double the amount from a year earlier.

Retail investment demand rose 121 percent to 232 tonnes in Q3, with strong bar and coin buying reported in Swiss, German and US markets. The quarter also witnessed widespread reports of gold shortages among bullion dealers across the globe, as investors searched for a safe haven. During the quarter, Europe reached an all-time record 51 tonnes of bar and coin buying and France became a net investor in gold for the first time since the early 1980s.

Consumer demand for gold jewellery was also at a record with buyers coming back in to the market at lower price levels than previously, around and below $800. India (traditionally the world’s largest gold jewellery consumer, with an average over the past five years of 21% of world jewellery demand), staged a strong recovery during the quarter, with the dollar value of gold in jewellery rising by 65% year-on-year.

These changes in “identifiable demand” were offset by outflows in “inferred investment”. With recessionary fears looming, hedge funds liquidated investment positions in gold as they were forced to raise cash, and institutions liquidated commodity index investments, including gold. The trend largely reflects gold’s better performance relative to other assets and also explains why the gold price did not perform better during the quarter in the face of very strong demand.

Gold sales by central banks are at their lowest levels since 1999.

Total global gold production contracted 0.4% in 2007, to an eleven-year low. In the last four months, several companies have announced that they are curtailing production or delaying projects, and all companies are at least reviewing their spending plans. Randgold Resources (GOLD) expects global gold production to decline by between 15% and 20% in the next three or four years, as unprofitable operations are squeezed out and difficult market conditions delay the development of new mines.

While this is a difficult process, the whole PM industry will come out of this slump stronger and more resilient. Companies that survive will do exceptionally well.

Unlike most stock indices which made lower lows last week, all gold indices made higher lows. This positive divergence gives us reason to believe that smart money is starting to pour funds into gold stocks – pointing to the evidence of the first sector rotation in this bear market.

Friday saw one of the biggest up-days on HUI, which climbed 46 points or 27.5%. Gold was by far the best performing sector in the entire stock market. We believe that these are all signs that the sector rotation to precious metals and related stocks is underway.

If gold continues to hold up strongly and the stock market rebounds or at least stabilizes, the $HUI index could quickly recover to 275-325 levels.

However, gold stocks continue to underperform the metal. In order for the bullish scenario outlined above to come to fruition, we need to see the downtrend line in the $HUI & Gold ratio be taken out to the upside.

We believe that this should happen in the coming days or weeks. This point of view is based on the fact that the Gold/Oil ratio and the Gold/Industrial Metals ratio have soared to the best levels for gold producers in the past 10 years. This allows us to expect substantial reduction in costs of production and capital expenditures for most mining companies.

Paired with the strong gold price, margins for gold producers should start to improve. We do not know of any other sector in the equity market which is expected to see increases in profit margins.

While the above is directly beneficial for the producers, for juniors, the latest round of acquisition activity gives us reason to believe that the juniors are finally bottoming out.

From a negative point of view, continuing tax selling pressure before the year end could temporarily weaken these positives.

Those investors who are considering putting money in the gold sector should consider the following low-risk, cash generating producers: See RSG Newsletter.

Share this:

  • Click to share on Reddit (Opens in new window) Reddit
  • Click to share on Facebook (Opens in new window) Facebook
  • Click to share on LinkedIn (Opens in new window) LinkedIn
  • More
  • Click to share on X (Opens in new window) X
  • Click to share on Pinterest (Opens in new window) Pinterest
  • Click to share on Tumblr (Opens in new window) Tumblr
  • Click to print (Opens in new window) Print
  • Click to email a link to a friend (Opens in new window) Email
Like Loading...

Demanding Gold – Hard Assets Investor

24 Monday Nov 2008

Posted by jschulmansr in capitalism, commodities, Copper, Currency and Currencies, deflation, Finance, Fundamental Analysis, gold, hard assets, inflation, Investing, investments, Latest News, Markets, mining stocks, precious metals, silver, Technical Analysis, Today, U.S. Dollar, Uncategorized

≈ Comments Off on Demanding Gold – Hard Assets Investor

Tags

agricultural commodities, alternate energy, Austrian school, banking crisis, banks, bear market, Bollinger Bands, bull market, capitalism, central banks, China, Comex, commodities, communism, Copper, Currencies, currency, deflation, depression, diamonds, dollar denominated, dollar denominated investments, economic, economic trends, economy, financial, Forex, futures, futures markets, gold, gold miners, hard assets, heating oil, India, inflation, investments, market crash, Markets, mining companies, Moving Averages, natural gas, oil, palladium, physical gold, platinum, platinum miners, precious metals, price, price manipulation, prices, producers, production, protection, rare earth metals, recession, risk, run on banks, safety, Saudi Arabia, silver, silver miners, socialism, sovereign, spot, spot price, stagflation, Technical Analysis, timber, U.S. Dollar, volatility, warrants, Water

Demanding Gold – Hard Assets Investor

Written by Julian Murdoch of Hard Assets Investor 

Friday night’s headlines were straightforward: “Gold surges to top $800 on safe-haven buying.” And most of the analysis followed a familiar pattern:

  • The price of gold has declined as a result of liquidity selling
  • Once everyone sells the gold, the market will stabilize
  • The price will rally as investors seek a safe haven in the face of monster money-printing by the U.S. government

It’s a convenient story, and one that makes some prima-facie sense. But like any Monday morning quarterbacking (including my own), there’s rarely a way to actually know exactly why something goes up and down. Except, of course, for supply and demand. It’s always about supply and demand.

Which is why I was planning on writing about gold this week even before we saw the metal pop almost 6% Friday, to close at $801.60 (NY Spot), and before we saw the big gold miners like Barrick have monster days, with that company closing up 31%. Pops like that are enough to make anyone sit up and take notice, despite our general concerns about buying miners vs. metals.

Hence my plan to cover gold. The third week in November, you see, is when the World Gold Council releases the supply-and-demand numbers that carry us through the end of the year. And the astonishing thing isn’t so much the numbers, but that they seem to have gone largely unnoticed by the press in describing the rally. Let’s take a look at the charts.


There are a few points to note here. First, this measures demand in tonnes, not in dollars. We’ll get to dollars in a second.

But the big thing to note here is that the 2008 number is an estimate that we’ve created by applying last year’s Q3-to-Q4 trends to 2008. From Q3 to Q4 2007, gold demand dropped an unexpected 15% on a tonnage basis. The chart above suggests that, even if gold demand falls again, total tonnage demand for 2008 will equal 2007. If Q4’08 demand instead remains steady heading into the end of the year, total 2008 demand will be the biggest in the last five years.

Regardless, however, the strong continued demand, particularly from the investment community, is even more dramatic in dollar terms.


Gold Demand ($, Billions


In dollar terms, gold is experiencing tremendous demand growth. There’s no rocket science here: The average price of gold in 2007 was just under $700. The average price of gold in 3Q 2008 was $871, down from the first-quarter average of $924. All that means is that that same physical demand is coming at a time of rising prices (or a weak dollar, depending on your perspective).

Gold - London PM Fix 2000 - present


To put the demand in perspective, here’s the juicy tidbit direct from the World Gold Council press release:


“Dollar demand for gold reached an all-time quarterly record of US$32bn in the third quarter of 2008 as investors around the world sought refuge from the global financial meltdown, and jewelry buyers returned to the market in droves on a lower gold price. This figure was 45% higher than the previous record in Q2 2008. Tonnage demand was also 18% higher than a year earlier.”


This dollar demand is driven almost entirely by increased demand from exchange-traded funds and physical coin investments, offsetting a decline in jewelry demand.


Gold Demand (Share)


To be fair, this continued demand wasn’t entirely unexpected, nor was it completely unreported. Most of the weekend paper hyperbole about the gold rally did pay homage to demand, albeit without citing the nice hard figures we have from the World Gold Council. But what seems really underreported is that the actual supply demand deficit is frankly staggering.


Gold Surplus/Deficit

The reasons for this deficit are fairly straightforward: The quarterly demand is high, and one of the major sources of supply over the last few years has dried up – sales by central banks. The Central Bank Gold Agreement, which set limits on gold sales in 1999 to stabilize the market after the foundation of the euro, is set to run its course in 2009, but the 2008 limits on CBGA sales (500 tonnes per year) aren’t even close to being reached, and the reality is that European central banks may simply be done offloading their excess gold reserves.

If true, that means a major source of supply is simply going away. It’s easy to visualize a pathway from the central banks into the hands of investors-a shift in ownership. But that shift in ownership may be complete, and thus, if investor demand continues, it will rely on other traditional sources of gold-namely mines-to get at the stuff.

That would set the stage for continued deficits, higher prices and busy miners. It strikes me that that’s the real story of last week’s rallies.

MY NOTE: Inother simpler words, demand up and increasing = prices increasing!

Disclosure: Long Precious Metals and Stocks

jschulmansr

Share this:

  • Click to share on Reddit (Opens in new window) Reddit
  • Click to share on Facebook (Opens in new window) Facebook
  • Click to share on LinkedIn (Opens in new window) LinkedIn
  • More
  • Click to share on X (Opens in new window) X
  • Click to share on Pinterest (Opens in new window) Pinterest
  • Click to share on Tumblr (Opens in new window) Tumblr
  • Click to print (Opens in new window) Print
  • Click to email a link to a friend (Opens in new window) Email
Like Loading...

Peter Schiff on Fast Money Calls $2,000 Gold in 2009–Gold Stock Bull

24 Monday Nov 2008

Posted by jschulmansr in capitalism, commodities, Copper, Currency and Currencies, deflation, Finance, Fundamental Analysis, gold, hard assets, inflation, Investing, investments, Latest News, Markets, mining stocks, precious metals, silver, Technical Analysis, Today, U.S. Dollar, Uncategorized

≈ Comments Off on Peter Schiff on Fast Money Calls $2,000 Gold in 2009–Gold Stock Bull

Tags

agricultural commodities, alternate energy, Austrian school, banking crisis, banks, bear market, Bollinger Bands, bull market, capitalism, central banks, China, Comex, commodities, communism, Copper, Currencies, currency, deflation, depression, diamonds, dollar denominated, dollar denominated investments, economic, economic trends, economy, financial, Forex, futures, futures markets, gold, gold miners, hard assets, heating oil, India, inflation, investments, market crash, Markets, mining companies, Moving Averages, natural gas, oil, palladium, physical gold, platinum, platinum miners, precious metals, price, price manipulation, prices, producers, production, protection, rare earth metals, recession, risk, run on banks, safety, Saudi Arabia, silver, silver miners, socialism, sovereign, spot, spot price, stagflation, Technical Analysis, timber, U.S. Dollar, volatility, warrants, Water

Peter Schiff on Fast Money Calls $2,000 Gold in 2009–Gold Stock Bull

By Jason Hamlin of Gold Stock Bull
 
Mr. Schiff was mocked for calling the market collapse before it happened, correctly predicted that gold would reach $1,000 in 2008 and recently schooled the CNBC crew at Fast Money as he predicts the market has much further to drop and gold will hit $2,000 in 2009. If you’ve been a subscriber to Gold Stock Bull for a while, you know we have been making similar calls and are aligned with his views. 2008 may prove to be the last time you will be able to get gold under $1,000 or silver under $10. The liquidation and deleveraging has created a short-term buying opportunity across all commodities and for precious metals in particular. Get some while you still can because when the floor falls out from beneath the dollar, the party is over.


Share this:

  • Click to share on Reddit (Opens in new window) Reddit
  • Click to share on Facebook (Opens in new window) Facebook
  • Click to share on LinkedIn (Opens in new window) LinkedIn
  • More
  • Click to share on X (Opens in new window) X
  • Click to share on Pinterest (Opens in new window) Pinterest
  • Click to share on Tumblr (Opens in new window) Tumblr
  • Click to print (Opens in new window) Print
  • Click to email a link to a friend (Opens in new window) Email
Like Loading...

Peter Schiff: Gold Will Rise, Dollar Will Collapse – Hard Assets Investors

19 Wednesday Nov 2008

Posted by jschulmansr in commodities, Copper, Currency and Currencies, deflation, Finance, gold, hard assets, inflation, Investing, investments, Latest News, Markets, mining stocks, precious metals, silver, U.S. Dollar, Uncategorized

≈ Comments Off on Peter Schiff: Gold Will Rise, Dollar Will Collapse – Hard Assets Investors

Tags

agricultural commodities, alternate energy, Austrian school, banking crisis, banks, bear market, Bollinger Bands, bull market, capitalism, central banks, China, Comex, commodities, communism, Copper, Currencies, currency, deflation, depression, diamonds, dollar denominated, dollar denominated investments, economic, economic trends, economy, financial, Forex, futures, futures markets, gold, gold miners, hard assets, heating oil, India, inflation, investments, market crash, Markets, mining companies, Moving Averages, natural gas, oil, palladium, physical gold, platinum, platinum miners, precious metals, price, price manipulation, prices, producers, production, protection, rare earth metals, recession, risk, run on banks, safety, Saudi Arabia, silver, silver miners, socialism, sovereign, spot, spot price, stagflation, Technical Analysis, timber, U.S. Dollar, volatility, warrants, Water

Peter Schiff: Gold Will Rise, Dollar Will Collapse – Features and Interviews – Hard Assets Investors 

Written by Administrator –  Hard Assets Investor


Norman: Let’s see the performance from this point forward; we’ll look back at this again and we’ll revisit this issue.

Let’s talk about something else, something that you have also … and I just mentioned it … the U.S. dollar. You were very, very negative. In the last month, we have seen unprecedented actions by the U.S. Fed in terms of expansion of the monetary basis; in other words, printing money … what you call printing money … and despite that, the dollar has remained incredibly strong.

How do you explain that according to your logic?

Schiff: Everything the government is doing is inherently negative for the dollar, and all of this…

Norman: It’s not playing out that way.

Schiff: It will; you’ve got to give it time.

I remember when I was on television talking about the subprime and people were telling me it’s no big deal, and I said, just wait a while; give it time.
Look, everything that we’re doing – all the bailouts, all the stimulus packages – this is all being financed by inflation. It’s inherently terrible for the dollar.

Norman: But you just said yourself that everything is deflating.

Schiff: But right now, Mike, you’re getting this de-leveraging, and this is benefitting the dollar, so despite the horrific fundamentals for the dollar, it’s going up anyway.
But ultimately, when this phony rally runs out of steam, the dollar is going to collapse, and that’s when we’re going to have a much greater crisis because now you’re going to have a collapsing dollar, which is going to push long-term interest rates up, commodity prices up.

Norman: I still don’t understand why the dollar is going to collapse. So you’re saying that the Fed is just going to allow … or leave this enormous amount of liquidity in there, that at some point down the road, if we recover, they’re not going Scto take it out?

Schiff: Look, they have no control over it. The Fed is trying to artificially reflate our phony economy, right?

We had this economy that was based on Americans borrowing money and then spending it on products. We have this huge debt finance bubble which is collapsing, and it’s being supported by foreigners.

But when this artificial demand for Treasuries goes away, the Fed is going to try to print a lot of money and the dollar is going to get killed.

Norman: All right; I’m going to ask you to hold on. Folks, check back because we’re going to do the second part of my interview with Peter Schiff, so check back to this site. This is Mike Norman; bye for now.

Mike Norman, HardAssetsInestor.com (Norman): Hello everybody, and welcome back for another installment of HardAssetsInvestor.com’s interview series. I’m Mike Norman, your host. Well, he’s back. Mr. Doom and Gloom is here … Peter Schiff, president of Euro Pacific Capital and author of the new book just out, “Bull Moves in Bear Markets.”Peter Schiff, president of Euro Pacific Capital (Schiff): “The Little Book …”Norman: “The Little Book …”; it’s in The Little Book Series. Well look … the last time you were here, things were kind of going your way, but it looks like things have turned upside down.
All kidding aside, I know your big thing over the last seven or eight years has been gold. We’re very supportive of gold on this show; we think that probably people should have some gold as part of their overall portfolio mix. But let’s just look at what happened.Several weeks ago, the U.S. stock market had its worst week in history … even going back to the 1930s … worst week in history. I saw a breakdown of various assets – all assets really – stocks, bonds, gold, commodities, oil. Gold was at the bottom of the list. The top-performing asset, and something that you hate, was the U.S dollar.So how do you explain that? If we are going through the worst economic and financial crisis in history – precisely what gold is supposed to protect against – why would it perform so bad?Schiff: Well, I think it will perform very well; you got to give it a little bit more time.Norman: More time or more decimation?

Schiff: No, what’s happening right now, Mike, is just de-leveraging, and so gold is going down for the same reason a lot of stocks are going down, a lot of commodities are going down. There’s a lot of leverage in this system, there’s a lot of margin calls, a lot of liquidation; a lot of people are having to sell whatever they own to pay off their debts.

Norman: But look at where the money is going … the money is going into U.S. sovereigns, Treasuries … it’s going into the U.S. dollar.

Schiff: For now.

Norman: Why for now?

Schiff: Right now there’s some perception of safety there, but it’s the opposite of the leveraging. If you’re selling your assets, you’re accumulating dollars; but ultimately right now, it’s like there’s been this gigantic nuclear explosion in the United States, and everybody is running toward the blast. Pretty soon they’re going to figure out they’re going in the wrong direction.

Norman: You always talk about gold as a currency, and we have seen currencies appreciate – the yen, for example, the dollar tremendously, for example, but gold has not held up.

Schiff: Well, if you actually look at gold versus other currencies, in the last couple of weeks gold has made new record highs in terms of the South African rand, the Canadian and Australian dollars … so gold was not doing as poorly as many of the currencies, and I think this is all short term.

I think you’re going to see a lot of money moving into gold, and if you look at how much gold has gone down from the peak, the peak was about a thousand … it’s off about 25%. Stocks are off 40%. Gold is still up during this year against the Dow.

Stay Tuned for Part II<!—-> of our interview with Peter Schiff.
 

Share this:

  • Click to share on Reddit (Opens in new window) Reddit
  • Click to share on Facebook (Opens in new window) Facebook
  • Click to share on LinkedIn (Opens in new window) LinkedIn
  • More
  • Click to share on X (Opens in new window) X
  • Click to share on Pinterest (Opens in new window) Pinterest
  • Click to share on Tumblr (Opens in new window) Tumblr
  • Click to print (Opens in new window) Print
  • Click to email a link to a friend (Opens in new window) Email
Like Loading...

Can a Dubai Silver ETF Send Global Spot Prices Higher?

18 Tuesday Nov 2008

Posted by jschulmansr in capitalism, commodities, Copper, Currency and Currencies, deflation, Finance, gold, hacking, inflation, Investing, investments, Latest News, Markets, precious metals, silver, Today, U.S. Dollar, Uncategorized

≈ Comments Off on Can a Dubai Silver ETF Send Global Spot Prices Higher?

Tags

agricultural commodities, alternate energy, Austrian school, banking crisis, banks, bear market, Bollinger Bands, bull market, capitalism, central banks, China, Comex, commodities, communism, Copper, Currencies, currency, deflation, depression, diamonds, dollar denominated, dollar denominated investments, economic, economic trends, economy, financial, Forex, futures, futures markets, gold, gold miners, hard assets, heating oil, India, inflation, investments, market crash, Markets, mining companies, Moving Averages, natural gas, oil, palladium, physical gold, platinum, platinum miners, precious metals, price, price manipulation, prices, producers, production, protection, rare earth metals, recession, risk, run on banks, safety, Saudi Arabia, silver, silver miners, socialism, sovereign, spot, spot price, stagflation, Technical Analysis, timber, U.S. Dollar, volatility, warrants, Water

Can a Dubai Silver ETF Send Global Spot Prices Higher? – Seeking Alpha

By: Peter Cooper of  Arabian Money.net

The Dubai Multi Commodities Center is understood to be putting the finishing touches to an exchange traded fund for silver with a launch likely next month as demand for silver has surged in the past six months.

Local bullion dealers are having to fly heavy silver bullion bars in from around the globe to meet demand as traditional sources closer to Dubai have been exhausted. The DMCC has successfully established itself as a regional hub for commodities trading over the past few years, and has its own swanky new business park with its gold, silver and diamond towers.

City of Gold

Around 20 per cent of the world’s physical gold trade is conducted through Dubai which used to be the epicenter of gold smuggling to India thirty years ago when import taxes were sky high. Nowadays Dubai is a convenient logistics center for commodities traders and still tax free.

The details of the silver ETF are being kept under wraps for the launch but plans seem advanced. Local jewelers have long used silver in a 25:75 amalgam with gold to create white-gold which is popular with consumers.

But clearly the ETF is an strictly an investment product, and demand for the shiniest of metals has been rising strongly, as evidenced by the high premiums now being paid on coins and bullion locally.

ETF price advantage

The latter also gives the ETF a natural advantage. Its price will be closely linked to the lower spot price for physical silver, and not be inflated by the high premiums now paid on physical silver.

Investors will no doubt appreciate this keen pricing advantage, and hope to also profit from the leverage silver offers to the gold price. In previous gold price booms silver has outperformed the yellow metal, and the gold-to-silver price ratio has fallen sharply.

Will the new Dubai silver ETF have a big enough impact on the tiny global silver market to send prices higher like the Hunt Brothers did in the late 1970s when they cornered the market? Well, nothing succeeds like success and a silver ETF in Dubai looks like being the right product in the right place at the right time.

My Note: A Word to the Wise is sufficient!

See My Ealier Post from Today: All The Gold In Saudi Arabia, if they buy as much Silver as they have Gold – Look Out…

My Disclosure: I am long all Precious Metals, Mining Companies, Etf’s, and in my opinion you should be too! – jschulmansr 

Share this:

  • Click to share on Reddit (Opens in new window) Reddit
  • Click to share on Facebook (Opens in new window) Facebook
  • Click to share on LinkedIn (Opens in new window) LinkedIn
  • More
  • Click to share on X (Opens in new window) X
  • Click to share on Pinterest (Opens in new window) Pinterest
  • Click to share on Tumblr (Opens in new window) Tumblr
  • Click to print (Opens in new window) Print
  • Click to email a link to a friend (Opens in new window) Email
Like Loading...

Dudley Baker: “It’s either the end of the world or a fabulous buying opportunity”

18 Tuesday Nov 2008

Posted by jschulmansr in commodities, Copper, deflation, Finance, gold, hard assets, inflation, Investing, investments, Latest News, Markets, mining stocks, precious metals, silver, Uncategorized

≈ Comments Off on Dudley Baker: “It’s either the end of the world or a fabulous buying opportunity”

Tags

agricultural commodities, alternate energy, Austrian school, banking crisis, banks, bear market, bear stearns, Bollinger Bands, bull market, capitalism, central banks, China, Comex, commodities, communism, Copper, Currencies, currency, deflation, depression, diamonds, dollar denominated, dollar denominated investments, economic, economic trends, economy, financial, Forex, futures, futures markets, gold, gold miners, hard assets, heating oil, India, inflation, investments, market crash, Markets, mining companies, Moving Averages, natural gas, oil, palladium, physical gold, platinum, platinum miners, precious metals, price, price manipulation, prices, producers, production, protection, rare earth metals, recession, risk, run on banks, safety, Saudi Arabia, silver, silver miners, socialism, sovereign, spot, spot price, stagflation, Technical Analysis, timber, U.S. Dollar, volatility, warrants, Water

Dudley Baker: “It’s either the end of the world or a fabulous buying opportunity”

Source: The Gold Report  11/18/2008


His pitch is irresistible: “Buy a basket of juniors with warrants and it could be the easiest 500% you’ll ever make.” In this exclusive look at one of the most overlooked and misunderstood investment vehicles, Dudley Baker of PreciousMetalsWarrants.com explains to The Gold Report exactly what warrants are and how they increase the odds of winning vastly higher returns. With a little arm-twisting, Baker even reveals some of his most prized “unbelievable” opportunities.”

The Gold Report: Could you start by explaining what a warrant is and how it differs from a futures contract?

Dudley Baker: A warrant is basically a security. It gives the holder the right, but not the obligation, to purchase the underlying stock at a specific price within a specific period of time. It sounds very similar to a call option except that it really is a security and a warrant will trade in much the same way as common shares. A warrant is assigned a symbol and will trade on the exchange or, in the U.S., it will have U.S.-assigned symbol where it can be traded over-the-counter.

TGR: Are all the warrants traded in the over-the-counter market?

DB: No, no. Most will always be private. Many precious metals investors know ‘warrants’ because they are frequently issued in a private placement. But most of those warrants never trade on any exchange and they’re not transferable. On my website only cover those warrants that are trading, the ones you and I could go out and buy. For example, Warren Buffet conducted a private transaction with General Electric and Goldman Sachs. There will never be a market for those. That’s the distinction, whether it’s a warrant with a private placement or an initial public offering. In rare cases a company can get the warrants listed if they were issued in connection with a private placement.

TGR: So Buffet purchases the stock and then is awarded the warrants. Is it GE or Buffet who decides to make those warrants transferable?

DB: In this case it probably would be Buffet. Since he actually owns those warrants it’s his decision.

TGR: Let’s to back to the private placement example. Aren’t warrants used as a sweetener for a private placement investment? In that case, who makes the decision as to whether those warrants are transferable?

DB: The company will make that decision. In Warren Buffet’s case, let’s say that he’s the only holder of the Goldman Sachs and GE warrants. Even if the company said we want these to trade, there’s nobody to trade them because there’s only one guy, Buffet, who owns them and he’s probably not going to trade them. The chances are that he would just convert the warrants or the company would buy them back at some point. But in the case of the private placement of a mining company, there may be hundreds or even a thousand participants. If the company decides to list those warrants, those 500 to 1,000 individuals could decide to trade them. So now we’ve got some liquidity. And we always need that liquidity. So there are a lot of opportunities even for the bigger companies that have warrants trading.

TGR: So when warrants are initially issued, they could be privately placed, or publicly traded.

DB: Right.

TGR: Are most of the warrants that are publicly traded related to financial transactions other than mergers?

DB: They could be issued in connection with the financing for an initial public offering. A lot of warrants start with the private placements, the initial public offerings, and mergers. So warrants that are trading come about through a number of different circumstances.

TGR: Given the current stock market and the merger and acquisition environment, would you expect increased interest in the purchase of warrants?

DB: You mean what is the future for warrants?

TGR: Yes.

DB: Let’s put it this way. The most important thing is to have a solid understanding of the underlying fundamentals of the company. Do they have a good story? Is there potential for the stock to greatly increase in value? And then we have to ask, maybe before we buy the commons shares: will trading a warrant give us a lot more leverage? If so, what is the remaining life of that warrant? It is especially important in this environment to have as long a life on a warrant as possible. Many of the warrants in our database have three years or more of a remaining life, which is really great. Some of them have four or five years. One actually has an 8-1/2 years going out to 2017. I see great opportunities going forward.

Are we going to blast off in a rally this week, next week, next month? I don’t know. But I’m very confident that in the coming months and years that gold and the junior mining shares are going much, much higher. So I’m very comfortable buying warrants in the juniors. It is critical to have as long a life as possible. I cannot stress enough how important it is to look at that underlying common stock. If the company’s common stock does not go up, there’s no way the warrants are going up. So we have to be confident that the company will be able to execute its business plan. Then we hope for a skyrocketing market here in the coming months and years.

TGR: So the real advantage of a warrant as opposed to the common shares is the leverage.

DB: Exactly and that’s why we’d start looking at a warrant. It gives us a lot more bang for our buck, a lot more leverage. I’m always looking for a minimum of two times the leverage. So if we’re looking for a common stock to go up 100%, I’m leveraged to make at least 200% by buying the warrant.

TGR: How would you compare a warrant to a call option?

DB: Good question. A call option is just going to trade on the Chicago Board Options Exchange, whereas a warrant is actually going to trade like a common stock on the TSX. The main difference we’ve got is time and we always want as much time as possible. There are so many call options out there on the mining shares, but maybe they’ve got 90 days or 180 days, one year at most. That’s not enough time for me. In this treacherous market environment that we’ve had over the last two years, options are really just speculating. I like to think that if we can find a long-term warrant on a good company that has a two-year minimum life—if not three years or more— now we’re investing. This way, time is on my side. On my website I’ve got some examples of my trades and the common denominator of those that generated roughly 1,000% or more return was the fact that all of those warrants had over a three year remaining life when I bought them. Time is the key to my success with warrants.

TGR: I would think time really plays very well right now with the market being at 52-week, if not 5-year, if not 30-year lows.

DB: Incredible, yes.

TGR: It probably can’t go much lower in the next three years.

DB: That’s exactly how I see it. You can make a blanket statement that nearly all of the juniors and warrants are off by at least 90% in value. Either you believe this is the end of the world and the game is over or this is just a fabulous buying opportunity. I was buying this morning. I’ve usually do several transactions each week, so I just continue to build inventory, accumulate mining shares and warrants, which I’ll sell in the future at substantially higher prices. So, if we can find a warrant that, say, has a three-year or longer remaining life, it’s going to be hard to imagine how high it might go in a few years. It used to be that if a stock were trading for less than 10 cents, you’d be crazy to consider it. In this environment, a lot of juniors are selling for less than 10 cents; good companies with cash in the bank. The opportunities out there today are truly incredible.

TGR: You have some mid-market producers trading under a dollar and they have cash flow.

DB: It’s just unbelievable. I’m probably one of the more optimistic guys. I am very positive about where we’re going. It may not be next week, but in the coming two to five years it’s going to be a totally different game. We are just building inventory getting set here for what’s coming.

TGR: How do our readers discover what warrants are out there, particularly in precious metals?

DB: I would suggest that they visit my website, PreciousMetalsWarrants.com. I’ve put together a learning center over the last several months. After I created the database listing all of the companies in the natural resource sector that have warrants trading in the U.S. and in Canada, I realized that a lot of people don’t even know what warrants are. So I built the learning center to answer a lot of basic questions.

Warrants actually go back to the 1920s, so they’ve been around for a long time. Options and futures have gotten all the publicity in the past five to ten years. I’m dusting off the term ‘warrants’ again and bringing it back into play so that investors can see the possibilities. Now that Warren Buffet has reintroduced the word ‘warrant’, it’s great for me. The more people we educate about warrants, the better it is for all of us.

TGR: More liquidity, more traders.

DB: Exactly, exactly.

TGR: Can you share with us some of the companies that you particularly like who are trading warrants?

DB: Let me start with some that are your sponsors. I’m not too knowledgeable about the companies and the leverage fluctuates, so we always have to take a look. I like to think that’s why subscribers need me. I’ve got some special leverage calculations that I do. What may be a good deal tomorrow is not necessarily a good deal next week. I calculate the pricing and the relationship of the warrant to the common shares.

Franco Nevada Corp. (FNV.TO), a royalty and investment company, has a warrant extending to 2012. I’m not suggesting that you run out and buy this warrant, but it does look interesting. Do your own due diligence. See what the leverage looks like and whether you want to get involved. Another one—I don’t know of another analyst that follows this and I have minimal knowledge myself—is Colossus Minerals Inc. (TSX:CSI). It has a warrant out to 2011. So that’s quite a few years. They have gold properties in Brazil. The situation looks interesting.

I like Piedmont Mining Co. (OTCBB :PIED). It’s a small junior exploration company and all of its properties are in Nevada. Robert Shields is president and I feel very comfortable with the management. The price has been decimated, as has most of the sector. But I believe it will be a great opportunity. Another one that you don’t hear much about is Vangold Resources (TSX.V:VAN). It is amazing. I’ve got a small position in it myself. It’s got gold, oil and gas, and beryllium. Again it’s selling literally for pennies and you’ve just got to scratch your head and ask how can this be. A lot of your sponsors are great companies and I just have to believe that virtually all of them present buying opportunities.

The last one is Great Panther Resources (TSX.V:GPR). I love the company and its location. I live in Mexico – just outside of Guadalajara, so it’s about a 3-1/2 hour drive from my home. This is one of my favorite silver companies. I’ve visited Bob Archer, the president, several times and have seen the properties. They’re going to be mining silver way after all of us are gone from this planet. It’s a great operation selling for 10% of its all time high. There are so many wonderful stories out there that will become incredible opportunities in the coming months and years. You just hope that investors realize what they’re looking at because it’s going to be unbelievable. I always say buying a basket of the juniors today or a basket of the long-term warrants is probably the easiest 500% you’ll ever make in your life.

TGR: I liked the idea that warrants allow a company the time to grow because no one really knows when to call the bottom. Is it going to be this quarter, next quarter; will it turn around in 2009? But everyone’s saying in a couple of years we’re going to look back and say, wow, that was cheap back then.

DB: There’s one warrant that just started trading. I bought it for 10 cents. It has over a 4-1/2 year remaining life. I plan on selling it for dollars, many dollars. It’s almost like a giveaway. Maybe it’s just my attitude. I have such strong beliefs about where we’re going. Yes, the draw down that we’ve got right now bothers me, but I’m focused on the longer term. So this is just giving us opportunities to continue to buy at these ridiculously low prices.

TGR: Can you share with us this ridiculously low-priced warrant you bought today?

DB: You’re going to put me on the spot, huh? Okay, the name is Gold Wheaton Gold Corp. (GLWGF) (TSX.V:GLW). Everybody knows Silver Wheaton. This is a totally different company with totally different management but essentially the same business model. Gold Wheaton stock is probably trading around 33 cents. The exercise price is one dollar.

So you ask why in the world would I want to buy this warrant that has a one-dollar exercise price when the common stock is now selling for, say, 30 to 35 cents? The reason is that we’ve got a 4-1/2 year remaining life and the leverage is going to return much better than a 2:1. I have my database and I’ve got leverage calculations on another spreadsheet showing different price points going forward. This is how I look at a warrant. I ask how is this warrant going to perform if the common stock doubles, triples, quadruples, or goes up ten times? I’m looking at the underlying leverage. Is that going to give me my 2:1 or better opportunity? So this morning the Gold Wheaton warrant just started trading. It looks good to me. Who knows? It could go down a little bit more from where what it started trading. But we’re somewhere around the 10 to12 cents range, which just sounds unbelievable when we’ve got a 4-1/2 years or more remaining life. So you buy it, you put it away, and know it’s going to be easy money.

TGR: Dudley, this has been very interesting.

The Gold Report has worked out a special deal with Dudley Baker of Precious MetalsWarrants.com to offer our readers a free 30-day look at his database—full access to his personal portfolio—or what he calls a “Look Over My Shoulder.” You can see everything he owns and get an email any time he does a transaction. Sign up now.

Share this:

  • Click to share on Reddit (Opens in new window) Reddit
  • Click to share on Facebook (Opens in new window) Facebook
  • Click to share on LinkedIn (Opens in new window) LinkedIn
  • More
  • Click to share on X (Opens in new window) X
  • Click to share on Pinterest (Opens in new window) Pinterest
  • Click to share on Tumblr (Opens in new window) Tumblr
  • Click to print (Opens in new window) Print
  • Click to email a link to a friend (Opens in new window) Email
Like Loading...

Precious Metals Will Depose Cash from Its Temporary Throne

18 Tuesday Nov 2008

Posted by jschulmansr in capitalism, commodities, Copper, Currency and Currencies, deflation, Finance, Fundamental Analysis, gold, hard assets, inflation, Investing, investments, Latest News, Markets, mining stocks, precious metals, silver, Technical Analysis, Today, U.S. Dollar, Uncategorized

≈ 2 Comments

Tags

agricultural commodities, alternate energy, Austrian school, banking crisis, banks, bear market, bear stearns, Bollinger Bands, bull market, capitalism, central banks, China, Comex, commodities, communism, Copper, Currencies, currency, deflation, depression, diamonds, dollar denominated, dollar denominated investments, economic, economic trends, economy, financial, Forex, futures, futures markets, gold, gold miners, hard assets, heating oil, India, inflation, investments, market crash, Markets, mining companies, Moving Averages, natural gas, oil, palladium, physical gold, platinum, platinum miners, precious metals, price, price manipulation, prices, producers, production, protection, rare earth metals, recession, risk, run on banks, safety, Saudi Arabia, silver, silver miners, socialism, sovereign, spot, spot price, stagflation, Technical Analysis, timber, U.S. Dollar, volatility, Water

Precious Metals Will Depose Cash from Its Temporary Throne

By: Peter Cooper of  Arabian Money.net

‘We have just been in Bahrain and everybody is cashed up!’ one banker told me today. My reply was that if everybody is now in cash, then it just has to be the wrong place to be. There are some very good reasons to worry about a large cash position.

Quite apart from the contrarian argument that the crowd is always wrong, you have to consider what is happening to the supply of cash. We know that with the sell-offs in global capital markets there is plenty of demand for cash, but what about the supply?

Money supply out of control

Another banker today showed me a chart of US money supply growth over the past few months, and highlighted a 111% increase. This compared with something like 15% money supply growth in the early 1930s as the US authorities grappled with the Great Depression.

There is an absolute tsunami of money coming into the system. What happens when the supply of something exceeds the demand? The price drops. And that is exactly what is going to happen to the US dollar – the authorities are about to inflate away their debt problem.

It is so simple: The debt stays at the same nominal amount, you print more money and the real value of the debt falls. Of course, in the real world that also means a bond market collapse as inflation will make both the coupon and real value fall.

I wonder how long it will be until cash is deposed as king of the investment world? My guess is that it will not be long after the sell-off ends. How long will that take? It could be at the end of the year as the hedge funds attempt to square their positions, or it might be next spring after another lurch downwards in stock prices.

The bottom for stocks will be the top for cash and treasury bonds. Then inflation will start to emerge and depose cash from its temporary throne. Who will be the new king?

Gold and silver

Step forward precious metals to take a bow. Everybody knows that gold is inversely correlated to the US dollar and that silver is leveraged against the gold price. But why have precious metals taken so long to claim their crown in this financial meltdown?

The straight answer is that hedge funds have been selling assets across the board and turning gold into dollars, or at least the paper gold of futures contracts into greenbacks. The physical demand for gold and silver has been growing strongly all the time, hence the silver coin shortage and the $3.5 billion Saudi gold purchase.

Once the hedge funds stop selling (you always do eventually run out of assets to sell), then gold and silver prices will rally, and the rush out of cash and into precious metals will do something pretty spectacular to the price. Gold and silver stocks, languishing at a 40-year low, should jump and deliver phenomenal performance for new investors and repay the patience of long-term holders.


This article has 9 comments:

  •  
    0 0
    • socrateazz
    • 7 Comments

    Nov 17 08:31 AM

    storms are brewing in the finacial markets. The gales have produced a few waves and troughs. I think the real storm is coming! Unfortunately I think the actions seen so far have mostly added steam to the storm! I see folks finding safe harbor or riding the waves. I see little effort in actually weakening the storm. to weaken the storm one must weaken the cause. What caused the current financial situation? Is it the same things which made life soo good for so long? was it the laziness of many? Was it ignorance of those who think they know? was it greed of those with wealth? was it greed of those who wanted the wealth? was it ignorance of truth? Was it ignorance in beliefs? Was it power abuse? Was it abuse of force? was it special intererest abuse? was it general interest abuse? I could go on A small part ofan ovious problem has been recieving enormous thought while most of the problem is ignored with little concideration of the reasons which can not be blamed on somebody else.
    Reply |Report abuse
  •  
    0 0
    • Diabolo
    • 8 Comments

    Nov 17 08:56 AM

    i think we’ve already seen the worst – from now on, we wont have more high-profile bank failures – already had bear, lehman with merrill, aig, fnme, fdmc saved…

    Reply |Report abuse

    the govt will need to keep pumping these with cash – which at some point will lead to hyperinflation – gold is a great long-term investment… as for short-run, im still bullish dollars… when shit hits the fan, investors flock to dollar and yen!


  •  
    0 0
    • bobbobwhite
    • 44 Comments

    Nov 17 12:20 PM

    Gold and platinum are great longer term investments, but most people want more liquidity and shorter term results. However, we are harshly finding out that it is difficult to impossible to gain both at the same time in the same vehicle, but people still seek that nearly impossible(and lazy) dream and lose countless billions in the process.

    Reply |Report abuse

    My advice is to never, ever try to get the same investment advantages in one investment vehicle. Does not work. Have one for one purpose, one for another, etc. For example, gold and cash; stocks, gold and cash; bonds, cash and real estate, real estate, stocks and cash, etc., etc. in many combinations that work right for you(Cash means CD’s or MMF).

  •  
    0 0
    • OilyGasMiner
    • 43 Comments
    • My Website

    Nov 17 01:36 PM

    Peter, it seems our thoughts appear to align very well. Is it no surprise that the money supply is up over 100% over the past few months? According to Obama, TARP has already spent some $300B of the $750B. Hence money is being pumped at a RAPID pace into our withering economy.

    Reply |Report abuse

    I fully agree that this action coupled with the US debt increasing each day, will only result in furthe devaluation of the US. Dollar.

    We must recall that the massive sell offs in hedge funds aren’t usually voluntary and fund managers are being FORCED to sell because many investors believe that they are forced to sell. For example in Canada, investors with RRIFs, must pay taxes on at least $10,000 of their investment. However this value was determined at the start of the year, and with some portfolio’s down by over 50%. They are now actually paying taxes on 20% of their current portfolio. Due to the lack of transparent investment advice, we will continue to sell these massive sell offs take its toll on already undervalued equities. It is only a matter of months IMO before we see a commodity correction.

    And as we know “Concurrently, the U.S. Government runs large operating deficits in circumstances where its National Debt approximated $9.6 trillion at July 31, 2008, up from $9 trillion at December 31, 2007 and $6.2 trillion at December 31, 2006.”
    Quote Source: www.stockresearchporta…/

    The question is with the money supply increasing, debt increasing, unemployment increasing, foreclosures increasing, consumer confidence on the decline. How worse can things really get?

  •  
    0 0
    • User 30121
    • 269 Comments

    Nov 17 02:00 PM

    Sonofabitch! An article that TELLS IT LIKE IT IS! Oohhh, are you gonna catch hell from the nay sayers (anti-goldbugs). Thanks for saying it!
    Reply |Report abuse
  •  
    0 -1
    • Pangaea
    • 71 Comments

    Nov 17 02:13 PM

    A couple of problems with this article.

    Reply |Report abuse

    “The bottom for stocks will be the top for cash and treasury bonds.”

    At that eventual point, it might indeed be good for gold, but by definition it would also be attractive for stocks.

    Also, by any measure of money supply that I follow, it has been stagnant in recent months, not growing at all. This is what the Fed is trying to fight – shrinkage in the supply and velocity of money.

    research.stlouisfed.or…

    www.nowandfutures.com/…

    So until these trends end (money supply stagnation with deflation in all asset classes plus USD and Treasury strength), cash will remain king.


  •  
    0 0
    • theoilwizard
    • 1 Comment
    • My Website

    Nov 17 03:49 PM

    “In my opinion, commodity prices can possibly hit new lows in the upcoming months as the recession is still going on. There are a lot of uncertainties that are still at bay and till they have been cleared up, the economy will still be going downhill. Questions pertaining to increasing unemployment? Will the Govt bailout the US Automakers? How much are Corp taxes going to increase next year when Obama is in power? These uncertainties need to be solved before the market actually is stable for investors.

    Reply |Report abuse

    Hopefully you had found my insight helpful, I usually use the following website as a tool to gather all my data. Best of luck to all investors:
    www.stockresearchporta…;

  •  
    0 0
    • Marc Courtenay
    • 66 Comments
    • My Website

    Nov 17 09:16 PM

    We enjoy your articles and more importantly they help us keep things in their proper perspective. Keep them coming Peter, and thank you!!
    Reply |Report abuse
  •  
    0 0
    • huskerbob
    • 49 Comments

    Nov 18 02:18 AM

    pangaea: the coming bottom in the stock market doesn’t necessarily mean a bull market for equities.  The market could bounce along the bottom for the next decade or two (as it did before the last great bull market) while we deal with the consequences of this mess.
    And the Fed and it’s European counterpart are openly trying to weaken their respective currencies. It’s a struggle right now, but they will succeed mightily at some point!
    Gold is the enemy of inflation, and the gold market recognizes this. That is why central banks and their allies continue to fight the gold price, as all central banks must.
    Do yourself a favor and buy some artificially cheap gold. Get out of dollars while the gettin’s good!
    Reply |Report abuse

Share this:

  • Click to share on Reddit (Opens in new window) Reddit
  • Click to share on Facebook (Opens in new window) Facebook
  • Click to share on LinkedIn (Opens in new window) LinkedIn
  • More
  • Click to share on X (Opens in new window) X
  • Click to share on Pinterest (Opens in new window) Pinterest
  • Click to share on Tumblr (Opens in new window) Tumblr
  • Click to print (Opens in new window) Print
  • Click to email a link to a friend (Opens in new window) Email
Like Loading...

All the Gold in Saudi Arabia – Seeking Alpha

18 Tuesday Nov 2008

Posted by jschulmansr in commodities, Currency and Currencies, deflation, Finance, gold, hard assets, inflation, Investing, investments, Latest News, Markets, mining stocks, precious metals, silver, Today, U.S. Dollar, Uncategorized

≈ Comments Off on All the Gold in Saudi Arabia – Seeking Alpha

Tags

agricultural commodities, alternate energy, Austrian school, banking crisis, banks, bear market, bear stearns, Bollinger Bands, bull market, capitalism, central banks, China, Comex, commodities, communism, Copper, Currencies, currency, deflation, depression, diamonds, dollar denominated, dollar denominated investments, economic, economic trends, economy, financial, Forex, futures, futures markets, gold, gold miners, hard assets, heating oil, India, inflation, investments, market crash, Markets, mining companies, Moving Averages, natural gas, oil, palladium, physical gold, platinum, platinum miners, precious metals, price, price manipulation, prices, producers, production, protection, rare earth metals, recession, risk, run on banks, safety, Saudi Arabia, silver, silver miners, socialism, sovereign, spot, spot price, stagflation, Technical Analysis, timber, U.S. Dollar, volatility, Water

All the Gold in Saudi Arabia – Seeking Alpha

By: Tim Iacono

Tim’s blog: The Mess That Greenspan Made

There was a story out last week in the Gulf News about unprecedented gold buying in Saudi Arabia during the first half of November. According to the report, 13 billion Saudi riyals worth of the metal have been purchased in recent weeks – about $3.5 billion or roughly 140 tonnes at today’s prices.

A quick check of the SPDR Gold Shares ETF (NYSEArca:GLD) shows no similar buying over this time. In fact, the world’s most popular gold ETF has been noticeably quiet during this period, with just 0.3 tonnes exiting the trust earlier in the month, barely noticeable in the chart below.

It also looks like there’s another little wedge pattern forming at around $740 an ounce.
IMAGEThis report by Peter Cooper at ArabianMoney.net, which also appears at Seeking Alpha, lends some credibility to the story in the Gulf News, one of the leading English-language newspapers in the region:

I cannot verify the source but all I can say is that this has the hallmarks of a genuine story, based on my 25 years in financial journalism. First, it was buried on an inside page and the amount was given in UAE currency later in the story – hardly the action of somebody looking to manipulate the gold price, more an indication that the sub-editors did not understand the importance of this story.

Second, this is how the best stories emerge from Saudi Arabia – the market is not very transparent but insiders do notice big changes and pass this information on, and it surfaces as well sourced rumor. I am afraid this is about as good as it gets in the Middle East.

With local stock markets faltering badly and the property market in Dubai and elsewhere beginning what might be a truly spectacular fall, it makes sense that wealthy individuals would seek out more secure assets during this time of uncertainty.

Curious to see what this two-week purchase would look like when laid up against the inventory at the Gold ETF which, incidentally, just celebrated its four year anniversary, the chart below was created with the recent Saudi purchases indicated in yellow.
IMAGE

The 140 tonnes recently purchased in Saudi Arabia amount to about one-fifth the inventory that took four years to accumulate at the Gold ETF.

That’s a lot of gold in a very short period of time.

Full Disclosure: Long GLD at time of writing

Share this:

  • Click to share on Reddit (Opens in new window) Reddit
  • Click to share on Facebook (Opens in new window) Facebook
  • Click to share on LinkedIn (Opens in new window) LinkedIn
  • More
  • Click to share on X (Opens in new window) X
  • Click to share on Pinterest (Opens in new window) Pinterest
  • Click to share on Tumblr (Opens in new window) Tumblr
  • Click to print (Opens in new window) Print
  • Click to email a link to a friend (Opens in new window) Email
Like Loading...

Five Ways to Invest in Bottom-Basement Gold – Seeking Alpha

17 Monday Nov 2008

Posted by jschulmansr in commodities, Copper, Currency and Currencies, deflation, Finance, gold, hard assets, inflation, Investing, investments, Latest News, Markets, mining stocks, oil, precious metals, silver, Technical Analysis, Today, U.S. Dollar, Uncategorized

≈ 1 Comment

Tags

agricultural commodities, alternate energy, Austrian school, banking crisis, banks, bear market, bear stearns, Bollinger Bands, bull market, capitalism, central banks, China, Comex, commodities, communism, Copper, Currencies, currency, deflation, depression, diamonds, dollar denominated, dollar denominated investments, economic, economic trends, economy, financial, Forex, futures, futures markets, gold, gold miners, hard assets, heating oil, India, inflation, investments, market crash, Markets, mining companies, Moving Averages, natural gas, oil, palladium, physical gold, platinum, platinum miners, precious metals, price, price manipulation, prices, producers, production, protection, rare earth metals, recession, risk, run on banks, safety, silver, silver miners, socialism, sovereign, spot, spot price, stagflation, Technical Analysis, timber, U.S. Dollar, volatility, Water

Five Ways to Invest in Bottom-Basement Gold – Seeking Alpha

By Mike Caggeso  of Monday Morning

By Mike Caggeso

Gold hit two historic milestones in 2008.

First, in early March, the “yellow metal” hit its all-time high of $1,030 an ounce.

Just three months later, the price of gold for December delivery had plummeted to $681 an ounce, a 21-month low and 33.9% drop from its record high.

Most gold bugs were equal parts puzzled and brokenhearted. The world’s stock markets tanked, as did some of its biggest economies. In such an environment, they thought, gold should have risen. After all, gold is widely considered to be a safe-haven investment when everything else is spiraling south. 

However, Money Morning Contributing Editor Martin Hutchinson understood perfectly what other investors did not.

“Gold is not a safe haven against recession,” said Hutchinson. “It’s a safe haven against inflation.”

In the past year, commodities prices skyrocketed – across the board. That was especially true of oil, which hit a record high $147 a barrel. Corn, wheat, and soybeans all hit record highs, as well.

That price escalation tightened household and corporate budgets, and was a primary reason why the U.S. economy posted a gross-domestic product (GDP) decline of 0.3%. With that negative growth, the third quarter was the beginning of what many experts believe will be the nation’s first recession since 2001.

However, the inflation epidemic has waned significantly, as global demand for raw materials has plummeted. Price for such staple foods as corn, soybeans and wheat have all come down from their record highs – in near-lockstep fashion.

Corn futures are down nearly 50% from their summer high of $8 per bushel. The same is true of soybeans and wheat, with each having lost roughly half their value. In fact, wheat hit a 16-month low in mid-October.

As most of us noticed, gas prices have fallen 48% from their July 17 high of $4.114 a gallon.

And not coincidentally, gold has fallen 22% in that same time frame.

However, this report examines the pending commodities rebound – a projected slow-and-steady increase in commodity prices that will reverse the breakneck plunge below fair value that commodities have experienced for much of this year.

Our objective now: To chart the expected path of gold prices in the New Year.

This report also reveals another wild card inflationary indicator that Hutchinson believes will carry gold prices to $1,500 an ounce by the end of 2009.

Two Catalysts For Gold’s Climb

The U.S. Department of Agriculture’s Oct. 10 Crop Production Report said acreage for a handful of staple food commodities has shrunk:

  • Corn acreage fell 1.2%.
  • Soybean acreage dropped 1.4%.
  • Canola acreage dropped 1.9%.
  • Sunflower acreage shrank 0.8%.
  • And acreage of dry edible beans fell 0.7%.

That naturally translates to higher prices because it squeezes the supply of the particular commodity. And it does so at a time when demand continues to escalate from populations in China, India and Latin America. And higher prices equal inflation.

But Hutchinson – who correctly predicted this last run-up in gold prices – says there’s another catalyst that’s right now inherent in the U.S. economy that could help vault gold prices to $1,500 an ounce by the end of 2009. And it has to do with the much-ballyhooed $700 billion rescue plan.

The philosophy behind the rescue plan is elegantly simple: By providing a portion of the $700 billion to foundering U.S banks, the Treasury Department believed it could provide banks with badly needed capital, and get them to start lending money once again – jump-starting the economy in the process.

Since September 2007, U.S. Federal Reserve policymakers have cut the benchmark Federal Funds target rate nine times – from 5.25% down to the current 1.0% rate – to increase bank-to-bank lending and bank-to-consumer lending.

“The government is pumping money in so many banks, and that money has to come out somewhere,” Hutchinson said.

Right now, banks aren’t boosting lending. Instead, they are using the cash to finance buyouts of other banks. Even so, that money will “come out” into the economy in the form of higher stock prices for banks. That will make consumer/investors wealthier, and could make them more confident in the economy. If they’re more confident, they will spend. As that happens, food prices should begin ticking upward, adding another set of thrusters to gold prices.

“Everybody thinks that because we’re having a horrible recession, we’re not going to have inflation. I think that’s probably wrong,” Hutchinson said. “I think gold has quite good hidden-store value.”

As gold prices increase, count on more investors leaving the sidelines to invest, too, causing the surge in gold prices to accelerate and steepen.

“As gold goes up, it gets more popular and investors start piling into it,” Hutchinson said.  

And if gold gets anywhere near the $1,500 mark, sell. Prices that high will likely fall back or plateau as the Federal Reserve begins raising interest rates and strengthening the U.S. dollar, Hutchinson said.

Five Ways to Play Bottom-Basement Gold

Before we get too far ahead of ourselves, let’s first look at five ways to play bargain-basement gold prices.

The SPDR Gold Trust ETF (GLD) – formerly StreetTracks Gold – is a fund whose shares are intended to parallel the movement of gold prices. Since gold prices started falling along with gas prices, SPDR Gold Trust has stayed within a 0.5% margin of gold prices. This exchange-traded fund (ETF) eliminates any investor concern over storage and delivery while giving them exactly what they want – gold.

Toronto-based Barrick Gold Corp. (ABX) has 27 mines, mostly in North America and South America, and is developing or exploring 11 more. With a market cap of more than $20 billion, it has considerably more liquidity than most mining companies. Barrick is primarily a gold miner, but it also has copper and zinc mining operations. As far as investors are concerned, there are two ways to look at that: It’s not a pure play, per se, but then again, this is a company stock, not a bar of bullion. Also, having operations other than gold can help stabilize the company’s bottom line in case problems arise at a gold mine.

Denver-based Newmont Mining Corp. (NEM) is primarily a gold producer with operations in the United States, Australia, Peru, Indonesia, Canada, New Zealand and Mexico. Its reserves are hovering around 86.5 million ounces. Like Barrick, this is a mining stock play, and is subject to market swings – as well as fluctuations in gold prices. That can be a significant tailwind, especially if you believe the stock market has bottomed out or is close to doing so. Hutchinson – forever a value-oriented investor – warned that Newmont might be a little too pricey now. Investors may want to wait for the company’s stock price to settle before getting in.

Hutchinson thinks the best value for a gold mining stock can be found in Yamana Gold Inc. (AUY), another Toronto-based company that’s small now, but has rapidly expanding production. 

But for investors who just want gold – not an ETF or stock – the best avenue is an EverBank Select Metals Account: EverBank accounts has a minimum deposit that is 98% lower than its competitors, and its commission costs are up to 86% lower than other metals’ brokers and bullion banks. It offers two types of gold accounts: Unallocated (your purchased gold is pooled with that of other investors, eliminating storage and maintenance costs; the minimum deposit is $5,000), and Allocated (you directly own the gold you purchase, held in your own private account; $7,500 is the minimum deposit here).

Both types of accounts can be set up 24/7 online. But if you prefer the phone, call 866-326-6241, and be sure to give them the code 12608 when setting up an account.

We should point out that the publisher of Money Morning has a marketing relationship with EverBank, but that’s because its products are among the best in class.

Original post

Share this:

  • Click to share on Reddit (Opens in new window) Reddit
  • Click to share on Facebook (Opens in new window) Facebook
  • Click to share on LinkedIn (Opens in new window) LinkedIn
  • More
  • Click to share on X (Opens in new window) X
  • Click to share on Pinterest (Opens in new window) Pinterest
  • Click to share on Tumblr (Opens in new window) Tumblr
  • Click to print (Opens in new window) Print
  • Click to email a link to a friend (Opens in new window) Email
Like Loading...

Simple Moving Averages Make Trends Stand Out

17 Monday Nov 2008

Posted by jschulmansr in Bollinger Bands, commodities, Copper, Currency and Currencies, deflation, Finance, gold, hard assets, inflation, Investing, investments, Latest News, Markets, mining stocks, Moving Averages, oil, precious metals, silver, Technical Analysis, Today, U.S. Dollar, Uncategorized, uranium, Water

≈ Comments Off on Simple Moving Averages Make Trends Stand Out

Tags

agricultural commodities, alternate energy, Austrian school, banking crisis, banks, bear market, bear stearns, Bollinger Bands, bull market, capitalism, central banks, China, Comex, commodities, communism, Copper, Currencies, currency, deflation, depression, diamonds, dollar denominated, dollar denominated investments, economic, economic trends, economy, financial, Forex, futures, futures markets, gold, gold miners, hard assets, heating oil, India, inflation, investments, market crash, Markets, mining companies, Moving Averages, natural gas, oil, palladium, physical gold, platinum, platinum miners, precious metals, price, price manipulation, prices, producers, production, protection, rare earth metals, recession, risk, run on banks, safety, silver, silver miners, socialism, sovereign, spot, spot price, stagflation, Technical Analysis, timber, U.S. Dollar, volatility, Water

Simple Moving Averages Make Trends Stand Out

By: John Devcic of BK TRADER FX    The 5 Things That Move The Currency Market

Moving averages are one of the most popular and often-used technical indicators. The moving average is easy to calculate and, once plotted on a chart, is a powerful visual trend-spotting tool. You will often hear about three types of moving average: simple, exponential and linear. The best place to start is by understanding the most basic: the simple moving average (SMA). Let’s take a look at this indicator and how it can help traders follow trends toward greater profits.

Trendlines
There can be no complete understanding of moving averages without an understanding of trends. A trend is simply a price that is continuing to move in a certain direction. There are only three real trends that a security can follow:

  • An uptrend, or bullish trend, means that the price is moving higher. 
  • A downtrend, or bearish trend, means the price is moving lower.  
  • A sideways trend, where the price is moving sideways.

The important thing to remember about trends is that prices rarely move in a straight line. Therefore, moving-average lines are used to help a trader more easily identify the direction of the trend. (For more advanced reading on this topic, see The Basics Of Bollinger Bands and Moving Average Envelopes: Refining A Popular Trading Tool.)

Moving Average Construction
The textbook definition of a moving average is an average price for a security using a specified time period. Let’s take the very popular 50-day moving average as an example. A 50-day moving average is calculated by taking the closing prices for the last 50 days of any security and adding them together. The result from the addition calculation is then divided by the number of periods, in this case 50. In order to continue to calculate the moving average on a daily basis, replace the oldest number with the most recent closing price and do the same math.

No matter how long or short of a moving average you are looking to plot, the basic calculations remain the same. The change will be in the number of closing prices you use. So, for example, a 200-day moving average is the closing price for 200 days summed together and then divided by 200. You will see all kinds of moving averages, from two-day moving averages to 250-day moving averages.

It is important to remember that you must have a certain number of closing prices to calculate the moving average. If a security is brand new or only a month old, you will not be able to do a 50-day moving average because you will not have a sufficient number of data points.

Also, it is important to note that we’ve chosen to use closing prices in the calculations, but moving averages can be calculated using monthly prices, weekly prices, opening prices or even intraday prices. (For more, see our Moving Averages tutorial.)

Figure 1: A simple moving average in Google Inc.
Source: StockCharts.com

Figure 1 is an example of a simple moving average on a stock chart of Google Inc. (Nasdaq:GOOG). The blue line represents a 50-day moving average. In the example above, you can see that the trend has been moving lower since late 2007. The price of Google shares fell below the 50-day moving average in January of 2008 and continued downward.

When the price crosses below a moving average, it can be used as a simple trading signal. A move below the moving average (as shown above) suggests that the bears are in control of the price action and that the asset will likely move lower. Conversely, a cross above a moving average suggests that the bulls are in control and that the price may be getting ready to make a move higher. (Read more in Track Stock Prices With Trendlines.)

Other Ways to Use Moving Averages           
Moving averages are used by many traders to not only identify a current trend but also as an entry and exit strategy. One of the simplest strategies relies on the crossing of two or more moving averages. The basic signal is given when the short-term average crosses above or below the longer term moving average. Two or more moving averages allow you to see a longer term trend compared to a shorter term moving average; it is also an easy method for determining whether the trend is gaining strength or if it is about to reverse. (For more on this method, read A Primer On The MACD.)

Figure 2: A long-term and shorter term moving average in Google Inc.
Source: StockCharts.com

Figure 2 uses two moving averages, one long-term (50-day, shown by the blue line) and the other shorter term (15-day, shown by the red line). This is the same Google chart shown in Figure 1, but with the addition of the two moving averages to illustrate the difference between the two lengths.

You’ll notice that the 50-day moving average is slower to adjust to price changes, because it uses more data points in its calculation. On the other hand, the 15-day moving average is quick to respond to price changes, because each value has a greater weighting in the calculation due to the relatively short time horizon. In this case, by using a cross strategy, you would watch for the 15-day average to cross below the 50-day moving average as an entry for a short position.

Figure 3: A three-month
Source: StockCharts.com

The above is a three-month chart of United States Oil (AMEX:USO) with two simple moving averages. The red line is the shorter, 15-day moving average, while the blue line represents the longer, 50-day moving average. Most traders will use the cross of the short-term moving average above the longer-term moving average to initiate a long position and identify the start of a bullish trend. (Learn more about applying this strategy in Trading The MACD Divergence.)

Support and Resistance
Support and resistance, or ceilings and floors, refer to the same thing in technical analysis.

  • Support is established when a price is trending downward. There is a point at which the selling pressure subsides and buyers are willing to step in. In other words, a floor is established.  
  • Resistance happens when a price is trending upward. There comes a point when the buying strength diminishes and the sellers step in. This would establish a ceiling. (For more explanation, read Support & Resistance Basics.)

In either case, a moving average may be able to signal an early support or resistance level. For example, if a security is drifting lower in an established uptrend, then it wouldn’t be surprising to see the stock find support at a long-term 200-day moving average. On the other hand, if the price is trending lower, many traders will watch for the stock to bounce off the resistance of major moving averages (50-day, 100-day, 200-day SMAs). (For more on using support and resistance to identify trends, read Trend-Spotting With The Accumulation/Distribution Line.)

Conclusion
Moving averages are powerful tools. A simple moving average is easy to calculate, which allows it to be employed fairly quickly and easily. A moving average’s greatest strength is its ability to help a trader identify a current trend or spot a possible trend reversal. Moving averages can also identify a level of support or resistance for the security, or act as a simple entry or exit signal. How you choose to use moving averages is entirely up to you.

For further reading on moving averages, check out Simple Moving Averages And Volume Rate-Of-Change and Basics Of Weighted Moving Averages.

by John Devcic, (Contact Author | Biography)

John Devcic is a freelance writer, market historian and private speculator. After investing in a mutual fund right out of high school and losing his initial investment of $350, Devcic began to believe he could do better with his money then the so-called experts could. Over the years a healthy and sometimes unhealthy obsession with how the markets work and how they worked in the past has made Devcic a true market historian. He reminds himself at all times that the market – while ever-changing – always seems to repeat itself.

Share this:

  • Click to share on Reddit (Opens in new window) Reddit
  • Click to share on Facebook (Opens in new window) Facebook
  • Click to share on LinkedIn (Opens in new window) LinkedIn
  • More
  • Click to share on X (Opens in new window) X
  • Click to share on Pinterest (Opens in new window) Pinterest
  • Click to share on Tumblr (Opens in new window) Tumblr
  • Click to print (Opens in new window) Print
  • Click to email a link to a friend (Opens in new window) Email
Like Loading...

Happy Birthday GLD: Gold ETF Excels Four Years Out – Seeking Alpha

17 Monday Nov 2008

Posted by jschulmansr in commodities, deflation, Finance, gold, hard assets, inflation, Investing, investments, Latest News, Markets, precious metals, Uncategorized

≈ 1 Comment

Tags

agricultural commodities, alternate energy, Austrian school, banking crisis, banks, bear market, bear stearns, bull market, capitalism, central banks, China, Comex, commodities, communism, Copper, deflation, depression, diamonds, dollar denominated, dollar denominated investments, economic, economic trends, economy, financial, futures, futures markets, gold, gold miners, hard assets, heating oil, India, inflation, investments, market crash, Markets, mining companies, natural gas, oil, palladium, physical gold, platinum, platinum miners, precious metals, price, price manipulation, prices, producers, production, protection, rare earth metals, recession, risk, run on banks, safety, silver, silver miners, socialism, sovereign, spot, spot price, stagflation, timber, U.S. Dollar, volatility, Water

Happy Birthday GLD: Gold ETF Excels Four Years Out – Seeking Alpha

By Adam Hamilton of Zeal Speculation and Investment

Amidst our seemingly endless slog through today’s dark sentiment wastelands plaguing the markets, we have a birthday to celebrate. Four years ago this week, a revolutionary ETF was launched that forever changed trading dynamics within the global gold market. Known today as the SPDR Gold Shares, GLD has been wildly successful by any measure.

GLD’s rise to fame has not been easy. While a few contrarians loved the idea of a gold ETF as a way to broaden investor participation in this gold bull, many investors were very skeptical. Some were downright hostile. Although rehashing all these obstacles GLD has faced is beyond the scope of this essay, I wrote about a gold ETF in 2002 years before GLD hit the market and also GLD itself in early 2006, late 2006, and late 2007. These past essays can still fill you in on GLD’s history and dispel many myths surrounding it.

GLD has overcome much to become not only a juggernaut in the gold world, but in the entire ETF world as well. Last week, GLD was the 3rd largest ETF on the planet with $18b worth of net assets (physical gold bullion in its vaults)! Only the (SPY) S&P 500 ETF and the (EFA) large-cap foreign stocks ETF were larger. GLD is bigger than the famous (QQQQ) NASDAQ 100 ETF, the (DIA) Dow 30 ETF, the (XLF) S&P 500 financial stocks ETF, and the (XLE) S&P 500 energy stocks ETF. GLD is huge!

In order to become the 3rd largest ETF in the US out of a universe now exceeding 800, GLD’s custodians have had to execute on their mission exceedingly well. GLD is simply designed to track the price of gold. It grants stock traders an easy and efficient way to add gold exposure to their portfolios. As I’ve discussed extensively in my past GLD essays, it is not a substitute for physical gold coins as the foundation for a long-term investment portfolio. But it’s not meant to be. It is for mainstreamers not well-versed in gold.

GLD’s advantages to traders are legion. It can be bought and sold instantly in any standard stock account, for trivial stock-trading commissions. It can be shorted if one expects a gold correction. A high-volume and highly liquid GLD options market has also sprung up, providing more sophisticated traders with excellent tools to exploit projected gold moves via stock options. GLD is inarguably the easiest and quickest way to get gold exposure.

And GLD’s contribution to this gold bull has been massive as well, driving the gold price higher for all gold investors whether they own GLD or not. It radically widened investor participation in this gold bull, creating a direct conduit for vast pools of stock-market capital to chase gold. And chase gold it has. As of this week, GLD held an amazing 749 tonnes of physical gold bullion in trust for its investors!

This is a staggering amount of the yellow metal and difficult to understand without context. Traditionally, the largest gold holders are the national central banks of the world. Around 100 countries own gold bullion. If you put GLD in this list of elite central banks, it holds more gold today than all but 7! And after it merely grows another 2.1%, GLD will overtake Japan to become the 7th largest gold holder on the planet.

But although GLD is massive in the world of gold, it remains very small relative to the financial markets. With its $18b market cap last week, 118 individual companies in the S&P 500 are each bigger than it. This is even more impressive considering these companies’ market caps were considered from severely depressed end-of-October levels. The top 20% of the S&P 500, the elite S&P 100 companies, collectively had a $5935b market cap at the end of last month. So GLD has plenty of room to grow despite its size.

By acting as a conduit between stock-market capital and physical gold itself, GLD has really changed the dynamics of the world gold trade. There are many other gold ETFs around the world, but GLD has something like 85% of the total assets of all the world’s gold ETFs. It is the only individual gold ETF that really matters. So in this series of essays I have been studying GLD’s ongoing market impact since its launch.

This first chart plots GLD’s holdings since its birth on November 18th, 2004. I like to compare GLD’s gold bullion held in trust with the performance of the price of gold, slaved to the right axis. Not only is multiplying its initial holdings by 94.3x as of mid-October utterly remarkable, but the way these gold holdings have grown is fascinating. They have been far more stable than even GLD’s most optimistic proponents, including me, originally expected at launch.

While GLD’s holdings have indeed contracted modestly from time to time, its strategic growth trajectory has been tremendously impressive. GLD’s gold has climbed in a somewhat stair-stepped fashion. Of course when gold is surging in a powerful upleg, interest in gold investment is high and GLD grows rapidly. But provocatively, even when gold is not surging, GLD still tends to grow moderately on balance.

If you carefully examine every sharp correction suffered by gold above, within them GLD’s holdings really don’t fall all that much on a percentage basis. I would have expected much larger declines during gold corrections when GLD was born. Also interesting is GLD’s behavior during the long, grinding, sideways consolidations in gold that bleed away enthusiasm. It still exhibited moderate growth during these slow times. This performance is stellar, GLD is truly a rock star.

To understand why, consider how tracking ETFs work. To match percentage moves in the price of its underlying asset, a tracking ETF has to see similar supply-and-demand pressures. But supply and demand for GLD shares from stock traders doesn’t necessarily match that of gold futures from futures traders. So in order for GLD to fulfill its mission, GLD’s custodians must actively augment or retard GLD supply to ensure this ETF tracks its underlying asset’s moves tightly. This isn’t easy.

If stock traders demand relatively more GLD than futures traders are buying gold, GLD’s price will decouple from gold to the upside. GLD’s custodians have to vent this excess demand into the physical gold market in order to equalize the demand pressure differential. So when GLD demand exceeds gold demand, they issue new GLD shares and use the proceeds to buy physical gold bullion. This works simultaneously on two fronts. Increasing GLD share supply absorbs the outsized ETF buying pressure and then buying gold with the resulting stock-market capital forces its price to rise more in line with GLD.

So whenever you see GLD’s bullion holdings rise in these charts, it means stock traders were buying GLD at a faster rate than futures traders were buying gold. And as you can see, outside of a few minor pullbacks, GLD’s holdings have grown relentlessly. This means GLD is becoming ever-more popular and stock traders are buying it up at a faster rate than underlying gold demand. So GLD must issue shares and buy gold to ensure this ETF keeps tracking gold closely.

Now shunting stock-market capital directly into gold is wonderful when ETF demand is expanding. It has accelerated this secular gold bull. But the massive pools of stock-market capital having access to gold is a sharp double-edged sword. If stock traders ever start selling GLD at a faster rate than gold futures selling, GLD will be forced to contract its holdings. If it doesn’t, GLD will decouple from gold to the downside and fail its mission.

If excessive GLD shares are being dumped on the market and it is falling faster than gold, GLD’s custodians have to buy back this excess supply. Where do they get the cash? By selling gold bullion. This works two ways as well. Selling physical gold forces stock-market selling pressure on GLD into the physical market to equalize the differential. And then using the resulting proceeds to buy back GLD shares neutralizes the excessive ETF selling pressure and keeps GLD tracking gold.

So when (not if) a big disproportionate sustained GLD selloff happens in the future, it will lead to gold falling much faster and farther than it would have if stock-market capital wasn’t deployed in it. Personally I’m glad stock investors can get gold exposure via GLD. Yes, it increases upside and downside volatility. But this is typical as secular bulls evolve. The higher a price goes, the more capital gets interested in chasing it. The more capital flooding into a market, the more volatility it generates. Even without GLD, gold volatility would still gradually increase.

But rather impressively, so far we haven’t seen the massive unwinding of GLD positions that many gold investors understandably fear. GLD’s holdings have grown steadily and relentlessly for 4 years running now. And this has happened through mighty uplegs, wickedly fast and brutal corrections, and long grinding consolidations. As long as demand for GLD continues to grow faster than demand growth for gold itself, GLD will have to continue ramping up its vast holdings.

And with GLD’s holdings running at just 0.2% of the market cap of the S&P 500 at the end of last month, there is lots of room to grow. As more stock investors realize the importance of having some gold exposure in their portfolios, many will buy some GLD shares. At 1% of US portfolios, GLD would have to grow 5x bigger from here. This is not an aggressive or unrealistic expectation within a secular gold bull. At 3% of US portfolios, it would have to expand by 15x. This would make it the world’s largest gold holder by far.

Many hardcore physical-gold-coin investors, including me, have long wondered how GLD owners’ resolve would weather a severe correction in gold. Would they panic and dump GLD, exacerbating the decline in gold? Or would they hold steady? Since GLD is such a trivial part of the aggregate portfolio of all US investors, maybe it is just too inconsequential to bother selling. At any rate, this past year was a great test for GLD owners. Gold was crushed, yet GLD still didn’t see disproportional selling. This chart zooms in.

When gold powered from around $750 in October 2007 to just over $1000 in mid-March, it is no surprise GLD’s holdings were growing. Everyone, especially non-contrarian mainstreamers, loves a hot investment. GLD’s holdings grew to an all-time high of 664 metric tons. But gold cracked on a Fed rate cut surprise (75bp instead of the 100bp expected) in mid-March and plunged 15.3% by early May. Did this spook GLD owners? Darned right it did! Check out the sharp drop in GLD’s holdings over this period.

Since GLD owners were selling this ETF at a faster rate than the futures guys were hitting gold itself, GLD’s holdings fell 12.6% over this span. Having this giant ETF release 1/8th of its physical bullion into the market certainly exacerbated this correction. But interestingly as soon as gold stabilized, so did GLD’s holdings. They held flat near 600t until mid-June when gold started rallying again. Remember that as long as GLD’s supply-and-demand trends match gold’s, no changes in holdings are necessary.

From mid-June to mid-July as Fannie Mae and Freddie Mac were failing, gold powered 12.6% higher. Even though gold itself couldn’t best its $1005 mid-March high, GLD’s holdings easily surged well above their March levels to new records. Over this same 5-week span GLD’s gold bullion held in trust soared by 17.5%! Stock traders were buying GLD far faster than gold itself was rising, so this ETF’s custodian shunted this excess demand into physical gold.

From mid-July to mid-September, gold took a massive 23.8% beating. It was brutal, the worst correction of this gold bull. If there was ever a time for the “weak hands” owning GLD to panic, this was it. And while GLD selling was indeed excessive so its custodians had to sell gold bullion to buy back GLD shares to maintain tracking, GLD’s holdings still only fell 12.5%. This is about half as much as gold fell, not too bad. GLD owners didn’t get as scared as I thought they would in such a massive gold correction.

Gold rallied strongly out of its mid-September lows. In fact, on September 17th it rocketed 11.1% higher on a single trading day! It was one of gold’s biggest daily gains ever in percentage terms. This extraordinary move happening on a day when the S&P 500 fell 4.7% drove tremendous interest in GLD. Stock investors flooded into it at a much faster rate than futures traders were buying gold. That day alone GLD bought 36 tonnes of gold, growing its hoard by 5.9%!

In early October as the financial panic hit, gold got sucked into it. Everything was sold due to margin calls, forced fund redemptions, deleveraging, and fear. Sadly gold was sold as well. I recently wrote an essay on this curious selloff if you are interested. From early October until this week, gold plummeted another 22.4%. If this didn’t terrify GLD owners, nothing will. Here we had a once-in-a-generation financial-market panic and gold failed to soar as expected. Its selloff was a terribly depressing development.

But GLD owners didn’t panic. Their resolve was very impressive. At worst, GLD only had to shed 3.1% of its holdings during this steep gold selloff! Even afterwards this week, GLD’s bullion was still merely near 6-week lows and not far from its all-time high achieved in mid-October. If GLD investors were tough enough not to panic in 2008, a year of extraordinarily brutal and recurring gold selloffs, then I doubt they are a big threat in a more normal gold correction not driven by an exceedingly rare global financial panic.

The net result of all this? Check out the trends on this chart. Gold itself has been in a miserable downtrend since mid-March. It even fell under support in August, September, October, and November. Even long-time hardcore gold investors have had a tough time dealing with this psychologically. Yet despite such a rotten price and sentiment environment, GLD’s holdings have been in an uptrend this past year! Indeed GLD’s holdings soared to new all-time highs twice even after gold had started correcting aggressively.

In recent weeks, GLD’s holdings have been discussed in contrarian circles. If gold fell below a certain price, would GLD owners exit en masse? If they did, gold would plummet of course. GLD would have to shed gold fast to buy excessive GLD share supply. In a worst-case panic scenario, GLD could conceivably dump hundreds of tonnes of gold onto the markets in a matter of weeks. Some have likened it to a “rogue central bank” due to this dire potential.

Is this GLD-as-a-rogue-central-bank-like-selling-vehicle possible? Sure, anything is possible in the markets. But is it likely? Certainly not if 2008’s strong GLD holdings performance truly reflects GLD owners’ resolve. And this makes sense. Despite GLD’s large size relative to gold, it is trivial relative to stocks. An average mainstream investor owns so little GLD that it isn’t even worth worrying about for that particular investor. GLD owners passed 2008’s tough tests with flying colors.

Another way I’ve watched GLD evolve over the years is through its trading volume. The more popular it gets, the more its volume grows. This is true both in terms of absolute share volume and capital volume. Capital volume is price multiplied by share volume. Trading 10m shares of GLD in the $40s is not the same as trading 10m shares of GLD in the $80s. Traders’ interest in and usage of GLD is soaring.

In addition to the raw daily GLD share volume in red, this time I added a quarterly-average-volume line in yellow. This yellow line distills out a lot of the random noise and shows the steady growth of absolute daily volume in GLD. Interestingly it even continued growing on balance in Q2 and Q3 2008 in the midst of gold’s latest correction. Growing volume is a sign of a healthy bull capturing the attention of more and more traders. And of course capital volume is growing even faster than share volume due to gold’s higher prevailing prices over the lifespan of this ETF.

Provocatively, GLD had one giant volume spike that wouldn’t fit on this chart. On September 17th it rocketed to 66m shares and the next day it remained incredible at 61m shares. As you can see, this is way beyond GLD’s precedent. What drove this superspike? In past GLD essays, I’ve observed that big gold selloffs can lead to outsized GLD volume spikes. Gold plunges on a given day, GLD traders get scared, and they sell aggressively.

But in mid-September 2008, it was a monster rally that drove GLD volume rather than a selloff. That was the day that gold soared 11.1% in its biggest daily rally in 28 years. This offers another important glimpse into GLD owners’ psyches. When gold soared, enough traders knew about GLD to buy it aggressively. This probably reflects a lot of latent interest in this gold bull among stock traders that is usually overlooked. GLD’s custodians’ performance in keeping GLD tracking gold through such a big and fast surge in demand is very impressive.

This last chart explores the variance between gold itself and GLD. While it seems silly now after 4 years, back in the initial months of GLD’s life naysayers warned it would fail in tracking gold. They thought no one could be nimble enough to actively shunt stock-market capital into and out of gold fast enough to keep an ETF tracking this metal. Thankfully time has proven these fears unfounded, just like most of the other fears surrounding this unique trading vehicle.

Over its entire lifespan, GLD’s daily correlation r-square with gold has run a staggering 99.98%! And yes, this is the r-square and not the raw correlation coefficient itself. It simply could not be any higher. From a stock trader’s perspective, for all intents and purposes GLD’s performance was identical to gold’s. It has fulfilled its mission of tracking gold’s movements perfectly. GLD is a great trading proxy for gold itself.

Early on, GLD tracked gold’s absolute levels more tightly than it does today. The yellow line above is the GLD price multiplied by 10, since each GLD share represents a tenth of an ounce of gold held in trust. As you can see above, this yellow line is falling farther behind the blue gold line as GLD ages. This is totally normal and reflects GLD’s expense ratio. All ETFs charge a small fee for their services, and in GLD’s case this is 0.4% per year.

In return for providing the excellent trading vehicle that GLD has proven to be, its custodians have the right to earn a reasonable profit from their hard work. So each year they sell 0.4% of this ETF’s gold to cover their expenses and earn a profit. This management fee is evident in GLD’s tracking of gold. The red downtrend above shows the 5-day moving average of GLD’s daily variance to gold itself. Its generally tight downtrend proves GLD’s custodians have been doing an excellent job in keeping GLD aligned with gold.

This variance downtrend is the direct result of that 0.4% expense ratio. If you go out 1 year after inception, this downtrend is centered near -0.4%. At 2 years, it is around -0.8%. Not only is 0.4% a year very reasonable for running GLD, there haven’t been any surprises. Like all ETFs, GLD’s net-asset value per share is shrinking slightly every year. But GLD is still deftly fulfilling its mission of tracking gold and providing easy and efficient access to gold exposure for stock-market capital.

Whether GLD is something you own, want to own, or wouldn’t touch with a ten-foot pole because you favor other forms of gold, ultimately it has been very good for this gold bull. All gold investors, regardless of their own investment preferences, want more capital to follow them into gold. We don’t care where this capital comes from, we just want the buying pressure. By creating a conduit between the stock markets and physical gold, GLD has succeeded in radically broadening investor participation in just 4 years.

And as long as this secular gold bull remains intact, GLD should only help gold on balance. The financial panic has driven up investment demand for gold, as GLD’s soaring holdings amidst a falling gold price vividly illustrate. And global mined gold supplies were already falling for years even before gold started correcting and the financial crisis hit. With gold miners’ decimated stock prices and the insurmountable difficulties in getting debt and equity financing today, gold mined supplies’ contraction will accelerate.

On top of this, according to Forbes the US government alone is on the hook for $5 trillion in bailouts so far! Much of this bailout money will be created by the Fed out of thin air and eventually filter into the real economy. And when it does, boy inflation is going to skyrocket. If you think GLD has been popular for the past 4 years, imagine how much more it will be over the next 4 if headline CPI inflation doubles or triples thanks to these asinine socialist bailout schemes? GLD should grow many times over from here.

At Zeal we have long been strategic investors and speculators unswayed by irrational paranoia. Cold hard facts are all that matter, not the endless permutations of wild conspiracy theories. Years before any gold ETF existed, I wrote about how great one would be to broaden gold participation into the mainstream. And since GLD launched, I have fought the many silly myths used to scare investors away from this innovative trading vehicle. GLD has been great for this gold bull!

Today more than ever, investors and speculators need clear thinking and sound analysis untainted by the shrill emotions ruling the day. While the markets are illogical now, they won’t be for long. Panics never persist, but they drive great once-in-a-lifetime bargains that shrewd investors and speculators can capitalize on. If you are tired of being ruled over or unduly influenced by the shifting tides of popular sentiment, join us today. Subscribe to our acclaimed monthly newsletter to grow your market wisdom!

The bottom line is GLD has been a smashing success. By excelling in its mission of tracking gold and providing an easy and efficient way to grant gold exposure to mainstream stock investors, it has grown into the 3rd largest ETF on the planet. And this is even more impressive considering the heavy skepticism and withering attacks on GLD launched from fringe factions within the traditionally pro-gold community.

Whether you or I would own GLD personally or not is irrelevant. The point is many nontraditional gold investors have flocked to GLD and this trend should only accelerate. Broader participation in this gold bull, more capital from more origins bidding up gold, greatly benefits all gold investors. And as 2008 has shown, GLD owners aren’t anywhere near as skittish in a gold selloff as many assumed they would be.

Disclosure: Long GLD.

Share this:

  • Click to share on Reddit (Opens in new window) Reddit
  • Click to share on Facebook (Opens in new window) Facebook
  • Click to share on LinkedIn (Opens in new window) LinkedIn
  • More
  • Click to share on X (Opens in new window) X
  • Click to share on Pinterest (Opens in new window) Pinterest
  • Click to share on Tumblr (Opens in new window) Tumblr
  • Click to print (Opens in new window) Print
  • Click to email a link to a friend (Opens in new window) Email
Like Loading...

Governments Reflate and Gold Will Rise!

14 Friday Nov 2008

Posted by jschulmansr in capitalism, commodities, Copper, deflation, Finance, gold, hard assets, inflation, Investing, investments, Latest News, Markets, mining stocks, oil, Politics, precious metals, silver, Today, U.S. Dollar, Uncategorized, uranium

≈ Comments Off on Governments Reflate and Gold Will Rise!

Tags

agricultural commodities, alternate energy, Austrian school, banking crisis, banks, bear market, bear stearns, bull market, capitalism, central banks, China, Comex, commodities, communism, Copper, deflation, depression, diamonds, dollar denominated, dollar denominated investments, economic, economic trends, economy, financial, futures, futures markets, gold, gold miners, hard assets, heating oil, India, inflation, investments, market crash, Markets, mining companies, natural gas, oil, palladium, physical gold, platinum, platinum miners, precious metals, price, price manipulation, prices, producers, production, protection, rare earth metals, recession, risk, run on banks, safety, silver, silver miners, socialism, sovereign, spot, spot price, stagflation, timber, U.S. Dollar, volatility, Water

Governments Reflate and Gold Will Rise!

Source: GoldForecaster.com   and The Gold Report 11/14/2008

 
A long and deep recession, possibly a depression is being forecast across a broad front. But the real picture is different. Governments and central banks are not only committed to doing all in their power to resurrect growth and give their different economies ‘traction’ but have begun the vigorous implementation of reflation. They will do “whatever it takes” to get growth and confidence re-established globally. In essence, the crisis appeared quickly and devastatingly out of greedy lending by banks loaning to uncreditworthy individuals on a broad front. It has to be rectified just as quickly because banks control the lifeblood of liquidity in the economy and they will place their financial health well before that of the broad economy and their customers. They have been saved by central banks to date, but it is resumption of growth and confidence, not healthy banks, that must be achieved first. In the major economic blocs of the world actions are underway, to differing degrees, to force the banks to lend or be bypassed, so that the damage they can inflict on growth, through congealed debt and their instruments, is neutralized. The banks have made it opaquely clear, that they will not lend in such a way as to rectify the underlying crises of a dropping housing market and its ‘ripple’ effects on consumer spending. Governments do see banks as an obstacle to the resuscitation of growth and confidence, so their powerful influence over the state of the economy has to be reduced considerably before this can be done. And it has to be done before any semblance of recovery can be achieved again. The longer the process takes the more difficult and lengthy the solution will be.

Just take a look at the world’s three main economic bloc’s efforts at stimulating growth again:-

  • China said it would spend an estimated $586 billion over the next two years, roughly 7% of its gross domestic product each year, to construct new railways, subways and airports and to rebuild communities devastated by the May 2008 earthquake in the southwest. Their reasoning is as follows, “Over the past two months, the global financial crisis has been intensifying daily,” the State Council said. “In expanding investment, we must be fast and heavy-handed.” But in China, much of the capital for infrastructure improvements comes not from central and local governments, but from state banks and state-owned companies that are told to expand more rapidly. China maintains far more control over investment trends than the U.S. does, so they can unleash investments to counter a sharp downturn. The Chinese government said the stimulus would cover 10 areas, including low-income housing, electricity, water, rural infrastructure and projects aimed at environmental protection and technological innovation, all of which could incite consumer spending and bolster the economy. The State Council said the new spending would begin immediately, with $18 billion scheduled for the last quarter of this year. In addition, China has already announced a drastic increase of the minimum purchasing price for wheat from next year, by as much as 15.3%. There is also going to be a substantial increase of the purchasing prices for rice, said the National Development and Reform Commission. In the meantime, they also announced plans to stabilize prices for fertilizers and other agricultural means of production, to ensure that the grain price increase will not be eaten away by input making the price increases real income gains for farmers. This will shore up domestic demand and head off any social unrest in the rapidly growing economy. The government there sees its task to harness all sides of the economy to produce growth while they pull their 1.4 billion people out of poverty. Their recent history confirms their ability to succeed!
  • In Europe, with a more Socialist environment than the U.S.A., [meaning greater central government control over the economy], we believe that after bailing out so many European banks, a very heavy pressure will be put on banks to vigorously lend down to street level again. President Sarkozy’s threat to seize banks that don’t lend gives meat to this forecast. In Britain, nationalization lies ahead of suffering banks and the end of senior executive careers, if they don’t lend freely. Despite the lack of the same effective management [ignoring politics and commerce and other capitalist principles] of the economy in Europe as in China, governments will act in the same way as the Chinese are, eventually, to make growth and confidence happen again. They are committed to this, at last. So 2009 will be the year of reflation in the face of deflation.
  • In the U.S.A., such synthesis of national institutions in fighting deflation is unlikely as the cooperation of banking, commerce, etc to focus on the underlying economic crisis would barge into so many valued principles fought for, over time. However, we have no doubt that the intransigence of such principles in the face of a decaying economy will produce overwhelming pressures on the system to revitalize the consumer and restore his spending. The government has now seen the banks follow the “profit and prudence” principles after their bailouts and their holding back on lending to safeguard themselves, first. Secretary Paulson has now faced off with them and redirected efforts to make government provided financial relief go direct to the consumer. But he is only at the beginning of this process, which must be across the entire spectrum of consumers, not simply a portion of clients of the largest mortgage providers, Fannie Mae and Freddie Mac. Indeed, the slow nature of this solution as it wends its way through political and financial obstacles, could produce a near revolutionary climate, until sufficient action is taken to re-finance the economy from consumer upwards. After all, day-by-day, solid U.S. citizens are being impoverished by the financial sector problems, not their own. As slow as the pace of support becomes, the more degenerative impact it will have on uncertainty and confidence. We have no doubt that 2009 will be remembered as the year of reflation in the face of deflation. Already, house-owning households are likely to receive direct financial aid, if their mortgages are more than 38% of income. If this is applied to all U.S. households in this position we fully expect to see hope lead to confidence, then spending, then growth. These and the suggested support of the consumer on car finance and credit cards will re-kindle spending and the economy. Such moves must convince the U.S. consumer and stop him thinking like a victim. [In the Depression of the early thirties the U.S. used, as part of its battery of tactics, paying people to dig holes and fill them in again, just to get money flowing from ground level up]. This can be implemented in the next few months and impact on the broad economy by the end of the first half of 2009, if applied properly, as government implies it wants to. If it is, then the first 100 days of President Obama will indeed be a honeymoon.


The Importance of Growth

Mr. Ben Bernanke and the governments of the U.S., the Eurozone and China have recognized in no uncertain way that confidence must be regained before growth gains traction and becomes self-sustaining. It appears that they have got the message now and will do whatever it takes to ensure the credit crisis is replaced by confidence in credit. That the banks should suffer for their indiscreet past behavior is just, for a lender should carry the same risk as a borrower.

Inflation and Gold and Silver Prices

  • Reflation is vigorously being implemented across the globe, but inevitably it will come with inflation. It is impossible to say just how much money needs to be printed to counter deflation, but for sure it will be more than needed and will keep flowing until the financial sun is shining again. 2009 will probably not see inflation rise to dangerous levels, because of its absorption by deflation. But as the money fills deflationary holes, it will spread far and wide and eat into the value of debt, so bringing relief to troubled debtors in addition to direct governmental support. This will be found to be politically acceptable and will delay, if not remove, the pernicious impact of bad debt that we are seeing now. Growth and confidence are considerably more important problems than inflation. Banks have been given debt relief already and so will the consumer, because that is the only solution to the credit crunch. It will be accompanied by the cheapening of money, leading to far higher gold and silver prices than we are even contemplating now. As this is slowly realized by an ever-widening audience across the globe, gold will re-enter the mainstream of investments as an anchor to monetary values if only at individual levels. Thereafter institutions and perhaps central banks, will appreciate it fully?
  • Governments have to act very fast to stop the confidence-eating impact of deflation from becoming a way of life, just as borrowing was, over the last thirty years. Consequently expect global stimulation to be put in place before the end of the first quarter of 2009. In that time we fully expect forced selling of all assets to slow to a trickle. Thereafter a positive tone will benefit gold and silver in the long-term, as well as short-term.


Let’s be clear though, there is no historic precedent to what we are about to see.

We expect gold to thrive in an atmosphere of hope, against a threatening backdrop, with the gold price realistically discounting the diminishing buying power of paper currencies.

Gold Forecaster regularly covers all fundamental and Technical aspects of the gold price in the weekly newsletter. To subscribe, please visit www.GoldForecaster.com

Legal Notice / Disclaimer:
This document is not and should not be construed as an offer to sell or the solicitation of an offer to purchase or subscribe for any investment. Gold Forecaster – Global Watch / Julian D. W. Phillips / Peter Spina, have based this document on information obtained from sources it believes to be reliable but which it has not independently verified; Gold Forecaster – Global Watch / Julian D. W. Phillips / Peter Spina make no guarantee, representation or warranty and accepts no responsibility or liability as to its accuracy or completeness. Expressions of opinion are those of Gold Forecaster – Global Watch / Julian D. W. Phillips / Peter Spina only and are subject to change without notice. Gold Forecaster – Global Watch / Julian D. W. Phillips / Peter Spina assume no warranty, liability or guarantee for the current relevance, correctness or completeness of any information provided within this Report and will not be held liable for the consequence of reliance upon any opinion or statement contained herein or any omission. Furthermore, we assume no liability for any direct or indirect loss or damage or, in particular, for lost profit, which you may incur as a result of the use and existence of the information, provided within this Report.

Share this:

  • Click to share on Reddit (Opens in new window) Reddit
  • Click to share on Facebook (Opens in new window) Facebook
  • Click to share on LinkedIn (Opens in new window) LinkedIn
  • More
  • Click to share on X (Opens in new window) X
  • Click to share on Pinterest (Opens in new window) Pinterest
  • Click to share on Tumblr (Opens in new window) Tumblr
  • Click to print (Opens in new window) Print
  • Click to email a link to a friend (Opens in new window) Email
Like Loading...

Are We There Yet? Finding that Elusive Bottom – The Gold Report

14 Friday Nov 2008

Posted by jschulmansr in capitalism, commodities, Copper, deflation, Finance, gold, hard assets, inflation, Investing, investments, Latest News, Markets, precious metals, silver, Today, U.S. Dollar, Uncategorized, uranium

≈ Comments Off on Are We There Yet? Finding that Elusive Bottom – The Gold Report

Tags

agricultural commodities, alternate energy, Austrian school, banking crisis, banks, bear market, bear stearns, bull market, capitalism, central banks, China, Comex, commodities, communism, Copper, deflation, depression, diamonds, dollar denominated, dollar denominated investments, economic, economic trends, economy, financial, futures, futures markets, gold, gold miners, hard assets, heating oil, India, inflation, investments, market crash, Markets, mining companies, natural gas, oil, palladium, physical gold, platinum, platinum miners, precious metals, price, price manipulation, prices, producers, production, protection, rare earth metals, recession, risk, run on banks, safety, silver, silver miners, socialism, sovereign, spot, spot price, stagflation, timber, U.S. Dollar, volatility, Water

Are We There Yet? Finding that Elusive Bottom

Source: The Gold Report  11/14/2008


David Skarica, author of the Addicted to Profits newsletter, gives The Gold Report an exclusive preview of coming market attractions including double-digit inflation, a super pop in gold stocks, and the demise of an empire. A financial advisor who earned his reputation as a contrarian before he turned 30 by predicting the dot.com bust, Skarica was the youngest person ever to pass the Canadian Securities Course. He incorporates technical analysis, historical precedent, demographics and investor behavior into his forecasts and names some likely beneficiaries of the next market move.

The Gold Report: Have we finally hit the bottom? Are things turning around?

David Skarica: I’ve studied the panics that have occurred over the past 100 years and discovered that there’s a similar trading pattern when you reach the true bottom. A panic like we saw this September through October is typically followed by a reaction rally similar to what we have now. That rally will take the market 20% to 30% off its lows and last for about a month and then you’ll get a retest. Maybe not an all-out retest, but a repeat of that rally over the next month or two. For example, in ’87 and ’74, after a big 30% or 35% decline, you got a rally into November, then this decline into October and then the market held, the lows took off and launched a bull market for a couple of years.

Once this rally plays out, the key thing to watch is a pullback into December that could very well be “the low.” You’ll know it’s the low because you’ll see non-confirmations. You won’t get as many new lows in the market; the fear gauges like the VIX (Chicago Board Options Exchange Volatility Index) won’t hit such extremes. A lot of the industries that led us down, such as the banks or the airlines, will hold well above their lows. That will be the bottom. In a worst-case scenario like 1929 or 2001, when you had big sell offs, there were rallies for four to six months before the market rolled over and hit new lows. If the market continues rallying into January or February, that would be a very negative signal. I want to see that retest. One positive thing is that we already saw one retest in late October and now we’re seeing this secondary rallying. In 2001, there was no retest. The market sold off real bad for three or four days after 9/11 and then kept rallying.

Gold stocks are at an all-time low in terms of P/Es, and their price relative to the price of gold. The dollar rallied during all the de-leveraging but at some point, the dollar is going to roll over. If you look at the currencies that got killed— the Canadian dollar and the Australian dollar—fundamentally, those countries are still stronger. They’re not running huge deficits. Canada’s deficit will only be a couple of percentage GDP, unlike the U.S. with a deficit of nearly 10% of the GDP. The Canadian banks are fine; none of them need a bailout.

TGR: European banks and Japanese banks are bailing out their banking systems too. Why would U.S. currencies do worse against other currencies?

DS: I don’t think the dollar will totally tank in the short term because Europe —not just the Euro but also all the other European countries thrown in with Euro—have something like 70% of the dollar index. These countries have problems as well. Milton Friedman said he never thought the Euro would survive its first severe recession because you’d never get consensus among the different countries. How are you ever going to get the British, Italians, Germans, and French to agree on anything? The dollar rallied because people thought that the U.S. at least had a policy. I don’t see the dollar collapsing in the short term. Unless we’re going into a total worldwide depression—I don’t think that’s going to happen. I really believe the rest of the world will distrust the U.S. financial system.

Wall Street packaged all this fraudulent stuff and then sold it to everyone. These guys were dumb and greedy for buying it but they were defrauded. So Asian banks won’t be buying anymore Fannie and Freddie bonds; they’re going to say the heck with it and invest in China, India and other emerging nations. Capital flow will shift away from the U.S. After the crash of 1929 the world’s financial center shifted from the U.K. to the U.S. This crash will shift the financial centers from Wall Street to Singapore, Dubai, Mumbai, and Bombay. Japanese banks are pretty solid right now and so are a lot of Asian banks. They’re involved in lawsuits because they own some of these toxic assets, but, again, you’re not seeing mass bailouts over there and Australian banks are strong, too.

There will be growth going forward in emerging economies. Meanwhile, in the U.S. the baby boomers are retiring. In technical analysis we talk about overhead supply and that’s when the stock goes way up and comes way down. The problem that stocks are going to have is the people who bought at much higher levels are going to sell into any rally to cut their losses. Baby boomers are retiring, so they’re selling into any rally. In the 1970s and 1980s they were in their 30s and 40s, so they bought stocks. Over the next ten years they will be sellers.

TGR: What about the echo boomers? They’re getting out of college now. The biggest group is starting college.

DS: They’re getting out of college, but won’t reach their peak earning years until they are in their 40s and 50s.

TGR: Yes.

DS: Echo boomers probably won’t invest significant amounts of money for 10 or 15 years. This is interesting because I do a lot of cycle research and 10 to 20 year cycles are common. In the market, cycles run for 17 or 18 years. For example, we had a bull market from 1949 to 1966, but a bear market from 1966 to 1982 and then another bull market from 1982 to 2000. Now we’re in the midst of a long-term bear market. When that next generation really starts to invest heavily coincides with the time that the baby boomers will have sold out.

As I said, I think we might bottom here; we might have a one or two-year bull market like we had from 1975 to 1976 after the bad bear market in 1973 to 1974. But I think we’re still in what’s called a secular bear market, which lasts for 15 to 20 years. One of the underlying causes is the printing of all this money. I think interest rates are going way up. The next bubble to burst will be the U.S. bond market. You will see high rates in the coming years because right now the U.S. money supply is 38%. That is unbelievable. Even in Y2K, it went to only about 15%.

TGR: The big debate is are we going into a deflationary or inflationary cycle?

DS: I think hyper-inflationary—not like Weimar Republic but like the 1970s. We’ve already started that cycle. Look at the SGS (Shadow Stats – http://www.shadowstats.com), which calculates inflation the way they did in the 70s and 80s. They changed that formula in about 1990 allegedly because the old method overstated inflation. I think the current method understates inflation. When oil was $150, everyone agreed that inflation was higher than the reported 5% or 6%. Using the old method, we were at 10% to 12% this summer when resources were at their highest. So even if you split the difference between the old and the new way of calculating inflation, we were in the range of 8% to 10% this summer.

Anytime they print this much money anywhere, it always led to inflation. One of Bernanke’s big things is to avoid cutting the money supply like the Federal Reserve did from 1929 to 1932. He is doing the opposite. All that liquidity he’s introducing will result in inflation. Typically you don’t go from a period of inflation to deflation. The CPI in the 1920s was going down. They had deflation then and went to ultra deflation in the early 1930s. So usually you go from high inflation to the higher inflation. We’re on a pure fiat currency right now. There’s no gold standard; there’s nothing. Pure fiat currencies usually end in inflation, not deflation.

Take Japan in 1990s and the U.S. in the 1920s—both were creditor nations. People saved. The governments were net creditors going into those downturns, so they could afford to take on debt. Roosevelt only ran one or two deficits before World War II. Obviously, during the war he ran up big deficits. So when you’re a debtor nation, you can’t afford deflation because the amount that you owe goes up in value, right? You’ve got to inflate that away. Some would argue that the whole system is based on credit. No matter how much money the U.S. government prints, no one’s going to lend, and no one will take out loans. That will cause prices to go down. Deflation is a decrease in money supply and in the price of goods. Over the next year or two, go to the store. Is the price of your beer going to go down? Gas prices are lower now than they were in the summer, but they’re a hell of a lot higher than they were six years ago. During a deflationary cycle, you’re going to start seeing deflation on the grocery shelf. The price of your cereal is going to go down; everything’s going to go down in price but that’s not happening. Right now we have asset deflation. I don’t think we’re going to have deflation in the entire economy.

TGR: What’s going to beat the higher interest rates?

DS: Higher interest rates will be (governed by?) supply and demand. Look at the yield of the ten-year bond. The low of that yield got to about 3.2% from 2002 to 2003. The low during this ultimate panic, the worst crash we’ve seen since 1987, has only happened six or seven times in the last 100 years. In 2008, the bond yield only got down to about 3.8%. So we didn’t see this huge influx of money into the bond market. If you were really moving into deflation, the bond market would tell you. The bond market would be going down to a 1 to 2% yield and telling you, okay, everything’s going to come down. But, instead, the bond rates are around 4% right now. To get back to supply and demand, they’ve got to issue $550 billion worth of bonds this quarter to pay for the bailout and they’ll probably have big deficits over the next year or two because it’s going to be a pretty bad recession. Issuing more bonds will probably mean the buyers of those bonds are going to ask for a higher return.

TGR: How high do you think interest rates will go?

DS: That’s really difficult. There’s no reason you can’t get back to at least 7 to 9% on the ten-year bond, which is where we were in the late 1990s. It’s not exactly a heady level, but we could reach low double digits. Here’s the thing no one’s talking about. If you read about the decline and the fall of the Roman Empire or the U.K., the U.S. has made all the same mistakes they made. They tried to police the world with an overly aggressive foreign policy and they spent all your money on war. They went to a pure fiat currency. The U.S. is a super power in decline. It could take a generation, but I think it will happen. In 1913 the U.K. ruled the world. Thirty-five years later after two world wars, the U.S. had to bail them out. These things can change quite quickly. Ultimately people will demand higher returns on that debt, so I see interest rates reaching 10% or higher and I’m being conservative. At the secular top you might get back to where you were in the late 1970s.

TGR: Where would you expect the inflation rate to go once hyperinflation kicks in?

DS: It will be 10 to 15%. Gas was up 10% today; oil’s up 10%. I’m an inflationary guy. Watch someone like Jim Rogers. He’ll talk about how it’s not just a demand thing with China and India or the U.S. dollar going down. His point is that there’s no oil supply coming on the market and alternatives like solar and wind will take a long time to replace fossil fuels. So, I expect double-digit inflation. Now they may only report it as 7% or 8%, but it’ll probably be 15% to 16%, maybe even 18% or 19% higher than that. Look at the way they calculated inflation in 1980. Using that formula, inflation actually got up to 10% to 12% this summer. Now it’s probably down to about half of that because of the drop in commodity prices.

But here’s an interesting note. Commodity prices started falling apart in September during de-leveraging when people were dumping everything. The PPI, the producer price index, in September still went up. Even with huge commodity price declines, you still had an increase in the PPI. I think that’s due to the fiat currency effect. It’s very difficult to get inflation. Remember, even from 1980 to 1982 when they upped rates to 20% to kill inflation, inflation slowed down from 20% to 4% or 5%, but we never went into deflation. People just get mixed up because they think that when stocks go down or real estate goes down that’s deflation. In fact, that’s asset deflation. Deflation is actually a decrease in money supply and decrease in the price of goods. Look at your electricity bill. You won’t see it going down that much.

TGR: As you said, oil was up 10% today.

DS: Oil is $70 now. Oil never hit $70 until a few years ago. People act like, oh, it’s gone down from $140 to $70. But remember, oil was only $25 to $30 when the Iraq war began in 2003. People act like this is deflationary, but oil is just pulling back. To Jim Rogers ‘This is the fourth decline of 40% or greater in the price of oil since the bull market began in 1998.’ I think we’re in a big commodity secular bull market that started in 2001. Commodities are very volatile. They can fall 50% and still be in a bull market. In 1975 to 1976 gold went from $200 to $110 after it went from $35 to $200. Everyone thought the gold market was over and then in the next four years it jumped to $800. Gold can go to $600 and still be in a bull market. People just don’t get that because they don’t think long term.

TGR: So if you’re saying the commodity bull market started in 2001 and that these cycles take 15 to 18 years, we are about half way through this then.

DS: Yes.

TGR: Commodities are volatile, but will the last two-thirds of this bull market grow exponentially faster? Or will it grow fast then drop off?

DS: The two biggest moves are always the one at the beginning and the one at the end. For example, the HUI, the Gold Index, went from $35 to $200 within a couple of years after reaching bottom. That’s a great 6:1 gain. So usually you have a huge launch off the bottom. The Dow went from 800 to 1,500 in its first year or two of the bull market. The first move up will be big and then in the middle you’ll go up more gradually. At the end you’ll have the bubble blow-off. And you’ll see another double or triple gain.

The only comparison I can use is the CRB Index, which is more of a commodity. It went from $100 to around $170 or $200 in the mid-1970s and then had a final blow-off to $350 to $360 in 1980. So the CRB Index went up 250% in the 1970s. It started this bull market at $180 and went to $470. But, again, if you go up 250% from $180, you’re talking about the CRB being about $600 to $650, which would be more than a doubling of its current level. This commodities bull market is going to be bigger because of what’s going to happen when it turns into a bubble. It’s like the growth of the Internet – all of that got priced into the tech stocks from 1999 and 2000. Even though the Internet’s a lot bigger and faster now than it was ten years ago, and there’s more commerce being conducted over it, the stock prices all peaked in 2000. Five to ten years from now, you’ll see these commodities pricing in global economic growth to perfection. So people won’t get it after that if they invest in commodities in 2018. In 2025 commodities will be down 40 to 70% from their highs, but the global economy still growing.

Three things drive commodities: money supply, the U.S. dollar, and supply-demand. In the 1970s the economy was a shambles, but commodity prices went nuts because you had terrible economic policies. The government was printing tons of money, and the U.S. dollar was declining. There was no investment during the 1980s and1990s in big new commodity funds and now a lot of them have been shut down because of this pull back. Commodity prices will rebound by 2010. That will introduce a five to ten year period of high prices where people will aggressively look for stuff and bring supply to the market.

TGR: Where will gold be in the next 12 to 18 months?

DS: That’s a tough call. Right now it’s really interesting because the U.S. dollar has been trading opposite to the market since September. We’ve seen the rally in the dollar; we saw the decline in other currencies because of the flight to the dollar. When we talk about the redemption of hedge funds, most of the people who own those funds are actually outside of the U.S. When you speculate all over the world, you’ve got to buy U.S. dollars just to pay people back their redemption, right? That was part of what was going on. If we get this retest to the market in December after the short term decline in the dollar, you might see another rally out which can hit gold maybe back to around this low $700 area. But if I’m right and the market rallies next year, and this fourth quarter is really the bottom, gold will reach $1,000, even $1,100. The opportunity right now is not in gold; it’s in the gold stocks. Even with this rally that we’ve seen in the gold stocks – for example, the XAU to gold ratio, which is the percentage of the XAU’s trading of the price of gold—it’s usually 22%, which means, for example, gold – let’s make it easy – is $1,000, the XAU is $220—even with today’s rally, the XAU is about $90 and gold is about $750, right?

TGR: Right.

DS: When you do the math that’s about 12%— almost half of the historical ratio. So if gold were to go to $1,000, the gold stocks can more than double. There’s a time to buy gold instead of stocks and there’s a time to buy stocks. I’d be looking at the smaller, lower-cost producers like Agnico-Eagle Mines Ltd. (TSX:AEM). That company will return to its regular valuation. Gold could go to $600 and if the XAU went back to that 22%, it’d be trading at like $130. So the XAU could go up 40% if gold went down over $100 to get back to its normal valuation. That’s not the gold stock saying that gold’s going to go down, they’re feeling it or whatever. That was just like the hedge funds were all in the gold stock. The gold stock market is a smaller market than the equity market. They all had to sell everything and that was it.

TGR: What about buying seniors who have just been battered versus juniors that have a potentially higher upside?

DS: For the average investor, I’d be looking at seniors because they are so cheap. When I say juniors, I’m talking about junior producers with lower levels of production because they have cash flow. And, again, it’s the whole leveraging thing. Hedge funds own them, too, and they’re even more liquid than seniors. So instead of the seniors, which all went down, say, 60 to 70%, the juniors, in many instances, went down 70 to 80% or even 90%.

Look at a stock like El Dorado Gold Corp. (TSX:ELD) (AMEX:EGO) (ELD.TO), a junior producer in the late 1990s when all the gold stocks went down 70 or 80%. Eldorado was a 40 to 50 cent penny stock and, because it was a junior producer, it had more leverage when gold went up and ultimately it got as high as $8 or $9. A lot of these little penny stock gold and silver producers with cash flow, could become the next Eldorado. They could bring a lot of 10 or 20:1 deals over the next three to five years.

Another thing that’s going to be really positive for gold and resources going forward, has to do with the behavior of 15 to 20 year bear markets. Usually the big busts come in the first half of that secular trend. If you look at 1929 to 1948, the two worst parts of that bear market were 1929 to 1932, with a 90% decline in the Dow, and 1937 to 1938, with a 50% decline. After that most of the climbs were muted, like 30% down and 25% up. The same thing happened in the 1970s. The 1970 bear market was 36% off and the 1974 bear market was 48% off. From 1975 to 1976 to 1982 at the bottom, the climbs are more gradual. So we had a bad bear market when the tech stocks blew up, which was over 40%. This bear market is over 40%, assuming we hit the bottom a few weeks ago. What you’re going to see now— as volatile as it’s been, it sounds crazy to say this – but, say, we get a one or two year bull market after this bear, you’re going to see volatility dry up. By the way, that’s how you start bull markets. When you start, when the sellers are all out, you usually get everybody giving up, not in a panic, but when the market hasn’t done everything for years. During those times when the market is doing nothing, that’s where resources and gold usually do well.

TGR: So, David, do you have some stock ideas for our readers?

DS: I like Agnico-Eagle Mines Ltd. (TSX:AEM) and Royal Gold Inc. (RGLD), which is a royalty company. The two juniors I really like are Fortuna Silver Mines Inc. (FVI) and Silverstone Resources Corp. (TSX.V:SST). They are both smaller silver producers. Actually, Fortuna was up quite nicely today from about 55 to 70 cents but it had been over $2. Fortuna also fell from $4 to 50 cents. It’s back up to around 60 or 70 cents right now. Right now you’re still getting in at a good level. On a totally different sector, if you’re looking at the major market, you can get stuff that’s really beat up. If we get this retest in December, I’d be looking at – and a lot of people will think I’m nuts saying given the state of the economy —some of the casinos. MGM fell over 90% from its high and I usually find that unless the company is going bankrupt, you’re really safe buying something that’s down 90% from its high. For example, this summer I wrote an article in Investor’s Digest of Canada telling people to buy the airlines because the airline index in the States had gone from an all time high of $200 down to $14, which is 90+%. Now the airlines are one of the only sectors that have gone up since July. A lot of the airlines went up 50 to 100% since then. Even with the higher oil prices, airlines are very cheap, for example, WestJet (WJA.TO).

TGR: What’s that one?

DS: It’s a Canadian discount airline. I put WestJet in my newsletter at about $9.50. Now it’s $10.50. The nice thing about it is a lot of airlines are forward selling oil prices to $80. But a lot of them expired this quarter, so now they’re going to be able to go to $60, $70, and $80 oil and it won’t kill them. I also like some of the emerging markets. I like the India Fund (IFN) and the South Korean Fund (EWY) or the Templeton Russia Fund (TRF). They are more leveraged. They usually fall 80% in U.S. dollar terms in a decline and they’ll go up hundreds of percent in a bull market. But I would wait for that retest before going into the emerging markets. I’m kind of all over the place in terms of the types of sectors I like because of the valuation of some of these things. I look for the really beat up sectors—obviously all the precious metal stuff—because they are very, very cheap.

TGR: Dave, Are there any exploration companies that are catching your eye?

DS: Yes, there are a few. The problem with exploration at the moment is cash flow or lack thereof. These companies have no revenues; money is difficult to come by at the moment. They have burn rates. That is why if you are going to buy a smaller junior, you have to look at the producers first. Therefore, I think you have to look at companies who have cash on hand. One such company is Rimfire Minerals Corp. (TSX.V:RFM). In the past they were criticized for being too conservative, much of their budget has their joint venture partners (which include majors) so they will not burn through their cash. They have about C$0.25 (per share) in cash on hand, and the stock trades at C$0.15 (per share) so you are getting the company at a 40% discount to cash. Basically, you are buying at .60 on the dollar to cash and getting all the properties thrown in for free. Also at their burn rate it will probably take them three years to go through their cash position and by then the credit markets will be back.

There are also companies I have on my list that have heaps of cash, large resources and are going into production next year, like ATW Gold Corp. (TSX.V:ATW) and Avion Resources Corp. (TSX.V:AVR). Again, I do not mind if a company is going into production, as it should get cash flow sooner rather than later. Avion is trading at cash.

I also like Full Metal Minerals Corp. (TSX.V:FMM) . The company has had strong results as of late; they are raising money to put their Lucky Shot mine into production. This will be a high grade mine, low cost. It will only have a few years of production, but again that will give them cash flow to survive. The financing they are doing is small and I think they will get it down, even in these markets.

In the case of Rimfire and Full Metal these were C$2.00 per share companies not too long ago, it will take them a bit to base, but it could still happen.

Finally, for a shot in the dark I like Cityview Corporation (CTVWF) (ASX:CVI). This is a very interesting little deal that has collapsed. They were doing a gigantic financing for offshore oil production in Angola, which fell through when the credit markets collapsed. They are now doubling the float of the company to raise capital to put a diamond mine into production in Angola, they are also looking at an oil refinery. This offering should allow them to survive and they will get production from the diamond mine. They will have a huge float (over 900 million shares), but they have the former Angolan Mines Minister as chairman and are positioned to be a leading company in Angola, Right now the stock has a market cap of about 8 million of the new offering. It is something that could turn around huge when this is finished or tank if they can’t get the funds. It is worth a small roll of the dice at $0.01.

Dave’s first book “Stock Market Panic! How to Prosper in the Coming Bear Market” published in January 1999 provided thought provoking arguments on why this great bull market will end in the most vicious bear market of all history. He is also the author of “The Contrarian Who Saved the World,” which explains how markets work. Dave has also been a contributing editor to Canadian MoneySaver and Investors Digest of Canada

Share this:

  • Click to share on Reddit (Opens in new window) Reddit
  • Click to share on Facebook (Opens in new window) Facebook
  • Click to share on LinkedIn (Opens in new window) LinkedIn
  • More
  • Click to share on X (Opens in new window) X
  • Click to share on Pinterest (Opens in new window) Pinterest
  • Click to share on Tumblr (Opens in new window) Tumblr
  • Click to print (Opens in new window) Print
  • Click to email a link to a friend (Opens in new window) Email
Like Loading...
← Older posts
Newer posts →

Authors

  • jschulmansr's avatar jschulmansr
    • Free Crypto!
    • Free Crypto Currency
    • This is Blessed!
    • Trump Rally Charleston
    • Trump Rally Charleston

Blog at WordPress.com.

Privacy & Cookies: This site uses cookies. By continuing to use this website, you agree to their use.
To find out more, including how to control cookies, see here: Cookie Policy
  • Subscribe Subscribed
    • Dare Something Worthy Today Too!
    • Already have a WordPress.com account? Log in now.
    • Dare Something Worthy Today Too!
    • Subscribe Subscribed
    • Sign up
    • Log in
    • Report this content
    • View site in Reader
    • Manage subscriptions
    • Collapse this bar
%d