• Recommended Sites & Links
  • About

Dare Something Worthy Today Too!

~ FreeCryptoBitCoins, Cryptocurrency, BitCoin, Ethereum, BitCoin Cash, Ethereum Classic, LiteCoin, DogeCoin, Gold & Precious Metals, Investing & Investments, Stocks and Stock Markets, Financial Markets & Market Timing, Technical Analysis, Oil and Energy Markets, Hard Assets Investing, BlockChain, Airdrops, Earn Free Bitcoin…

Dare Something Worthy Today Too!

Category Archives: Moving Averages

Can’t Keep A Good Investment Down?

10 Tuesday Feb 2009

Posted by jschulmansr in 10 year Treasuries, 20 yr Treasuries, Bailout News, banking crisis, banks, bear market, bull market, capitalism, central banks, Comex, commodities, Copper, Credit Default, Currencies, currency, Currency and Currencies, dollar denominated, dollar denominated investments, economic, Economic Recovery, economic trends, economy, Fed Fund Rate, Federal Deficit, federal reserve, Finance, financial, Forex, Fundamental Analysis, futures, futures markets, GDX, GLD, gold, Gold Bullion, Gold Investments, gold miners, How To Invest, How To Make Money, hyper-inflation, inflation, Investing, investments, Japan, Jschulmansr, Junior Gold Miners, Latest News, Make Money Investing, market crash, Markets, mining companies, mining stocks, Moving Averages, palladium, Peter Grandich, physical gold, platinum, platinum miners, precious metals, price, price manipulation, prices, producers, production, silver, silver miners, small caps, spot, spot price, stagflation, Stimulus, Stocks, Technical Analysis, TIPS, U.S. Dollar

≈ Comments Off on Can’t Keep A Good Investment Down?

Tags

Austrian school, Bailout News, banking crisis, banks, bear market, Bollinger Bands Saudi Arabia, Brian Tang, bull market, central banks, China, Comex, commodities, Copper, Currencies, currency, deflation, Dennis Gartman, depression, dollar denominated, dollar denominated investments, economic, economic trends, economy, Federal Deficit, financial, Forex, futures, futures markets, gata, GDX, GLD, gold, gold miners, hard assets, hyper-inflation, India, inflation, investments, Jeffrey Nichols, Jim Rogers, Keith Fitz-Gerald, majors, Marc Faber, market crash, Markets, Michael Zielinski, mid-tier, mining companies, monetization, Moving Averages, palladium, Peter Grandich, Peter Schiff, physical gold, platinum, platinum miners, precious metals, price, price manipulation, prices, producers, production, protection, recession, risk, run on banks, safety, Sean Rakhimov, silver, silver miners, small caps, sovereign, spot, spot price, stagflation, Technical Analysis, TIPS, U.S., U.S. Dollar, volatility, warrants, XAU

As I write Gold has come screaming back like a rocket to the moon! Currently Gold is up $20 oz back to $913 an oz. Today we here from Peter Grandich on new all time highs for gold are just around the corner. We’ll take a look at Silver, oh we can’t forget about Platinum too! There’s still time but the Precious Metals Bull Train is about to leave the station-Hop aboard! – Good Investing – jschulmansr

===========================

Gold All Time Highs – Not If But When – Grandich Blog

By: Peter Grandich of Grandich Blog

February 10th, 2009

They say in life only death and taxes are guaranteed. They send you to jail if you guarantee an investment and it fails. With both things in mind, I believe we “should” make a new, all-time nominal high in gold before too long.

After putting a strong bottom in at $700, gold has made a series of higher lows while the $930-$940 area remains resistance. Despite an incredibly strong physical market, the paper market at the Comex seemingly trades to a different “drummer”. That’s okay as physical demand eventually overtakes paper markets.

Gold continues to be my most favorite play, followed by being long the Canadian dollar and then oil. But remember, I was also a NY Jets fan for 35 years.

============================

Catch the New Bull! – Buy Gold Online – Safely, quickly, and at low prices, guaranteed! Bullion Vault.com

===============================

What’s Going on With the Dollar and Gold? – Seeking Alpha

By: Tim Iacono of Iacono Research


Those of you who have noticed that the U.S. dollar and gold have been moving in the same direction over the last few weeks are not alone. In fact, the two have moved together eight days in a row and nine out of the last ten, something that is quite unusual.
IMAGE When looking at the PowerShares DB U.S. Dollar Index Bullish ETF (PCX:UUP) and the SPDR Gold Shares ETF (PCX:GLD), it’s clear to see how different the last couple weeks have been as compared to earlier in the year.


Based on the data for these ETFs (which, unfortunately only goes back to early 2007 for UUP), the two have moved in the same direction on just 150 out of 490 days – about 30 percent of the time.


As shown in the chart below, the recent surge to much higher levels has not happened in at least two years, probably much longer.
IMAGE

The only other time that something similar happened was back in January of 2008.


What else happened in January of 2008?

Ahhh… How soon we forget…

From the St. Louis Federal Reserve website:

January 11, 2008

Bank of America announces that it will purchase Countrywide Financial in an all-stock transaction worth approximately $4 billion.


January 18, 2008
Fitch Ratings downgrades Ambac Financial Group’s insurance financial strength rating to AA, Credit Watch Negative. Standard and Poor’s place Ambac’s AAA rating on CreditWatch Negative.

January 22, 2008
In an intermeeting conference call, the FOMC votes to reduce its target for the federal funds rate 75 basis points to 3.5 percent. The Federal Reserve Board votes to reduce the primary credit rate 75 basis points to 4 percent.

January 30, 2008
The FOMC votes to reduce its target for the federal funds rate 50 basis points to 3 percent. The Federal Reserve Board votes to reduce the primary credit rate 50 basis points to 3.5 percent.


This was the really steep part of the rate reduction cycle – 125 basis points in just over a week.


Whether any of this has any real significance remains to be seen, but, the fact that, last time around, the gold price then surged to over $1,000 an ounce should not be ignored.

I, for one, will be happy to see the inverse relationship between the dollar and gold go the way of the dodo bird, never to affect twitchy traders again.

As noted here on many occasions before, there is no fundamental reason for this relationship to exist. If the dollar strengthens against the euro, why should that make the gold price go down? Because gold, priced in dollars, has become more expensive in Europe?

Despite hearing that ad nauseum in the financial media, that really doesn’t make any sense when you think about it.


Full Disclosure: Long GLD, no position in UUP
======================================
Catch the New Bull! – Buy Gold Online – Safely, quickly, and at low prices, guaranteed! Bullion Vault.com 

======================================

Silver Surges but Remains Undervalued Compared to Gold – Seeking Alpha

By: Mark O’Byrne of Gold and Silver Investments.com


Gold fell some 1.5% last week as investors tookgl profits with gold having been up some 10% in the previous three 3 weeks. But the short and medium term prospects look sound in the light of strong fundamentals and some important indicators – silver was up by another 4.2% last week and the gold mining indices were also higher (XAU +4.6% and HUI +2.3%). The mining indices are often a leading indicator and silver usually underperforms gold in the early stages of rallies and outperforms in the latter. Silver’s recent strength (up by some 15% since the start of the year) may be a prelude to higher gold prices in the coming weeks.


The recent sharp rally in the US dollar appears unsustainable and the USD Index was down 0.64% last week and US bonds also fell again – the 10-Year bond sold off again and the yield rose another 4.75% (from 2.9% to 2.979%). As ever, the bond market remains of fundamental importance and nervousness about the humongous size of the Obama bailout and stimulus packages and talk of central banks printing money to buy government bonds is not helping sentiment here. And government debt issuance is set to surge in the coming weeks and there is a real concern that there simply will not be enough buyers – meaning that bond prices may fall from their lofty heights and long term yields and interest rates begin to rise again.

The gold/silver ratio has fallen to around 70 ($905oz/$13/oz = 69.6) today from around 80 in mid January. The long term historical average is 15:1 and this is because it is estimated that geologically there are some 15 parts of silver in the ground for every one part of gold. It is important to note that silver, unlike gold, besides being a safe haven investment is also used in industry and it is believed that since the dawn of the industrial revolution some 95% of the world’s silver has been used up in industrial applications. Because of gold’s much higher value, it gets recycled and all the gold mined in the world ever is still with us but photography and other industrial uses makes silver like oil – when used it is gone forever.

The 1970s saw an average gold to silver ratio of around 25:1 and fell below 20:1 when silver rose to over $45/oz nominally. Thus it seems very likely that in the coming years, silver may well return to its long term historical average of closer to 15:1. This means that silver is likely to continue to outperform even gold in the coming weeks and months. Silver may return to its recent highs of over $20/oz in 2009 due to very strong supply demand fundamentals. It is also important to note that the CFTC investigation into artificial manipulation and suppression of the silver market could potentially lead to a massive short squeeze.

All investors should diversify within the precious metals allocation in their portfolio and own silver as well as gold. Gold remains the ultimate safe haven while silver is a safe haven but has the potential for very significant returns and growing wealth in the coming months.

Stock position: None.

==================================

Catch the New Bull! – Buy Gold Online – Safely, quickly, and at low prices, guaranteed! Bullion Vault.com

=================================

Bullish for the Short Term But Consider Gold, Platinum as Well – Seeking Alpha

By: Jeffrey Saut of Raymond James


Excerpt from Raymond James strategist Jeffrey Saut’s latest essay, published Monday (February 9th):


…[I]n last Tuesday morning’s verbal strategy comments we noted that since the inception of the S&P 500 futures contract there have been five instances when the futures slid by 2% (or more) on back-to-back days and then gapped lower by 1%+ the following session. On EVERY one of those occasions the S&P 500 (SPX/868.60) was at, or within one day, of beginning a decent rally. Further, last November we opined that at the November 20, 2008 “price low” the DJIA was 34% below its 200-day moving average [DMA] and consequently very oversold.

According to Susan Berge, of the Berge Report, that reading was greater than the momentum low occurring in October 1974 of 27%, as well as the 24% reading during the 1987 crash. Even after the rally we have experienced since the November “lows” during the recent downside re-test of those November’s “lows” the differential was still a massive 25%. Subsequently, we advised buying the exchange-traded fund [ETF] of your choice, which in our case was the recommendation of the ProShares Ultra S&P 500 (SSO) that is “geared” two-to-one on the upside. We further suggested that the more timid types might want to consider hedging these positions to minimize the downside.

Accordingly, the Dutiful Dow sprinted 141 points in Tuesday’s session, but gave back most of those gains on Wednesday’s wilt (-121). Therefore, in Thursday morning’s strategy comments, we said that if our upside rally “call” was going to play ,the equity markets would need to shake off Thursday’s worse than expected employment claims number, as well as the anticipated worse than estimated employment numbers on Friday. BINGO, for indeed the late week numbers were much worse than expected, yet the DJIA shook them off and rallied. How far the rally will carry is anyone’s guess, for while we are bullish on a short-term basis, it would take a closing price above 8375 on the DJIA to turn us merely “neutral” on an intermediate-term basis.

However, if the DJIA (8280.59) can close above its January 6, 2009 closing high of 9015.10, with a like close by the D-J Transportation Average [DJTA] (3203.70) above its 1/6/09 closing high of 3717.26, it would be a Dow Theory “buy signal” according to our interpretation of Dow Theory; and should be viewed as a pretty bullish occurrence. Moreover, as stated in previous missives, so far what we have seen is a downside non-confirmation, with the DJTA breaking below its November 2008 “low” without a similar breakdown by the DJIA; and, you should read that bullishly.

Meanwhile, there was an interesting rotation last week with the Commodity Research Bureau Index “up,” the Dollar Index “down,” bond prices “down” (read: higher interest rates), and Dr. Copper “up” nearly 11%. This action, if it continues, suggests the potential for the return of inflation and the potential for a stronger economy. If so, in addition to our recommendation on gold, participants might want to consider investments in platinum. Indeed, unlike gold, platinum is not only a precious metal, but is used heavily in industry due to its tensile strength characteristics…

Typically, platinum sells at a substantial premium to gold, but because of the collapse of the auto industry platinum is approaching parity with gold for the first time since the early / mid-1990s. Investors, therefore, might want to consider platinum in addition to their gold positions, for they will be purchasing a relatively “cheap” metal with a “call” on an auto industry rebound. Our vehicle of choice for this theme is the iPath Dow Jones AIG Platinum ETF (PGM).

================================

Catch the New Bull! – Buy Gold Online – Safely, quickly, and at low prices, guaranteed! Bullion Vault.com

================================

Late Breaking Intelligence Report…

MineWeb Gold News – Japan Investors Turn To Gold! – MineWeb

Source: Reuters


TREND SPREADING

Japan investors turn to gold

Online traders are turning to commodities from FX, stocks and gold is the most popular commodity product for online retailers.

Author: Chikako Mogi
Posted:  Tuesday , 10 Feb 2009

TOKYO (Reuters)  – 

Japanese retail investors are stepping up their online gold investment in a trend that is unlikely to be reversed, an executive at a top online commodity trading firm said on Tuesday.

As the country’s retail investors catch up with global trends of asset diversification, they are hunting for alternative investments to enhance returns, and the trend is spreading outwards from the rich to engulf ordinary people.

Japan’s risk-averse retail investors are estimated to hold an eye-popping $16.4 trillion, more than half of it in cash and deposits, Mizuho Bank, the country’s second-largest lender, says.

Although the global financial crisis hit the real economy and battered commodities directly linked to the economy, gold remains unscathed by such declining industrial demand while retaining merit as an asset.

“Given its relatively stable value, interest in gold will persist for a while and the market will remain bullish,” Naoaki Kurumada, chief executive of Dot Commodity, Inc, told Reuters.

“Gold is our main commodity product — by purchasing gold, investors can start including commodities in their portfolios.”

Since its establishment in 2005, the company has grown as Japan’s top online commodity trading firm, with about 20,000 accounts against some 50 initially, and assets of 8 billion yen ($87.45 million) by October. It is also second in the online commodity trading industry in volume terms.

The company is drawing interest from seasoned online traders who are turning to commodities for high returns, as Japanese stocks have plunged and the yen has strengthened.

“I expect online accounts to increase, given the strengthening appetite for asset diversification and more people finding commodity trading interesting,” Kurumada said.

There are two key kinds of investors who use the firm’s services. One of them has experience in trading currency or stocks online and can analyse technical charts or moves in other markets to aim for high returns amid price fluctuations.

“Some are day traders, others more longer term, like a few weeks. They are largely in their 30s and 40s,” Kurumada said.

The other type is non-traders interested in commodity investment who buy gold as a start, he said.

Reflecting the popularity of the yellow metal as an investment, the open interest in the gold mini contract, launched in July 2007, hit a record high 83,428 contracts on Jan. 8, according to Tokyo Commodity Exchange Inc (TOCOM), exceeding that of the standard gold contract.

TOCOM will extend trading hours of all derivatives contracts later this year to boost liquidity after Japan’s main commodity market launches upgraded trading systems in May.

Kurumada said this would help attract more investor interest to commodity investment and trading, as it would allow players to cut losses timely or swiftly react to overseas market moves.

“We hope that the environment will be set so traders can reap profits just like in currency and stocks,” he said.

While Japanese retail investors are waking up to the attraction of commodity investment, the pace of growth may be moderate.

About 20 percent of those investing in gold, for instance, are investing in TOCOM’s gold mini contract and about 10 percent are actively trading. The rest are investing in such products as gold savings plans, Kurumada said.

“Retail investors jumped on the gold mini contract a year after its launch. It takes time for them to catch up,” he said. ($1=91.48 Yen) (Editing by Clarence Fernandez)

© Thomson Reuters 2009 All rights reserved

==================================

Catch the New Bull! – Buy Gold Online – Safely, quickly, and at low prices, guaranteed! Bullion Vault.com

==================================

That’s It for Now- I close with this quote below- Good Investing! – jschulmansr

“Nothing will unnerve the paper gold shorts more quickly and do more to undercut their confidence than to strip them of the real metal and force them to come up with more hard gold bullion to make good on deliveries. “Stand and Deliver or Go Home” should be the rallying cry of the gold longs to the paper gold shorts.” –Trader Dan Norcini

==================================
Nothing in today’s post should be considered as an offer to buy or sell any securities or other investments; it is presented for informational purposes only. As a good investor, consult your Investment Advisor, Do Your Due Diligence, Read All Prospectus/s and related information carefully before you make any investments. –  jschulmansr


Share this:

  • Click to share on Reddit (Opens in new window) Reddit
  • Click to share on Facebook (Opens in new window) Facebook
  • Click to share on LinkedIn (Opens in new window) LinkedIn
  • More
  • Click to share on X (Opens in new window) X
  • Click to share on Pinterest (Opens in new window) Pinterest
  • Click to share on Tumblr (Opens in new window) Tumblr
  • Click to print (Opens in new window) Print
  • Click to email a link to a friend (Opens in new window) Email
Like Loading...

Gold Taking a Breather but Fundamentals are Stronger!

02 Monday Feb 2009

Posted by jschulmansr in 10 year Treasuries, 20 yr Treasuries, banking crisis, banks, bear market, bull market, capitalism, central banks, China, commodities, Copper, Currencies, currency, Currency and Currencies, dollar denominated, dollar denominated investments, economic, Economic Recovery, economic trends, economy, Fed Fund Rate, Federal Deficit, federal reserve, Finance, financial, Forex, Fundamental Analysis, futures, futures markets, gold, Gold Bullion, Gold Investments, gold miners, hard assets, How To Invest, How To Make Money, India, inflation, Investing, investments, Junior Gold Miners, Latest News, Long Bonds, Make Money Investing, market crash, Markets, mining companies, mining stocks, Moving Averages, palladium, physical gold, platinum, platinum miners, precious, precious metals, price, price manipulation, prices, producers, production, SEO, Short Bonds, silver, silver miners, spot, spot price, stagflation, Stimilus, Stimulus, Stocks, TARP, The Fed, U.S. Dollar, Uncategorized

≈ Comments Off on Gold Taking a Breather but Fundamentals are Stronger!

Tags

agricultural commodities, alternate energy, Austrian school, Bailout News, banking crisis, banks, bear market, Bollinger Bands, bull market, capitalism, central banks, China, Comex, commodities, communism, Copper, Currencies, currency, deflation, Dennis Gartman, depression, diamonds, dollar denominated, dollar denominated investments, economic, economic trends, economy, Federal Deficit, financial, Forex, futures, futures markets, gold, gold miners, hard assets, heating oil, India, inflation, investments, Keith Fitz-Gerald, Marc Faber, Mark Hulbert, market crash, Markets, mining companies, Moving Averages, natural gas, oil, palladium, Peter Brimelow, Peter Schiff, physical gold, platinum, platinum miners, precious metals, price, price manipulation, prices, producers, production, protection, rare earth metals, recession, risk, run on banks, safety, Saudi Arabia, Sean Rakhimov, silver, silver miners, socialism, sovereign, spot, spot price, stagflation, Technical Analysis, timber, U.S. Dollar, volatility, warrants, Water

Currently Gold is down $14-$15 dollars per oz. around the $914 level. As I wrote in my last post if we hold this level then $950 will be our next target. If it fails here then we may have a test back to $885 – $890. Either way I’m taking the opportunity to buy on dips since long term inflation is certainly due to happen and Gold is where you want to be when that happens.  Personally, I think $900 to $925 is the new base and we have avery real possibility of $1000+ Gold price before the summer truly begins.- Good Investing – Jschulmansr

==============================

Catch the New Bull! – Buy Gold Online – Safely, quickly, and at low prices, guaranteed! Bullion Vault.com

==================================

Update on the Gold Trade – Seeking Alpha

By: Trader Mark of My Mutual Fund

Last Friday we said gold might finally have it’s real breakout here [Jan 23: Could be the Real Breakout in Gold] I wrote:

Things to like:
1) a series of higher lows
2) the trendline of lower highs has been penetrated

Things to see for confirmation:
1) any pullback is bought
2) price prints over October 2008’s highs, signaling the end of “lower highs”

This was what the chart looked like at the time:

Now?

Without benefit of the orange line – you can see condition #1 has been fulfilled – we “backfilled”, tested the area we broke out of and people were eager to buy. On that, an aggressive trader would be buying. A reader mentioned this outcome last week.

For someone more conservative in orientation, you want to see #2 “a price point over October 2008’s highs” – then we end our half year of lower highs. We are withing spitting distance here with GLD at $91.40 and the October intraday high at $92.

It’s hard to get behind gold fully because there is no “earnings” behind it; it’s all about sentiment. But the theory is that as all the world’s troubled countries race to devalue their currencies (print, print,print) to “save the system,” a hard asset should retain its value. Silver is likewise breakout out, although silver has a lot of industrial uses as well.

I hate to chase a move, but from a technical set up, a lot of institutional money could be set to finally jump in here….

Now the question of what instrument to use – keep it simple or go with a miner? etc.

Disclosure: No position

=================================

My Note- Great call by Trader Makr but I have to ask, why no position Trader Mark? – jschulmansr

=================================

Catch the New Bull! – Buy Gold Online – Safely, quickly, and at low prices, guaranteed! Bullion Vault.com

=================================

Fed Monetizes Debt Leading Investors to Embrac Gold – Seeking Alpha

By: Boris Sobolev of Resource StockGuide.com

In January gold rose significantly against all major world currencies. In most currencies except in the US dollar and the Japanese yen, gold actually made an all-time-high.

January Performance

GOLD / USD 5.3%

GOLD / EUR 16.7%

GOLD / AUD 16.5%

GOLD / JPY 4.4%

GOLD / GBP 5.8%

GOLD / CHF 16.3%

10-Yr Yield 13.0%

click to enlarge

At the same time, most capital markets have been falling.

January performance

DOW -11.5%

S&P -11.4%

NASDAQ -9.0%

FTSE -6.4%

DAX -9.8%

Nikkei -9.8%

Shanghai -9.3%

The governments around the world are trying to take initiative while private capital is sitting on the sidelines, preferring the safety of government bonds and precious metals.

Investors typically do not trust the governments to implement any effective economic solutions. Moreover, this lack of faith in central planning continues to grow since the US government has no other plan of action than to save the old, compromised and untrustworthy financial system.

What the Federal Reserve together with the Department of Treasury has shown is that they will inject a vast amount of newly created money into a hugely ineffective financial system.

While in the fall of last year, in fear of devastating deflation, analysts were competing in downward projections for the price of gold, now the competition is to estimate the amount of losses incurred by the financial institutions around the world. The maximum assessment is now at $4 trillion, with Nouriel Roubini coming in close second at $3.6 trillion.

But the main problem is not so much in the amount of credit losses or the amount needed for recapitalization efforts but in that the new government is committed to continue to transfer huge capital into the hands of the same group of people who were largely responsible for the world financial crash in the first place. Wall Street, though transformed, will remain in control.

The lack of trust in the ability of insolvent financial institutions to run the modern financial system is moving investors into gold.

An even more important gold catalyst was the Federal Reserve. In comparing the two latest Fed statements, two things stand out. Here is the evolution in wording:

December Statement: “In light of the declines in the prices of energy and other commodities and the weaker prospects for economic activity, the Committee expects inflation to moderate further in coming quarters.”

January Statement: “In light of the declines in the prices of energy and other commodities in recent months and the prospects for considerable economic slack, the Committee expects that inflation pressures will remain subdued in coming quarters. Moreover, the Committee sees some risk that inflation could persist for a time below rates that best foster economic growth and price stability in the longer term.”

December Statement: “The Committee is also evaluating the potential benefits of purchasing longer-term Treasury securities.”

January Statement: “The Committee also is prepared to purchase longer-term Treasury securities if evolving circumstances indicate that such transactions would be particularly effective in improving conditions in private credit markets.”

First, the FOMC sees a threat of deflation and second it is prepared to counter this threat by purchasing longer-term treasuries.

Purchases of long term bonds is the most inflationary move that a central bank can undertake because it represents direct monetization of the government debt and hence an unconcealed debasement of national currency. (This is happening at the same time as the new Secretary of Treasury is chastising China – the main US creditor – for currency manipulation.)

Why did the Fed make such a determined statement, with one member even voting to begin long term treasury purchases immediately? First and foremost, the real estate market is not showing any signs of life. House prices are falling, time required to sell new homes is rising and most importantly, after a steep fall in December, average mortgage rates began to rise again, reaching 5.34% as of last Friday.

Since mortgage rates are closely tied to the 10-year treasury yield, the Fed stands ready to buy government debt and help make housing more affordable via low mortgage rates. The hope is that such action would help put an end to a decline in asset prices and stop the deflationary spiral.

In fact, the latest Fed balance sheet showed that long term treasury purchases have already started, with around $1 billion in notes (5-10-year maturity) purchased for the week ended January 21st. This is a modest amount, but it is a statement that the Fed is ready to do more than just talk. Traders have indeed sensed this development and Treasury Inflation-Protected Securities (TIPS) (TIP) are also beginning to reflect greater inflation expectations.

Gold investors are also sniffing out the coming price reflation as they piled into the SPDR Gold Shares (GLD) at an increasing rate.

For the month of January, GLD gold holdings rose 8.2% or close to a record setting 63 tonnes. At this rate, GLD will soon surpass Switzerland in its gold holdings, thus becoming the world’s sixth largest gold owner after the US, Germany, the IMF, France and Italy.

If the Fed continues to purchase long term treasuries, it is clear that there is only one way for gold and gold stocks and it is up.

================================

Catch the New Bull! – Buy Gold Online – Safely, quickly, and at low prices, guaranteed! Bullion Vault.com

================================

Gold as Part of a Portfolio – Seeking Alpha

By: San Olesky of Olesky Capital Management

Many investors have been thinking about gold recently. Some have considered it because it has been a relatively strong performer with the iShares COMEX Gold Trust (IAU) closing up 5.4% in 2008. It’s up 2% year-to-date as of Wednesday’s close. The iShares S&P 500 Index ETF (IVV) was down 36.94% in 2008 and is down 6.17% year-to-date as of Wednesday’s close. Other investors or traders have bought or considered gold as a classic safe haven.

My inclination is to refute the efficacy of buying or holding gold for security either in the form of an ETF or, more so, in the case of gold bullion bars or gold coins. However, as the financial crisis became more severe last year, a couple of clients approached me about adding gold to their portfolios. Rather than diplomatically rejecting the proposal, I told them that I would investigate the historic effects of holding gold in a portfolio. Long story short, I found that adding a small, reasonable allocation to gold reduced portfolio volatility substantially and increased return slightly.

A simple diversified portfolio consisting of 1/3 S&P 500, 1/3 Real Estate Investment Trusts (REITs), and 1/3 10 year U.S. Treasuries would have produced a compound annual growth rate (CAGR) of 8.47% with 11.15% volatility (standard deviation – SD) from 1993 to 2008. For comparison, the S&P 500 produced a 6.67% CAGR with a 20.16% SD. Although few investors would implement this 1/3 – 1/3 – 1/3 allocation, diversification is proving its strengths here. All of these statistics incorporate rebalancing annually.

Let’s take the same 1/3 – 1/3 – 1/3 portfolio and alter it to include a relatively small allocation to gold. That allocation will be 30% S&P 500, 30% REITs, 30% Treasuries, and 10% gold. Over the same timeframe the portfolio with gold produced an 8.49% CAGR with a 9.86% SD. The portfolio with gold produced a slightly better CAGR with volatility that was 11.6% lower than the 1/3 – 1/3 – 1/3 portfolio. The diversified portfolio with gold produced a CAGR that was 27.3% higher than the S&P 500 and 51.1% less volatile than the S&P 500. The S&P 500 had 4 losing years with the worst being a loss of 37% last year. The 1/3 – 1/3 – 1/3 portfolio had 3 losing years with the worst being a loss of 18.15% last year. The portfolio with gold had only 2 losing years with the worst being 15.74% last year.

In constructing sound and productive portfolios we would like to include assets that have high returns, low volatility, and low correlation to the other assets in the portfolio. Looking at gold’s average annual returns, relative volatility, and relevant correlations, one should expect that gold would be a constructive addition to many portfolio allocations. In fact, gold even has a relatively low correlation with commodities in general (S&P Goldman Sachs Commodity Index). However, we should learn from the past but not expect it to repeat itself exactly. There is much to be learned from historic returns, volatilities, and correlations of asset classes. With all due respect to history and math, we must use reason when constructing portfolios. I view gold as a very narrow and idiosyncratic asset. So, I do not feel that it is wise to strategically allocate as much as 10% to the asset although the historic, mathematically optimal amount would be higher in the context of some portfolios.

What did I do? Based on my tests and observations, I bought a little gold last year for some of my clients. I have incorporated a small allocation to gold into their continuing strategic allocations.

====================================

My Note: This is great news even the Non Gold Bugs are become cautiously bullish!-jschulmansr

====================================

Catch the New Bull! – Buy Gold Online – Safely, quickly, and at low prices, guaranteed! Bullion Vault.com

====================================

Finally and extremely interesting article you want to read! Be sure to click on the chart links too…- jschulmansr

Economy Watch: What if Stocks Were Priced in Gold?- Seeking Alpha

By: Paco Ahlgren of Ahlgren Multiverse

“Everything has its limit — iron ore cannot be educated into gold.”

— Mark Twain

Several charts have been floating around the Internet for some time, showing the historical Dow Jones Industrial Average, priced in terms of gold. The simplest explanation entails thinking of the Dow divided by one ounce of gold; if the Dow is at 5000, and gold is at 500, then Dow-to-gold is 10. But it’s important to remember as you’re considering this ratio that the Dow is calculated in terms of dollars. So essentially, when we determine the Dow-to-gold ratio, it’s not just a simple ratio of gold to shares in the Dow, but rather it is a three-part ratio — Dow, expressed in dollars, to an ounce of gold.

Wouldn’t it just be easier to express gold in terms of dollars, or the Dow in terms of dollars? Well, those are certainly useful ratios — and we use them all the time — but what we’re really going after when we look at a historical Dow-to-gold chart is how well the Dow has performed, relative to the dollar, and relative to gold. What have inflationary pressures done to the Dow, in terms of gold and the dollar, over the past century? How have the three components moved in the various historical boom-bust scenarios? The results are interesting.

Let’s shift gears for a moment. Just off the top of your head, what would you expect stocks to do in periods of inflation? The dollar loses value rapidly, right? And that means prices of goods and services move higher, presumably with wages. So wouldn’t it stand to reason, intuitively, if corporations were making more money as prices increased, profits would increase too? And if profits increase, shouldn’t share prices go higher in response?

It turns out that inflationary price increases are bad for the stock market, and no period in history establishes this more concretely than the late 1970s and the early 1980s. Interest rates and prices soared, along with the price of gold, but stocks were flat. I want you to think about what I’m saying here: prices in general were going up, and yet the stock market was not. What this means is while stocks, in nominal terms, looked to be relatively stagnant, in real terms they were getting crushed. This is why the Dow-to-gold ratio is so significant as an indicator of relative value.

There is an elegant, simple truism that comprises every single transaction between buyers and sellers, and yet most people don’t even think about it: whenever you buy something, you are selling something else. When you buy corn, you are selling dollars. When you buy a Ford, you are selling dollars. If you are in Mexico and you buy a chicken, you are selling pesos. Of course, if you came from the U.S., you first sold dollars, bought pesos, and then sold pesos to buy the chicken. I know most of you already understand this concept, but I’m trying to emphasize that even when currency is used, every transaction is merely a trade; that is to say, the transaction is nothing more than negotiation that results in the exchange of two things — whether goods, services, or currency.

With that in mind, consider this: when prices rise because of inflation (printing of money), it isn’t so much that goods and services are getting more valuable — rather it’s much more accurate to say the currency is simply getting less valuable relative to everything else. If the dollar collapses, for instance, and the cost of a loaf of bread goes from $1 to $20 at the same time a share of Microsoft (MSFT) goes from $20 to $30, then Microsoft is severely under-performing — in inflation-adjusted dollars. A loaf of bread will cost you 20 times what it used to — not because it is more valuable, but because the dollar is less valuable. Meanwhile Microsoft is worth only 50% more. Relative to the dollar, shares of Microsoft are actually losing money — in a big way.

If you look at a chart of inflation from 1978 to 1982, you’ll notice a huge spike. If you look at a chart of the Dow Jones Industrial average during the same period, you’ll see that stocks traded sideways in a fairly well-defined range over the same period. But that doesn’t tell the whole story; if you adjust for the meteoric rise in prices during that five-year period, the stock market actually performed much worse than the nominal dollar fluctuations presented in the historical chart. In other words, the price of just about everything was going up dramatically, but stocks were not. So if you adjust prices back to “normal” levels, and adjust stocks accordingly, the picture for equities would have been horrible.

Now for the pièce de résistance…

Here is a series of charts of historical nominal gold prices (not adjusted for inflation), in several different currencies — the first of which is U.S. dollars. Take a look at the spike in the price of gold from 1977 to 1981. Now, if we go back to our original chart above, showing the Dow Jones Industrial Average, in direct relation to an ounce of gold (Dow-to-gold), you can see that the ratio went roughly 1:1 in 1980 — at the peak of the inflationary price surges. To clarify, the Dow was at about 750, as was gold.

But didn’t we say that, relative to rising prices, the Dow actually underperformed dramatically? So if you bought gold in the mid-1970s, not only was your investment skyrocketing, but the stock market — which was flat in nominal dollars — was actually doing very poorly relative to rising prices. Bear in mind that both the Dow and gold were priced in terms of nominal dollars at the time; they essentially “cancel out” — that is to say, relative to rising prices, gold also failed to perform as well as the nominal dollar-price. Still, it did offer an excellent hedge against rising prices, and even outperformed during the period.

What does all this mean? Well, for starters the average Dow-to-gold ratio over the last century has been about 9.5, and we are currently at about 8.5. So you’re probably thinking we’re oversold and due for a correction. In other words, the Dow-to-gold ratio is probably going higher, right? Well that was my first conclusion too, but actually on closer examination it turns out that’s probably not right at all.

For much of the last century the dollar was tied to gold, and while the relationship was never perfect — and the U.S. government betrayed the union many times, in many different ways — there was at least some relationship, which helped pull the ratio down. Eventually, excessive inflationary printing caught up with the government in the 1960s, and it became clear it wouldn’t be able to honor redemptions against the dollar at the price it had fixed. Nixon essentially defaulted on the U.S. promise to redeem dollars for gold by taking the U.S. off the standard in the 1970s — and this, more than anything else, allowed inflationary pressure to drive general prices into the stratosphere. This was the moment the Dow-to-gold ratio approached 1:1. To fight rising prices, Paul Volcker, the Fed Chairman at the time, pushed the Fed’s target interest rate past 20% and barely saved the U.S. economy from collapse.

For most of the next 20 years, gold fell and stock prices rose. Meanwhile, the U.S. government capitalized on the lie it had created and printed more and more money. Who really cared? Everyone was making money in the stock market, and prices remained relatively stable. In fact, every time prices failed to act “correctly,” the Fed simply changed the rate at which it would lend to banks. But the illusion of the monetary policy game couldn’t last forever; people used easy money printed by the government to buy assets they couldn’t afford throughout the economy — especially houses. Finally the pressure was just too much, and everything started unraveling in 2007. But the gold market seemed to understand the game couldn’t last, and around 2000 it started a slow, steady rise.

Relative to everything, the number of dollars in the system in early 2009 is almost incomprehensible. Once de-leveraging reaches its nadir — and it’s coming soon — those dollars are going to hit the economy and drive prices much higher.

What have we learned about stocks in such periods of rising prices? Not only do they fail to perform, but adjusted for inflationary price pressures, they actually under perform. General prices and unemployment will continue to rise. The consumer will continue to be unable to consume. Corporate earnings and dividends will continue to collapse as a result. Stocks are going lower — probably much lower.

And what about the price of gold? It will almost certainly continue to increase — not only because people will flock to its long historical stability and consistency, but also because there are simply so many more dollars (and yen, and rubles, and euros) in the world. Remember, the U.S. isn’t the only country printing innumerable sheets of currency. And in that context, remember also that inflationary price increases have almost nothing to do with increased demand, but rather they are the result of currency devaluation and destruction — through printing.

I just want to share two more charts with you. The first should give you a little perspective — it is a historical chart of gold, in both nominal and real dollars. Notice the real price of gold in 1980 (in 2007 dollars) was $2272 per ounce. If I’m correct about inflation and the fate of the dollar — and I’m confident I am — then we are nowhere near the historical high in gold. But I don’t think we’re merely going to re-test that high — I think we’re going to blow through it as the dollar loses value.

In the 1930s, as corporate earnings and dividends disintegrated, the Dow lost nearly 90% of its value from peak to trough. The U.S. was a creditor nation with a huge manufacturing base. The dollar was tied closely to gold. Since its peak in October 2007, the Dow has lost less than 50% of its value. The U.S. is a debtor nation with a relatively small manufacturing base. I can’t say it enough: we borrow profusely, we manufacture very little, and we consume gluttonously. Nonetheless, the consumer has now lost almost all his purchasing power, and corporate earnings and dividends are going to suffer massively as a result.

In 2007, the Dow peaked at about 14,150. To give you some perspective, an 85% drop in the Dow from peak to trough would put it at about 2100.

I know it’s easy to imagine the Fed has magical powers. I’ve fantasized about such things myself at times of extreme weakness — that maybe the Fed will “somehow” figure out a way to fight and defeat the unprecedented evil specter of inflation it is foisting on its unsuspecting children. Sometimes I do believe that our Lord and Savior Barack Obama will wave his charmed “unicorn horn of change” and all will be well again. Likewise, at times I feel like I could let Uncle Ben Bernanke take me just about anywhere in his helicopter of prosperity. My faith in the reverend John Maynard Keynes runs deep, as I hope, and hope, and hope. I find myself gleefully clicking my heels together and repeating, “the dollar is almighty, and the Stars and Stripes will prevail.” And when I am in this wonderful place, I have confidence that someday soon, we’ll all be buying houses with no money down, and with no jobs. Our driveways and backyards will once again overflow with boats, motorcycles, and sports cars.

Then I think about the 1930s. And suddenly I am wide-awake.

Let me ask you a simple question, and I want you to actually think about it. Do you really think we can’t get to the 1930s again? Do you really think that we’re going to return to the exuberant excess of the past few decades? If so, let me disabuse you of the notion: the United States was in much better shape, economically, going into the Great Depression than it is now. Prosperity is not coming back to the U.S. as we know it. We are in a lot of trouble.

Is a Dow-to-gold ratio of 1:1 so incomprehensible? Again, it has happened before — several times. But I’ll even take it a step further: what about a Dow-to-gold ratio of .5? Or less? I promise you, if the Fed fails to soak up all the dollars it’s putting in the system, that’s exactly where we’re going. And what, you may ask, does the Fed use to “soak up dollars?”

I’ll be glad to tell you that too. When the Fed needs to take dollars out of the system, it sells Treasuries (which means it buys dollars). The problem is, the U.S. debt-load is astronomical. Who, exactly, is going to buy that debt from the Fed? And at what interest rate? Remember, if the Fed is desperately trying to take dollars out of the system, there can be only one reason: it is scared of rising prices caused by inflation. But if the Fed floods the market with Treasuries, it will achieve exactly the opposite effect it’s looking for — it will cause rates to rise, probably dramatically. Do you really think the Chinese and the Japanese are going to buy Treasuries at a 2% yield if the Fed is panicking and trying to buy dollars to stop an inflationary price explosion? If so, you’re delusional. Chinese and Japanese people are smart. They’re not going to fund an inflationary dollar at 2%. Ever.

In the past it might have worked. Of course, in the past, the U.S. money supply was much smaller, and our ability to borrow was much stronger. But those days are gone.

As if I haven’t terrified you enough, the last thing I’m going to leave you with is really scary. It is a link to an excellent article by Mark J. Lundeen, whose insight into this economic catastrophe has been stupefying since long before all of this even started. Embedded in the article is a chart that shows historical dollars-in-circulation, relative to U.S. gold.

With that, I think I’ll let you do the rest of the math. Sleep well.

Disclosures: Paco is long gold.

Copyright 2009, Paco Ahlgren. All Rights Reserved.

==================================

If you have done the math…

Catch the New Bull! – Buy Gold Online – Safely, quickly, and at low prices, guaranteed! Bullion Vault.com

=================================

That’ it for now – Good Investing – Jschulmansr


Nothing in today’s post should be considered as an offer to buy or sell any securities or other investments, it is presented for informational purposes only. As a good investor, consult your Investment Advisor, Do Your Due Diligence, Read All Prospectus/s and related information carefully before you make any investments. –  jschulmansr

Share this:

  • Click to share on Reddit (Opens in new window) Reddit
  • Click to share on Facebook (Opens in new window) Facebook
  • Click to share on LinkedIn (Opens in new window) LinkedIn
  • More
  • Click to share on X (Opens in new window) X
  • Click to share on Pinterest (Opens in new window) Pinterest
  • Click to share on Tumblr (Opens in new window) Tumblr
  • Click to print (Opens in new window) Print
  • Click to email a link to a friend (Opens in new window) Email
Like Loading...

Today’s Technical Corner – Gold Whats Next?

28 Wednesday Jan 2009

Posted by jschulmansr in agricultural commodities, Bailout News, banking crisis, banks, bear market, Bollinger Bands, bull market, capitalism, central banks, China, Comex, Copper, Currencies, currency, Currency and Currencies, deflation, depression, dollar denominated, dollar denominated investments, economic, Economic Recovery, economic trends, economy, Federal Deficit, Finance, financial, Forex, Fundamental Analysis, futures, futures markets, gold, Gold Bullion, Gold Investments, gold miners, hard assets, How To Invest, How To Make Money, India, inflation, Investing, investments, Jim Sinclair, Junior Gold Miners, Latest News, Make Money Investing, market crash, Markets, mining companies, mining stocks, Moving Averages, oil, palladium, physical gold, platinum, platinum miners, precious metals, price, price manipulation, prices, producers, production, silver, silver miners, small caps, spot, spot price, stagflation, Stimulus, Stocks, TARP, Technical Analysis, U.S. Dollar, Uncategorized

≈ 1 Comment

As I write Gold is currently down $10.80 at $886.90, taking a much needed breather from its recent upward thrust. If Gold can hold and consolidate around this level the next target will be $920 and then $950. Today’s post contains articles on how to trade gold for those who don’t like risk, much tecnical analysis and more… -jschulmansr

==============================================

Catch the New Bull! – Buy Gold Online – Safely, quickly, and at low prices, guaranteed! Bullion Vault.com

==================================================

A Guide To Buying Gold for the Risk Averse – Seeking Alpha

By: J Clinton Hill of Hillbent.com


Lately, there has been plenty of talk about gold and a growing consensus that favors bullish fundamentals. Here’s my take on gold based upon the Spyder Gold Trust ETF (GLD) and its most recent wave, i.e. from its 1-15-09 bottom at 78.87 to its 1-26-09 top at 90.19.


Catch the New Bull! – Buy Gold Online – Safely, quickly, and at low prices, guaranteed! Bullion Vault.com

================================================.

That’s it for today click on one of the subscribe buttons to receive all the latest news for Gold and Precious Metals, and much more!

Good Investing! – Jschulmansr


Nothing in today’s post should be considered as an offer to buy or sell any securities or other investments, it is presented for informational purposes only. As a good investor, consult your Investment Advisor, Do Your Due Diligence, Read All Prospectus/s and related information carefully before you make any investments. –  jschulmansr


Catch the New Bull! – Buy Gold Online – Safely, quickly, and at low prices, guaranteed! Bullion Vault.com

============================================

Hourly Action In Gold From Trader Dan

Source: Trader Dan Norcini of JRMineset

Gold appears to have run into resistance near the $920 level which is blocking its upward path for now. Since we know that the funds are purely technical traders and have been buying, both adding new longs and for those who were short, getting out by covering, while open interest has been steadily increasing, it is safe to say that the bullion banks are the ones blocking the upward trajectory. Nothing new there and it does not take much observation for those who have been watching gold the last 8 years to know this.

The inability of the mining shares to continue higher yesterday, even in the face of a much higher bullion price, gave some paper longs at the Comex a reason to cash in some profits and emboldened the bears to dig in their heels.

To show you how fickle these markets have become, do you remember when gold was following the equity markets around not all that long ago. They went down – it went down. They went up – it went up. It was all about the famous “risk aversion” or deleveraging trade. Now the exact opposite seems to be happening. The equities go up and gold goes down. Well guess what they have come up with to now explain this turn of events? Yes – risk aversion!

Here’s the latest – equities are going up because supposedly some of the news from the banking sector is not as dire as many have come to expect. The bearish sentiment in the equity markets is misplaced. Gold has been going up because of banking sector fears and currency risk. Ergo – gold should now go down as those fears are overblown because the risk averse psychology has become too excessive. In other words – all’s clear and the water is just lovely so dive on in!

I could not make this stuff up if I tried.

Had enough – how about this one?  – Gold has now broken its relation to the Dollar. The fact that the Dollar was being bid up was evidence of a panic into safety. Now that the Dollar is going down it means that the panic is subsiding. Therefore gold should go down as well which means the inverse relationship between gold and the Dollar has been severed.

Again, I am just repeating the latest mantra du jour.

Just wait and see – when gold starts going up as the Dollar starts going down the same guys who came up with the latest explanations will be singing how the historic relationship between gold and the Dollar has been restored once again. No matter what happens – they will have proven to be right! Geniuses all!

It reminds me of the global warming crowd. When droughts were springing up and record highs were being shattered it was called global warming. When record snowfalls suddenly showed up and record lows were being set as people all over the globe freezing their keisters off,  it morphed into climate change. No matter which way the temperatures go, that crowd will always be right! Shame on you climate destroyers for not cramming your family into something that more closely resembles a go-kart rather than an automobile on your assorted trips around town. If you had any concern for the planet you would be riding a horse to work. Then again that creature gives off methane gas which is actually being seriously considered as a pollutant and thus liable to be taxed by the idiots in Washington DC, so no matter what you do, you are royally screwed. It’s too bad that there remains no undiscovered country where freedom loving people who believe in honest money and limited government could sail off to and found a nation where the money changers and government control freaks would be banned from entering.

By the way, did you notice that the new President just signed the death sentence for the US automotive industry yesterday by mandating new mileage efficiency standards – all in the name of saving us from a problem that does not exist? Yep – nothing like telling an industry already on life support that their most profitable units, the bigger and safer vehicles, will have to go in favor of smaller, less profitable ones. Don’t touch the unions however whose demands have forced the US auto industry into concentrating their efforts on the more profitable lines (the larger vehicles) in an effort to offset the financial drain imposed upon them by the exorbitant salaries and benefits that they are forced to pay these same unionized workers.

Remember that big move up in Copper yesterday? Remember how the existing home sales number ran all the shorts out and pushed the market right into technical chart resistance threatening an upside breakout? Well, that is history today as it went “KERPLUNK”! To show you how utterly insane these markets have become and the farce that the hedge funds have turned them into, consider this – Copper closed at 1.4720 on Friday. On Monday it rallied sharply blasting upwards closing at 1.5865 reaching a high of 1.6310. Today it collapsed making a low of 1.4545 and closed at 1.4850, down 10 cents a pound. In other words, it went NO WHERE in TWO DAYS but in the process it careened all over the place blowing out upside buy stops before triggering a wave of downside sell stops today. And to think this hedge-fund created madness has become the price discovery mechanism by which commercial producers and end users are somehow supposed to be able to enter into contracts and hedge risk to ensure profitability. I have been watching these futures markets for more than 20 years and I have never seen such idiocy. This is what happens when computers have taken over trading decisions based on nothing but the latest price tick. I know it sounds excessive to some, but I honestly have come to believe that the entire futures industry is very close to being destroyed by these out of control hedge funds. A commercial entity simply cannot use these markets to hedge and without commercials these markets cannot survive since they will serve no useful purpose whatsoever as all that will be left is hedge funds trading their algorithms against the algorithms of other hedge funds with the commercials using forward contracts amongst themselves and bypassing the futures markets altogether.

Back to gold – technically gold still looks very good although it has stalled just below the $920 level. Ideally, it would hold support on any subsequent RE-test of the Downsloping trendline of the wedge formation on the weekly chart which is drawn off the July and October highs. That comes in near the $880 level. I would prefer to see it consolidate above the $880 level but would view an ability to hold above the $870 level as still friendly. Failure at $870 would give the shorts enough impetus to try to shove it back to $850- $840.

Upside resistance remains near $920 while more formidable resistance comes in near the $945-$950 region. That corresponds to both Downsloping trendline resistance drawn off the peak high made back in early 2008 and the July high which also happens to be the highs made back in October last year. Those are the parameters we are working with technically.

On the daily chart, all of the major moving averages, including the 100 day moving average are all now trending solidly upwards. The 10 day is close to making a bullish upside crossover of the 20 day which will give some trend following funds a reason to buy while the RSI remains below the 70 level. So we have room to run to the upside IF, and this is a big IF, the market can push through the bullion bank selling near $920. The inability of the mining shares to continue moving higher does concern me however. In an ideal bullish environment for gold, the shares move higher alongside the bullion price.

It looks to me like the weakness in crude oil today is contributing some downward pressure in gold as many of those fund algorithms use its price action as a factor in their selling or buying of commodities. Weaker crude oil prices give rise to the deflation scenario and that still leads some to sell gold because of misguided notions of how it will perform during periods of general price deflation. Again, gold is primarily a currency – not a commodity, and it will rise when faith in paper currencies falters, all of the arguments of the deflationists notwithstanding. When governments slash interest rates to NOTHING and issue more and more paper IOU’s, the sheer supply guarantees that they will lose value meaning that investors seeking wealth preservation are buying scraps of paper that pay zero return and lose any “value” that they might have once possessed. Gold thrives in such periods as it is solid, substantial and cannot be diluted by conniving Central Bankers. Which would you rather have in your hand during times of financial chaos and upheaval – a promise by a politician or a metal which has stood the test of 6,000 years? If you have any problem making a decision, I suggest you take a good look at the price chart of the British Pound and especially the price of gold in Sterling terms.

The HUI and the XAU were unable to manage strong closes above their former double tops make back in mid-December of last year and early January of this year in yesterday’s session meeting up with selling from the opening bell and never quite being able to shrug that off. Still, their charts look good as they are consolidating right around that former double top. I would like to see them hold above the 10 and 20 day moving averages near the 115 – 116 level in the XAU and 279 – 282 in the HUI.

Bonds finally saw an up day today which is to be expected given the beating that they have taken of late. The downdraft in bonds could be called “parabolic in reverse”. Jim likes to call it a “waterfall”, which is an apt description considering the fact that if one were long while this has occurred, they have indeed taken a bath in their trading accounts or better yet, drowned under a sea of red ink.

The Dollar is generally weaker today although it has bobbed back and forth between a small gain and a small loss. The charts still appear to show a technical failure near the 88 level. It is treading water above the 50 day moving average (barely) while the 100 day lies near the 83.50 level. A breach of that level and it should move back down to retest 80.

Click chart to enlarge today’s hourly action in Gold in PDF format with commentary from Trader Dan Norcini

January2709Gold1230pmCDT.jpg

===========================================================

1. Before 2009 is out the next major economic shock will become obvious. There is not one major funded retirement program intact thanks to the manufacturers and distributors of OTC derivatives. The unfunded ones are a total loss. Retirement in the future is totally out of the question. Many now retired will end up in the same situation as those trying to live off fixed income. Both categories are being culled from the human gene pool.
 
2. By my 68th birthday Obama will recognize his position as a bagged President, knowing then that the economic situation does not have any practical solution.
 
3. By July 4th, 2009 the rally in the US dollar will have become a simple hope for the lows to hold.
 
4. My long held targets of $1250 and $1650 for Gold that were once laughed at as outrageously high can now be laughed at for being painfully too low.
 
5. Only gold and related shares are insurance against the economic cataclysm now taking place.

Everyone is looking for where and when the top in gold will come. Will it be Jim’s $1650 or Alf Field’s $10,000 plus before it comes back down?
 
To put it nicely, you are all wrong. Gold is going up and STAYING up.
 
There is no top to look for because like all things people strive for, the top does not exist.
 
Gold will trade within $200 of a given point as a product of the Master of the Financial Universe, Paul Volcker, taking control when all this is totally out of control. He will instate the revitalized and modernized Federal Reserve Gold Certificate Ratio, not gold convertibility, and not tied to interest rates as an automaticity. Only then can Volcker put in place policy backed by the sitting administration that has a provable history of starting the change from deficit to surplus, his price of saving the world one more time.
 
The Gold mining business will then be the best business there is and the highest dividend paying monetary utility.
 
Respectfully yours,
Jim
=========================================================

Catch the New Bull! – Buy Gold Online – Safely, quickly, and at low prices, guaranteed! Bullion Vault.com

==================================================

The Resurgence of Junior Gold Miners – Seeking Alpha

Junior mining stocks were all the rage back in the early stages of the gold bull market. During the time frame of 2002-2006 many junior miners were putting in annual gains of 200%, 300% or more. Some junior miners like Seabridge Gold (SA) produced 3-year returns in excess of 1500%! It seemed like you could close your eyes and randomly point your finger at a list of junior gold miners, buy the stock and sell a few weeks later for a gain of 30% or more. No feasibility study, no permits, no management experience or path to production… no problem!

But volatile stocks are volatile in both directions and when the gold market corrected, junior miners lost all of those gains and then some. Amateur investors that were patting themselves on the back and recommending investments to their buddies based on their recent success were caught off-guard by the severity of the decline in the junior mining sector and suddenly found that they gave back most or all of their gains. To be sure, some booked profits and got out before the ship sank, but most were caught unsuspecting and unwilling to believe the party could be over so quickly. Many junior miners lost 80% or more of their market cap during the past year or two.

Precious metals investors have a sour taste in their mouth in regards to junior miners and have largely dismissed the entire sector as too risky. For many investors, junior miners have been removed from their portfolios, watch lists and consideration set for future investments. Newsletter writers and analysts that couldn’t contain their excitement over the next “5-bagger” rarely mention a word about juniors these days. While much of this condemnation is warranted, I think we should be careful not to throw the baby out with the bath water.

While I will acknowledge that 75% or more of junior mining companies are not good investments and many will go out of business with credit markets contracting, there are still quite a few impressive juniors that deserve a second look now that the dust has settled. Mine production is decreasing and the larger miners will need to acquire junior miners with quality properties in order to add to their pipeline and keep their production numbers growing. After a massive sell-off that brought the entire sector crashing down, some of the most promising juniors have finished a bottoming pattern, consolidated and have already began moving up very impressively. Cash-strapped investors and weak hands have been shaken free of their junior mining shares as the focus has shifted to more “safe” and liquid investments. Has this produced an opportunity for savvy precious metals investors to pick up quality mining companies at undervalued prices? Here are my main criteria for selecting which junior mining companies are worth my investment dollars.

  1. Already producing or moving toward production in the next 1-2 years
  2. Quality properties in politically-stable areas with necessary road access
  3. Proven and probable resources that justify a higher market cap
  4. Seasoned management that has a track record of bringing projects to production
  5. Healthy balance sheet with cash on hand and/or the ability to raise capital easily

Many of the companies that meet most or all of the criteria above have already bottomed and are quietly posting exceptional gains that outpace those of the major producers. Even with today’s decline in gold equities, many of my favorite juniors are up 100% or more since their respective Q4 2008 lows. A few of these companies were recommended in the premium subscription service and have been masked out of respect to paying subscribers. All of the gains listed below were produced in just 1-3 months and illustrate the explosion in junior miners that most analysts and newsletter writers seem to be missing.

click to enlarge

As the entire gold and silver sector has done well over the time period, I have included the PHLX Gold and Silver Index (XAU) index at the bottom for comparison sake. While the XAU is up 85%, the average gain for the junior mining companies that we track over the same time period is 171% or double the gain of XAU. Junior miners are not only joining in this latest rally, they are leading the rally and gaining at twice the pace of the major gold mining companies.

Those that are comfortable with a higher risk/reward proposition might want to take a second look at junior mining companies during 2009. If the trend continues or accelerates as investors warm back up to juniors, we could see the return of another explosive few years for junior mining companies as gold pushes above $1,000 on its way towards its inflation-adjusted high of $2,300.

Catch the New Bull! – Buy Gold Online – Safely, quickly, and at low prices, guaranteed! Bullion Vault.com

===================================================

Now From One of the Masters’ Himself Jim Sinclair

Jim’s Outlook On 2009


First, to keep things in proper perspective, GLD has already appreciated 27% since Nov 12, 2008. Also, let us not forget that central banks have a perverted sense of humor and plenty of “funny money” and other diversionary tricks up their sleeves to defer the inevitable arrival of inflation. With this as our background, I will jump right into my strategic analysis for trading or investing in gold.

GLD hit resistance at 90.19, has retreated and appears headed to test support at 86.50 with the possibility of also filling a minor gap at the 85 level.

If support holds, the natural inclination is to buy (entry at 86.75 with a stop loss at 84.12 for -3% maximum loss). Assuming one is playing this trade for an exit at its most recent resistance, i.e. at 90.19, the risk to reward ratio is only at 1.33. In a fear-driven market environment, I am strongly inclined to pass on these odds (even with beer goggles).

Ideally, a trade with a minimum risk to reward ratio at 3 or 4 is much more seductive, even in interesting times like these. However, to find the ideal opportunity, one needs to be patient and think counter-intuitive to the buy low and sell high paradigm. Hypothetically (I only say “hypothetically” because I have been long GLD at 74.85 since Oct 29, 2008), I would wait for GLD to break above its resistance at 90.19 and buy at $90.50. This would confirm that there is additional demand and fresh support at this level.

Here is where the trade can get a little tricky. There is some resistance at the 92 level and one should probably anticipate a minor pullback and retest of the newly established level of support at the 90 area. However, if support is violated, I am willing to accept a stop loss at 89 for a -1.5% maximum loss of capital. In the majority of instances when support fails the “retest”, this signals a false breakout.

Now let’s get to the good part. If the breakout is legitimate, then GLD should run to the 97.50 area, which is its next level of major resistance and also where I would definitely be inclined to book some short-term profits or at least hedge my position with long puts and/or short calls. Under this scenario, this trade presents a much more attractive risk to reward ratio at 5.24.

Gold certainly has both technical and fundamental positives going for it. The short, intermediate, and long term are all trending upward while the monetary policies of global central banks reflect a desperate willingness to accept future inflation to avert the immediate threat of deflation. Another tail wind, also aiding gold’s bullish movement, is the recent weakness and apparent correction in the U.S. Dollar Index.

In summary, the example of the above trading strategy is an opinion on how to play gold for those who are risk averse and can ill afford to lose more capital. Otherwise, for those turned on by a fundamentally bullish or bearish bias towards the precious metal, assume the position (pun intended) and enjoy the ride along with all its ups and downs. Yeah Baby!!!

Disclosures: Hillbent.com, Inc. or its affiliates may own positions in the equities mentioned in our reports. We do not receive any compensation from any of the companies covered in our reports

=============================================

============================================

Share this:

  • Click to share on Reddit (Opens in new window) Reddit
  • Click to share on Facebook (Opens in new window) Facebook
  • Click to share on LinkedIn (Opens in new window) LinkedIn
  • More
  • Click to share on X (Opens in new window) X
  • Click to share on Pinterest (Opens in new window) Pinterest
  • Click to share on Tumblr (Opens in new window) Tumblr
  • Click to print (Opens in new window) Print
  • Click to email a link to a friend (Opens in new window) Email
Like Loading...

Are We Getting Ripped Off? Latest Bailout and Gold News

21 Wednesday Jan 2009

Posted by jschulmansr in agricultural commodities, alternate energy, Austrian school, Bailout News, banking crisis, banks, Barack Obama, bear market, bull market, capitalism, central banks, Comex, commodities, communism, Copper, Currencies, Currency and Currencies, deflation, depression, dollar denominated, dollar denominated investments, economic, economic trends, economy, Federal Deficit, Finance, financial, Forex, Fundamental Analysis, futures, futures markets, gold, gold miners, How To Invest, How To Make Money, inflation, Investing, investments, Latest News, Make Money Investing, Markets, mining companies, mining stocks, Moving Averages, oil, palladium, physical gold, platinum, platinum miners, Politics, precious, precious metals, price, price manipulation, prices, producers, production, rare earth metals, recession, Religion, silver, silver miners, spot price, stagflation, Stocks, Technical Analysis, Today, U.S. Dollar, volatility, warrants

≈ 3 Comments

Tags

agricultural commodities, alternate energy, Austrian school, Bailout News, banking crisis, banks, bear market, Bollinger Bands, bull market, capitalism, central banks, China, Comex, commodities, communism, Copper, Currencies, currency, deflation, depression, diamonds, dollar denominated, dollar denominated investments, economic, economic trends, economy, Federal Deficit, financial, Forex, futures, futures markets, gold, gold miners, hard assets, heating oil, India, inflation, investments, Keith Fitz-Gerald, Marc Faber, market crash, Markets, mining companies, Moving Averages, natural gas, oil, palladium, Peter Schiff, physical gold, platinum, platinum miners, precious metals, price, price manipulation, prices, producers, production, protection, rare earth metals, recession, risk, run on banks, safety, Saudi Arabia, Sean Rakhimov, silver, silver miners, socialism, sovereign, spot, spot price, stagflation, Technical Analysis, timber, U.S. Dollar, volatility, warrants, Water

Are We Getting Ripped Off? Read Today’s Post dealing with the Bailout, Gold Price Manipulation and more. I’m back, we have a new President, what does this mean for your investments… Read On and Good Investing! – jschulmansr

Preventing The Greates Heist In History- Seeking Alpha

By: Whitney Tilson of Value Investing

There’s currently an idea to fix the financial system that’s getting quite a bit of traction: an RTC-type program whereby the government would buy $1 trillion of troubled assets from struggling U.S. banks, with the goal of restoring them to health so they can begin lending again, leading to an economic recovery.


The problem with this idea (let’s call it “New RTC”) is that either the government will pay market prices for the toxic assets – in which case, it will simply accelerate the collapse of our financial system – or pay above-market prices, in which case taxpayers will likely suffer big losses.


De-Leveraging Is Not Deflation-Seeking Alpha

By: Paco Ahigren of Ahigren Multiverse

“Inflation, as this term was always used everywhere and especially in this country, means increasing the quantity of money and bank notes in circulation and the quantity of bank deposits subject to check. But people today use the term `inflation’ to refer to the phenomenon that is an inevitable consequence of inflation, that is the tendency of all prices and wage rates to rise. The result of this deplorable confusion is that there is no term left to signify the cause of this rise in prices and wages.”

— Ludwig von Mises

It’s true that just about every asset class is coming down in price right now. This, however, is not deflation — as I have said so many times recently, much to many readers’ unqualified chagrin. To the contrary, these declines are the products of de-leveraging — not deflation — and the distinction is nearly incalculably important, although the subtlety seems to elude even the most astute these days.

If the previous premise is true (which it is), any removal of money from the economy would eventually result in an increase in the value of our currency, relative to everything else. And that, in turn, would eventually translate into lower prices in dollars. But that’s clearly not what is happening. No, the Fed is printing money, sending the amount in the economy higher than ever seen in U.S. history. That’s not deflationary. That’s inflationary.

Just so you’ll know, here’s the definition of inflation I’m using. And before you pooh-pooh it with too much eagerness, remember that one of its authors, F.A. Hayek, won the Nobel Prize in economics in 1974.

Look, the thing we should be worried about is relative value, not “inflation,” per se. It’s not about the growth of M0, or M1, or M2 (or even M3, if you keep up with shadowstats.com), so much as it is about what the money supply is doing relative to everything else that is happening. I know assets are falling in price — believe me, I get no shortage of reminders every single day. But the amount of money in the system — not just M0 — is increasing at a tremendous rate. I won’t argue that the relative value of things like real estate and equities are going to continue to drop — maybe even dramatically, and for a long time — in terms of demand (or lack thereof). No, what I’m most concerned about is that demand will stay extremely low, and yet prices will rise anyway because of the increase in the amount of money in the system.

But it’s not just money; it’s also Treasuries. The Fed has specifically stated that its objective is to stimulate “inflation” (by its definition). It wants prices to rise, and it’s going to do everything it can to find success. But the amount of money in the system is unprecedented. When the Treasury bubble starts to collapse, yields are going to explode. Yes, the Fed will probably print more money to buy down the long-end of the curve, but how long will that work? Some people say years, but how? Do you really think the Chinese and the Japanese are going to keep funding that sort of behavior? Or even more importantly, do you think they’re just going to sit on their current holdings? Probably not, and if they start dumping Treasuries, yields are going much higher.

It’s not a matter of if this is going to happen. Yields can’t stay where they are for any sustained amount of time, and once they start rising, so will prices. But will demand for, say, houses have increased? No. Cars? No. Boats? Televisions? No. Why? The American consumer is tapped out.

Credit card companies are tightening limits prodigiously. Teaser rates are all but gone. Home equity has dried up. The consumer has driven two-thirds of our economy for at least the last few decades, and now the consumer is dead. There’s another aspect to this that I won’t go too deep into: the American consumer protects his or her credit score for one reason — to obtain future credit. But the consumer also knows that loans have dried up — not just today, but for the very distant future as well. You know these consumers have to be thinking about defaulting; if they can’t get loans anyway, why would they not default on thousands of dollars in unsecured credit card debt? I plan on writing more about this in future articles, but suffice it to say, I think credit card companies are going to give us the next blow to our collective stomach, and it’s going to hurt.

So here we have a situation in which demand is gone, and yet prices and rates are rising — because of inflation (printing money) and the Treasury collapse. And that’s the point: it’s not going to come from just one source. It’s not just going to be inflation (printing money). It’s not just going to be the collapse in Treasuries. It’s not just going to be the nearly unfathomable costs of the stimulus packages that are coming online in the next two years. It’s going to be the confluence of all of it. And if I’m right about the continued deterioration in credit markets, things will be even worse.

You think it’s not different this time? Add it all up, in real dollars — the staggering amount of debt, the parabolic rise of currency in the system, the annihilation of real-estate investment, and the demise of the consumer. $8.5 trillion committed to bailouts and stimulus packages. Oh, yes it is different this time. It’s very different.

Credit cards didn’t even exist in 1930, and the dollar was backed by gold. Credit cards barely existed in 1973. Nixon had just taken us off the gold standard, and look what happened? Volcker was immensely lucky to have stopped hyperinflation, and look at the extreme measures he had to employ to do it.

Of course, every time I bring all of this up — which is a lot lately — somebody starts talking about the velocity of money. And pretty soon after that, somebody starts talking about the multiplier effect.

Yes, the U.S. employs a fractional reserve system, and while that system certainly lends to rising prices and yields, the amplifier effect is not inflation. Like the printing of money, the fractional reserve system is only one ingredient in the poison that lends to the ultimate catastrophe inspired by central banks: rising prices and increased costs of borrowing.

And then there’s velocity…

While I am eternally grateful to my critics for forcing me to defend the theories I hold dear, I sometimes fatigue of the incessant snapping at my heels by people who want me to know that the velocity of money has slowed down. I know the velocity of money has slowed. It doesn’t matter. It’s not going to stay this low for long, and when it starts speeding up, it’s not going to be a “good thing.” Treasuries are going to break, rates and prices are going to rise, and all that money pressing against the dam is going to find a crack. Why? It has to. People will flee from dollars that are losing value. They will extract all the dollars sloshing around the system, and they will buy commodities and durables in order to preserve the value of their wealth.

Remember, just because the dollar is losing value does not mean that the concomitant subsequent rise in certain asset classes necessarily means that demand for all assets has increased dramatically — as it did during previous eras of easy money. Demand for assets economy-wide can continue to wane even as people spend dollars as fast as they can get them in the midst of rising prices. And this is a very important distinction: prices can rise because of demand, but prices can also rise because of excessive increases in the amount of money in the system. If prices are rising without a simultaneous increase in demand, well, I can’t think of a more dangerous economic environment to be in.

You don’t believe it can happen? You think there’s a huge demand for houses, cars, and boats in Zimbabwe? Prices there are rising exponentially, but there is very little demand for assets — other than staples, of course. What do you think their velocity of money is?

The other day I wrote that Treasuries and the dollar are not “safer” than gold, and for my efforts I was heckled by several readers. Ultimately, however, flight-to-quality will seek the true risk-free rate of return, and this is yet another factor that will contribute to the imminent ferocity of the move that’s coming. Once Treasuries unwind, people and institutions will scramble to find a place to put the money they had once placed in the “safety” of U.S. government debt. And unless you know of a medium whose historical consistency and safety surpasses gold’s, that will be the place investors find haven.

Just for future reference: when I say the dollar’s going to fail (which it is), and you’re hovering over your keyboard, poised like some bird-of-prey, ready to strike me with all the ire of God-upon-Sodom, will you try to remember that I acknowledge velocity is, at least for the time-being, near zero. Will you also try to remember that I don’t believe the massive increase in currency alone will not be responsible for imminent rising rates and prices? In fact, I think Treasuries are going to play a greater role in the beginning.

Also, I agree with many of you that my timing may be a bit premature, and I exited my TBT after the last run-up. Unfortunately, today the stock market and Treasuries are getting crushed as gold rallies. I wouldn’t want to declare myself “right” based just on the behavior of these markets in recent days. That would be stupid. And yet I sit here and watch TBT move higher, wondering if getting out was even more stupid.

To add to my trepidation, some sort of manager in the South Korean finance ministry came out over the weekend and announced that the time has come to sell U.S. Treasuries. How do you think that made my stomach feel? Of course, Bernanke keeps promising to do battle with the long end of the curve, so maybe he’ll make good on his threat and I can find a point to get back in comfortably.

Of course, if I miss the move because I listened to some of you cynics. Well, at least I still own gold.

Disclosures: Paco is no longer short U.S. Treasuries (although he hopes to be again soon). He is long physical gold, and the Proshares Ultra long gold ETF (ticker: UGL).

Copyright 2009, Paco Ahlgren. All Rights Reserved.

================================================

On Gold Price and Market Manipulation 

Questions Begging Answers- GoldSeek.Com

By: Rob Kirby of Kirby Analytics

To say that markets have been behaving “strangely” recently is an understatement.  In recent weeks and months we’ve been witness to historic lows in sovereign interest rates in-the-face-of record amounts of debt being issued by governments?  We’ve seen the price of gold behave counter intuitively by “not rising” in-the-face-of unprecedented systemic global economic malaise?  Last, but not least, we’ve witnessed a “complete flip-flop” in the traditional pricing of Brent Crude Oil [IPE-London] versus West Texas Intermediate [NYMEX-N.Y.]?  


So we have the price of gold, the price of crude oil and interest rates – three items vital to the integrity of the U.S. Dollar – ALL trading in total disregard for their underlying fundamentals?


The following is a thought provoking analysis with commentary:


The Situation In Gold


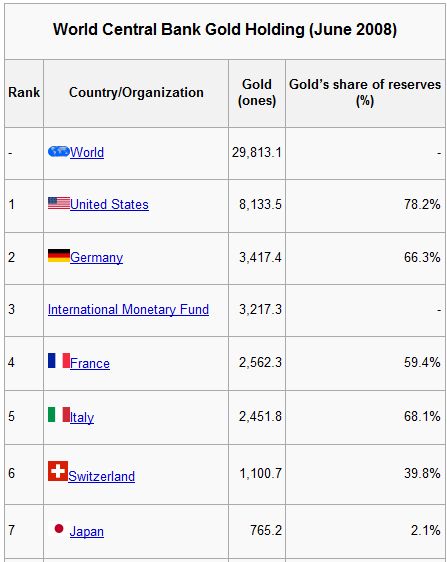
First and foremost it is imperative that everyone realize and understand that Gold “is” Money.  We know that gold is money because every Central Bank in the world carries gold on their balance sheets as ‘an official reserve asset’.


With that in mind, folks would do well to read one of James Turk’s latest articles titled, The Fed’s blueprint for market intervention .  In this article, Turk offers commentary on a recently unearthed 1961 document from the archives of the late, long-time former Chairman of the Federal Reserve, William McChesney Martin Jr. which details in the Fed’s own pen; their plans to intervene surreptitiously in the currency and gold markets to support the dollar and to conceal, obscure, and falsify U.S. government records so that the intervention would not be discovered.  In Turk’s words,


“In short, [the newly unearthed document] lays out what the Treasury and Federal Reserve needed to do in order to begin intervening in the foreign exchange markets, but there is even more. This document plainly shows what happens when government operates behind closed doors. It also makes clear the motivations of the operators of dollar policy long described by the Gold Anti-Trust Action Committee and its supporters — namely, that the government would pursue intervention rather than a policy of free markets unfettered by government activity. The run to redeem dollars for gold had put the government at a crossroads, forcing it to make a decision about the future course of dollar policy. This paper describes what the government would need to do by choosing the interventionist alternative.

This document provides primary, original source supporting evidence that GATA has been right all along.” 


In Feb. 2007 here’s what the Royal Bank of Canada’s Chairman, Tony Fell had to say, confirming unequivocally that gold is money,


“At Royal Bank of Canada, we trade gold bullion off our foreign exchange desks rather than our commodity desks,” says Anthony S. Fell, chairman of RBC Capital Markets, “because that’s what it is – a global currency, the only one that is freely tradable and unencumbered by vast quantities of sovereign debt and prior obligations.
“It is also the one investment and long-term store of value that cannot be adversely impacted by corrupt corporate management or incompetent politicians,” he adds – “each of which is in ample supply on a global basis.”


In short, says Fell, “don’t measure the Dollar against the Euro, or the Euro against the Yen, but measure all paper currencies against gold, because that’s the ultimate test.”


Fell’s admission coupled with the recently unearthed account of the Fed’s game plan shows that gold “is” and always has been feared as competition for the U.S. Dollar and a game plan has long been in place to thwart it.  This explains why economic data has been falsified and the price of gold has been surrepticiously managed and interfered with by the United States Treasury and the Federal Reserve.


The mounting evidence is this regard is so compelling that from this point forward any ‘economist’ attempting to explain our current situation without prefacing their explanation with an EXPLICIT ACKNOWLEDGEMENT that our capital markets are not free and are in fact RIGGED by officialdom – their analysis is not worth the time to read it.  In this regard, perhaps never have more prescient words been uttered than GATA’s Chris Powell in Washington in April, 2008 – when he opined, There are no markets anymore, just interventions.


The recent decoupling in price of gold as measured by the spread between the futures price and the cost to obtain physical ounces is a stark reminder that smart money is beginning to repudiate fiat money by seeking tangible ownership of goods perceived to posses value instead of derivative ‘promises’ to deliver the same.


The Oil Picture


Back in June, 2007, Market Watch reported,


Normally, Brent crude costs $1-$2 less than WTI crude, according to James Williams, an economist at WTRG Economics. At its peak, the price spread between the two topped $5, according to his data.


The article went on to explain,


WTI usually trades at a premium to Brent “because of the slightly higher quality, and the extra journey” oil tankers have to take to get the oil to the U.S., according to Amanda Lee, a strategist at Deutsche Bank. So “WTI minus dated Brent should be roughly equal to the freight rate,” she said. Indeed, “crude-oil prices usually depend on two things: quality and location,” said Williams. “The greater the distance from the major exporters, the greater the price.”


But here’s what’s happened recently in the global crude oil market:


Brent Crude trading at a 7 Dollar premium to West Texas Intermediate is like the SUN rising in the west and setting in the east – and no-one asking any questions why?


Thanks to the unearthing of the Fed’s Playbook Document, referenced above, along with cumulative knowledge of the existence of the President’s Working Group On Financial Markets [aka the Plunge Protection Team]; we know that interference in strategic markets with national security implications is now practiced commonly by the Government and the Fed working together.  No other explanation for this distortion is plausible other than NYMEX regulators like the Commodities Futures Trading Corp. [CFTC – Plunge Protection Team members] are more brazen and actively complicit in market rigging of strategic commodities than their London counterparts. This manipulation is all being done in desperation; to preserve U.S. Dollar hegemony by perpetuating the illusion that inflation is being held at bay.  Ample anecdotal evidence exists in a host of articles – particularly relating to derelict CFTC oversight of COMEX gold and silver futures – archived at kirbyanalytics.com to support this position.


Spiking VLCC Rates Reflect “The Movement to Tangibles”


The “unusual” premium for Brent Crude is even more perplexing given that crude oil shipping rates [unlike their dry goods shipping counterparts, as depicted by the Baltic Dry Index] for VLCCs [very large crude carriers] have, as recently as Dec. 2008, been enjoying robust and improving charter rates,


Last week the spot rate for Suezmax tankers was in the low $40k per day range. Yesterday, I check the rates and they have popped to over $90k this week! VLCC (very large crude carriers, i.e. supertankers) rates have not jumped as much but appear to be following the trend. So what is the deal here? Oil prices are falling and so is the apparent global demand for oil. Are not oil tankers just sitting around idle like the dry bulk carriers?
The answer is somewhat counter intuitive. The spike in spot tanker rates is actually the result of the low oil prices. Many tankers are being leased on the spot market as storage tanks. Oil producers, for whatever reason, do not want to significantly slow their oil production, but at the same time do not want to sell it for $45 a barrel. So they are leasing tankers to store oil in the hope or belief that oil prices will recover shortly. Two names in news articles that I have read doing this are Royal Dutch Shell and Iran. The majority of the planet’s oil production is owned by national oil companies that have policy and employment as well as financial reasons to keep the oil flowing. So at least in the short term, the current low oil prices are a boon for tanker owners.


Oil tanker companies, like their dry cargo brethren, can sign their ships to either long term, multi-year leases or charter them on the spot market where they are leased for a single voyage at the current spot rate.


The fact that “smart money” is now paying elevated prices to lease very large crude carriers [to store physical crude for later sale] is further evidence that faith in fiat money is waning simply because – you can do the same “trade” on paper – utilizing futures – without the bother and nuisance of leasing ships and handling the physical.  Ask yourself why smart money has recently become engaged in buying ‘relatively illiquid’ physical crude oil, in a world allegedly awash in the stuff, for resale at a later date – instead of playing futures, accepting promises and holding cash?


Smart money is in the process of losing confidence in cash.


Interest Rates


It is vital that everyone understand that the function of interest rates in a system of usury is to solemnly act as the efficient arbiter of capital – rising to restrict money / credit growth when the economy overheats and falling to create the opposite when the economy cools.


Interest rates no longer serve this function.


As deceitfully disastrous as the surreptitious interventions in the crude oil and gold markets has been – they pale in comparison to the travesty which has been perpetrated through the premeditated hobbling of usury. 


The roots of this most wicked experiment are traceable to the appointment of Alan Greenspan as Chairman of the Federal Reserve and then to academia – Harvard – where Robert Barsky and Lawrence Summers co-authored an academic research paper in the 1980s titled, Gibson’s Paradox and the Gold Standard.  The “elevator speech” of what the paper examined was the co-relation between bond prices, inflation and the price of gold and, by extension, theorized that interest rates could be driven down [or kept low] – without sacrificing the currency – in the face of and despite profligate monetary policy so long as gold prices declined or did not rise.


After a stint as Chief Economist at the World Bank, Mr. Summers brought this “theory” to Washington mid-way through the first Clinton Administration [late1993] as Under Secretary of Treasury to Robert Rubin where he began laying the groundwork – with co-conspirators Greenspan, Rubin and Clinton – for the implementation of his “theoretical research”:


Gold price suppression began in earnest concurrently with changes in how the Office of the Comptroller of the Currency [OCC] begins records the mushrooming growth of derivatives [mostly interest rate swaps which – absent end user demand – only create artificial demand for government bonds]:


The Federal Reserve acting in cahoots with the U.S. Treasury utilizing the futures pits in N.Y. [COMEX] and the obscenity that has become J.P. Morgan’s Derivatives Book – the Fed / Treasury combo seized control of both the gold price and interest rates.  The mechanics of how interest rate swaps were utilized to suppress interest rates is chronicled and explained in detail at Kirbyanalytics.com in a paper titled, The Elephant in the Room.


Subscribers are reading about the logical implications, and what comes next, as a result of the market manipulations outlined above as well as actionable suggestions to help insulate your investment portfolio from the inevitable fallout.

====================================================

Gata’s Tenth Anniversary: Gold Manipulation Evidence Mounts-Gold Seek.Com

By: Bill Murphy of LeMetropole Cafe 

“Faced with the choice between changing one’s mind and proving that there is no need to do so, almost everyone gets busy on the proof.” … John Kenneth Galbraith

“An error does not become truth by reason of multiplied propagation, nor does truth become error because nobody sees it.” … Mahatma Gandhi


GO 


GATA!


This week marks GATA’s tenth anniversary of our efforts to expose the manipulation of the gold market. In another few weeks we will mark the tenth anniversary of my appearance on CNBC (interviewed by Ron Insana) … the first and last GATA appearance on the US TV media to date … for once they heard what GATA had to say, we have been blackballed ever since. It also marks a shameful period for the US financial market press, which is now clamoring for answers as to how we ever got in the financial market/banking mess we are presently facing. For that answer they ought to first look at themselves and their dismal way of kowtowing to the rich and powerful, and banning those who are willing to challenge the Orwellian grip on what Americans are allowed to hear and know.

America is facing quite a dichotomy at the moment. We are on the Inaugural Eve of our first black President, with all the hopes and dreams he is envisioning for our country. At the same time we are enduring the most horrific financial crisis since the Great Depression.

President-elect Obama, a superb orator, is calling for Americans to pull together to effect the CHANGE he called for in his campaign, and for all of us to contribute individually to make that change happen. He has wisely warned of the tough times ahead while going all-out to ready policies ASAP which he believes are the correct way to remedy the growing economic problems of the day.

He has also assembled an economic team of advisors which are acclaimed and generally very highly regarded … including Robert Rubin, Lawrence Summers, Timothy Geithner and Paul Volker. Unfortunately for the GATA camp, they are the ALL-PROS of the gold price suppression scheme. It is almost like our worst nightmare. On paper it represents anything but change as far as US gold policy is concerned, and has the potential to make our investment lives miserable for years to come. After all…

*Robert Rubin coined the phrase “US Strong Dollar Policy,” and flaunted the phrase. Rigging the price of gold was that policy’s lynchpin. What else was there? Steve Forbes was on Fox News Saturday talking about how important he believes it is for America to MAKE the dollar strong again. He talked sheepishly about gold in vague terms and referred to Rubin.

Robert Rubin hatched the gold price suppression scheme while running Goldman Sachs’ operations in London. This was many years ago, when interest rates were very high (say from 6 to 12% in the US). Rubin had Goldman Sachs borrowed gold from the central banks at about a 1% interest rate. Then he sold the gold into the physical market, using the proceeds to fund their basic operations. This was like FREE money, as long as the price of gold did not rise to any sustained degree for any length of time.

He continued his innovative money ploy as CEO of Goldman Sachs in New York and then put his Strong Dollar Policy ploy on steroids as Treasury Secretary under President Clinton.*Lawrence Summers followed Rubin as Clinton’s Treasury Secretary, and who could be more qualified to continue Rubin’s gold price suppression scheme than him? After all, while at Harvard he co-authored a paper, “Gibson’s Paradox and The Gold Standard.” The bottom line of Summers’ analysis is that “gold prices in a free market should move inversely to real interest rates.” Control gold and it will help to control interest rates.

Obama has designated Mr. Summers to be the Director of the U.S. National Economic Council.

*Which brings us to Timothy Geithner, who is President-elect Obama’s nominee to be U. S. Treasury Secretary. Geithner was named president and chief executive officer of the Federal Reserve Bank of New York on November 17, 2003. In that capacity, he serves as the Vice Chairman and a permanent member of the Federal Open Market Committee, the group responsible for formulating the nation’s monetary policy.

Mr. Geithner joined the Department of Treasury in 1988 and worked in three administrations for five Secretaries of the Treasury in a variety of positions. He served as Under Secretary of the Treasury for International Affairs from 1999 to 2001 under Secretaries Robert Rubin and Lawrence Summers.

Geithner is also happens to be a member of the Bank for International Settlements and since 2005 has been Chairman of the Committee on Payment and Settlement Systems. You might want to see what The CPSS undertakes “at their own discretion” as listed here:

http://www.bis.org/cpss/index.htmLike outgoing Treasury Secretary Hank Paulson, Tim Geithner is a graduate of Dartmouth College. Talk about knowledge of the gold price suppression scheme!

*And then there is the venerable Paul Volcker, who so effectively brought down runaway inflation in the US, starting in 1980. His one regret:

“Joint intervention in gold sales to prevent a steep rise in the price of gold (in the 1970s), however, was not undertaken. That was a mistake.” … Former Federal Reserve Chairman Paul Volcker (writing in his memoirs).

All-Pros? All-World is more like it when it comes to devotees of suppressing the price of gold. Outside of Volcker, the other three are those most responsible for making it happen in the first place.

So what’s the point? To get us all depressed over what lies ahead? NO, just the opposite.

On December 18th, on GATA’s behalf, I met with Bart Chilton, a CFTC commissioner who showed interest in hearing what we had to say. There were three others from the CFTC in attendance, including Elizabeth L. Ritter, Deputy General Counsel of that organization.

From my MIDAS commentary later in that afternoon…

Bart listened intently and took notes, as did one of the others, and asked numerous questions. Basically, I laid out our GATA presentation as I explained in the Sunday Midas. I am not going to get into all the details of what they said, as we will see what takes place in the months to come … except to say that I chuckled when saying to them if they really wanted to comprehend what the real gold price suppression scheme is all about, all they have to do is go to their new proposed Chairman … at the right time. No one knows what is going on better than he does.

(Insert- Gary Gensler was nominated that day to be the new chairman of the CFTC. Gensler was Undersecretary of the Treasury (1999-2001) and Assistant Secretary of the Treasury (1997-1999).

Gensler spent 18 years at Goldman Sachs, one of the ringleaders of The Gold Cartel, making partner when he was 30, becoming head of the company’s fixed income and currency operations in Tokyo by the mid-90’s.

As the Treasury Department’s undersecretary for domestic finance in the last two years of the Clinton administration, Gensler found himself in the position of overseeing policies in the areas of U.S. financial markets, debt management, financial services, and community development. Gensler advocated the passage of the Commodity Futures Modernization Act of 2000, which exempted credit default swaps and other derivatives from regulation.

Could The Gold Cartel have recruited a better ALL-PRO/ALL-WORLD man for their team? It is also important to keep in mind that chairman of the CFTC is one of the four members of the President’s Working Group on Financial Markets. Now why does a bureaucrat need to participate with the President and US Treasury Secretary on the markets? I thought the CFTC was supposed to regulate them, not be a part of policy.)

I did not hold back and said the main culprit of The Gold Cartel was our own government (their own boss), who has been in league with bullion banks like JP Morgan Chase, and others, to suit their own hidden agenda….

I was very impressed with Bart Chilton (very sharp guy) and he mentioned that my trip to D.C. would not be in vain.

***

What I stressed most at the meeting was that the gold price suppression scheme would not survive another four years, over the length of Obama’s elected term … and presented lengthy documentation to prove my point … meaning The Gold Cartel would run out of enough available central bank gold to meet a growing annual supply/demand deficit over the next four years. The bottom line was that Obama could stop the gold price manipulation scheme now and allow the price of gold to trade freely, thereby letting the Bush Administration be the fall guy; or he could let his economic team persuade him to carry on the status quo, in which case the price of gold will blow sky high in the years ahead, and he would have to take the blame for the resulting ramifications … especially when the gold scandal becomes a huge public ordeal.

What better way for Obama himself to understand the true gold situation than to ask his top economic advisors what the real deal is. If GATA is correct, and we have been on target for years, the U.S. has a BIG problem when it comes to its gold reserves (how much of it has been encumbered and is therefore GONE?) That is an essay unto itself, with many variables to be discussed, and for another time. All Obama has to do is get the five above-mentioned gentlemen in a room and get right to the nitty-gritty. They can start with the extensive package I handed to Bart Chilton, who is a member of the Obama transition team, and someone who once worked for Tom Daschle, formerly the Democratic leader in the Senate for ten years, and is now Obama’s Secretary of Health and Human Services nominee.

What Bart Chilton does with what I gave to him is his business, but since he told me my visit would not be in vain, I assume GATA’s extensive presentation did not go into the dumpster.

Meanwhile, in GATA’s tenth anniversary year, we are making our own call for CHANGE, and are pressing on. Obama has stated over and over again he wants THE PEOPLE to be represented and asked us to give him input. Who has more pertinent input go get to him than our camp? Therefore, we are asking everyone interested in a free gold market to make a renewed effort to further disseminate our decade’s worth of evidence of gold market manipulation into the public domain by contacting the financial market media and to others in the Obama transition team (if you have any contacts).

I know how frustrating it has been to get the jaded financial market media to listen to, and then acknowledge, what we have to say, but that was yesterday and perhaps times have changed due to the growing financial market crisis, and yearning to understand how we got here. After all President-elect Obama is urging for “government accountability” and “transparency.”

This call to arms has been instigated by the dramatic and sudden discovery of an important document buried in the Federal Reserve’s archives by writer and researcher Elaine Supkis. This document is posted on her blog at:

http://emsnews2.wordpress.com/2009/01/15/1961-top-
secret-fed-reserve-gold-exchange-report/

The document, which is marked “Confidential,” is from the papers of William McChesney Martin, Jr., and this collection is held by the Missouri Historical Society. A scanned image of the original document is posted by the Federal Reserve Bank of St. Louis at the following link:

http://fraser.stlouisfed.org/docs/histor ical/martin/23_06_19610405.pdf

Most importantly, GATA consultant James Turk has brilliantly dissected this document in an essay titled, “The Federal Reserve’s Blueprint for Market Intervention,” which has been served at The Matisse Table and at www.GATA.org…

http://www.gata.org/node/7095The title of this confidential report is:

Confidential – – (F.R.)
U.S. Foreign Exchange Operations: Needs and Methods


James Turk notes:

In short, it lays out what the Treasury and Federal Reserve needed to do in order to begin intervening in the foreign exchange markets, but there is even more. This document plainly shows what happens when government operates behind closed doors. It also makes clear the motivations of the operators of dollar policy long described by the Gold Anti-Trust Action Committee and its supporters — namely, that the government would pursue intervention rather than a policy of free markets unfettered by government activity. The run to redeem dollars for gold had put the government at a crossroads, forcing it to make a decision about the future course of dollar policy. This paper describes what the government would need to do by choosing the interventionist alternative.

This document provides primary, original source supporting evidence that GATA has been right all along.

I have long hoped that a “confidential” document like this one would eventually emerge. There are no doubt countless more like it, as evidenced by the Federal Reserve’s and the Treasury’s refusal to provide all the documents requested by GATA under its recent Freedom of Information Act request. Maybe those documents will eventually see the light of day too.

***

James makes a key point regarding one of the assertions of this report…

“The basic purpose of such operations would be to maintain confidence in the dollar.”


James T notes…

“This statement confirms one of the basic planks of much of the work by me and others that has been published by GATA over the years. The efforts to cap the gold price have one aim. It is to make the dollar look worthy of being the world’s reserve currency when in fact it is not.”

***

This significant report was written some 48 years ago, yet could have been written at any time in the past 10 years during which GATA has discovered blatant manipulation of the prices of gold and silver … as well as noted ludicrous counterintuitive dollar market action, which has been most noticeable in recent days, as our hysterical financial crisis in the US intensifies.

James Turk’s title says it all: it is a blueprint for the gold price and financial market manipulation so prevalent now. Ironically, there is a common misconception out there that the US is in the financial market mess it is in today because of too much deregulation. To some extent that is very true, as the likes of Secretary Paulson and Gary Gensler urged Congress to allow the US investment banks to increase the allowable debt/credit on their books from 12:1 to 40:1.

Yet, just as big a problem was the secretive interference in the US financial markets which allowed credit and risk issues to go completely out of control in America … meaning too much secretive market manipulation … and in a hidden way, too much regulation. Had the gold market not been artificially suppressed and allowed to trade freely, the price would have soared these past years, interest rates would have risen dramatically, and there would have not been the reckless investment bank shenanigans that have put our financial system in such peril. Simplistically, it is generally acknowledged that if gold had been allowed to keep up with inflation for the past 28 years, the price would be over $2,000+ per ounce. The GATA camp knows why it is not there RIGHT NOW!

Had the Plunge Protection Team (Working Group on Financial Markets) not stepped up their constant Hail Mary play activity after 9/11 to drive the DOW mysteriously higher in the last hour of trading on the New York Stock Exchange, the market probably would have broken down much earlier than it did and given the investing public more of a clue that something was wrong, instead of the misleading Stepford Wives drill that “Everything is fine.”

What is profoundly disturbing about the discovery of this confidential document is it fits in with much grander conspiracy theories than where GATA is coming from. Since this document, based on what has happened, really is a blueprint for market manipulation since 1961, it feeds into the worst fears of those who are constantly on the case about the Bilderbergers, Council on Foreign Relations, Trilateral Commission, and so on. This document to William McChesney Martin, Jr. is EXACTLY what I have been seeing and reporting over the past decade … not that much different than those who pointed out the Madoff Ponzi scheme during the same period of time. To learn that this market deception and manipulation was conceived when I was a freshman in high school is almost beyond comprehension, especially since the Wall Street crowd hasn’t permitted a serious discussion about it ALL THIS TIME! Nor has our government allowed a true independent audit of US gold reserves since the Eisenhower Administration in 1955.

It also feeds right into the scary notion revealed in a famed President Clinton comment that goes something like … “I didn’t realize I wouldn’t be in control here when I became President.” … meaning there were far more powerful background forces pulling the strings and on how he must operate.

GATA doesn’t want to go there, but based on this new discovery, it certainly opens up further comments for fair game, even for some of GATA’s Board of Directors. Adrian Douglas (an oil industry consultant who is presently off to Angola) sent the following email to James Turk:

James,
Congratulations. This was an excellent analysis. What a stunning document! Real dynamite.

It got me thinking as to whether the heist they have pulled is bigger than we think. The BIS as we know, and as mentioned in this memo, is the organization that allows for cooperation behind the scenes of the Central banks. We know they went private to prevent any need for public disclosure seeding the opportunity for Reg Howe’s lawsuit. We have plenty of evidence that Central Bank gold holdings have been depleted. We keep saying that the gold is “gone”. But what do we mean by “the gold is gone”? Gold is not like crude oil, expensive wine, even silver… it does not get consumed. It has not “gone”; it has changed ownership. The Central Banks leased out gold to the bullion banks. Now who did the the bullion banks sell the gold to? We know that the bullion banks can’t get the gold back. If the central banks ask for the gold back the bullion banks can declare bankruptcy or settle in cash. How convenient! The Central bank gold has gone into someone else’s hands that are unknown and the loss will eventually be written off. We know that Central Banks are owned or controlled by some of the richest families and/or entities in the world. Is it possible that these “bankers” can benefit from a fiat Ponzi scheme while it can be maintained AND still end up with the gold in which case they can benefit from a return to a gold standard and when the gold standard eventually gets abused and abandoned in the future they will play the whole fiat game over again? It would certainly require cooperation between central banks to pull off such a heist.

It would be great to have the whole world sitting in a room and ask those who own more than 10 million ozs of gold to raise their hands!

The crime may be more than manipulating the price of gold to “defend the US dollar” and concealing the evidence from the public. The Cartel may well have aided and abetted embezzlement of the citizens’ gold of the Western world. And who ever has it, they bought it perfectly legally from the bullion banks with fiat currency.

This seems to make sense because Central bankers and the “elitists” (Rockefellers, Rothchilds, Morgans, Mellons, Carnegies, Vanderbilts etc etc) are not stupid. They must know gold is real money. They can study monetary history too. The fiat money game in this context is a decoy for the theft of sovereign gold.

It is not without precedent, the great inflationist, John Law, was arrested escaping with a coach loaded with gold and silver!

Is this a bridge too far in conspiracy theory?
Cheers
Adrian

Which provoked this reply from another GATA Board member, Catherine Austin Fitts (Assistant Secretary of Housing/Federal Housing Commissioner at the United States Department of Housing and Urban Development in the first Bush Administration)…

Adrian:
My hypothesis since 2001 is that the NWO is shifting assets out of sovereign governments and shifting liabilities back in. The goal is to reengineer global governance into the hands of private banks and corporations in a manner that dramatically centralizes control. This is why the creation of a genetically controlled seed and food supply, etc.
To achieve such centralization requires the centralization of the gold and silver stores. Whoever has the gold has the most powerful financial asset. So if you want a new centralized currency, you need a monopoly on gold and silver. I think part of the end game is to shift back to something involving some kind of gold standard.


If you use fiat currency to acquire ownership and control of all the real assets on the planet, then you need a gold standard to make sure you keep them.


So, it would not surprise me to see G8 and GATA start to move into alignment, strange as it may sound.
Catherine


Neither opinions are official GATA viewpoints, but they are intriguing, eye-opening and worth pondering.

When I met with Bart Chilton I said GATA’s high command is just a bunch of proud Americans who have stumbled across a profoundly disturbing situation. I showed the four CFTC individuals in attendance GATA’s full-page color ad in the Wall Street Journal on January 31, 2008. It was titled, “Anybody Seen Our Gold?” …

http://www.gata.org/node/wallstreetjournalSome of you are very familiar with this copy in the ad…

“The objective of this manipulation is to conceal the mismanagement of the US dollar so that it might retain its function as the world’s reserve currency. But to suppress the price of gold is to disable the barometer of the international financial system so that all markets may be more easily manipulated. This manipulation has been a primary cause of the catastrophic excesses in the markets that now threaten the whole world.”

… and then…

“Surreptitious market manipulation by government is leading the world to disaster.”

The DOW was a little below 13,000 at the time. I mean how right could we have been? Yet the US financial market press completely ignored this very visible ad. There was not even a query of what we were talking about and why we would spend $264,400 to make such a warning.

So now we are fast forwarding virtually a year later and the US financial markets and economy ARE in chaos. If soon to be President Obama really wants CHANGE and TRUTH, we will give him critical input on one way he can effect what he says he is looking to do.

To increase the likelihood that what GATA has discovered actually reaches him, GATA is asking all who read this, and agree with GATA, to make some small effort to get this commentary to the financial market media in the world, especially the US financial market press.

That means contacting writers and media outlets such as the Wall Street Journal, Washington Post, Washington Times, New York Times, Forbes, Fortune, CNBC, CNN, Reuters, Bloomberg, the AP, Fox News, Newsweek, Time, etc. In addition, sending this Tenth Anniversary GATA commentary to widely-followed internet bloggers would also be helpful; perhaps stirring up so many out there who are searching for the reasons behind what has happened financially and economically in the US and why.

In such troubling times, Obama’s coming Presidency has given optimism and hope to many. For that to occur there must be true change, the desires for which have swept him into office. President-elect had some army. And GATA has its army.

Please take a little time and make just a small effort to help Obama help himself, even if our issue is the last one he is thinking about at the moment. Funnily enough, it ought to be one of the first, as it is one of the most prominent ones which got us into the financial market/economic nightmare we are in today. After all, it is many of the same bullion banks/investment houses our government is bailing out that were so instrumental in the gold price suppression scheme. Our mission is to let him know, via all sources possible, what the heck has happened and continues to go on.

Bill Murphy
Chairman
Gold Anti-Trust Action Committee

Copyright (c) 1999 – 2009

Le Metropole Cafe, Inc

================================================

John Doody: A Winning Situation For Gold Stocks- Seeking Alpha

Source: The Gold Report

By: John Doody of The Gold Stock Analyst

Heralded as “the best of today’s best,” John Doody, author and publisher of the highly regarded Gold Stock Analyst newsletter, brings a unique perspective to gold stock analysis. In this exclusive interview with The Gold Report, Doody ponders the efficacy of the Keynesian approach, makes a case for gold equities and explains how the GSA Top 10 Stocks portfolio has outperformed every other gold investment vehicle since 1994.

The Gold Report: John, you’ve stated in your newsletter, Gold Stock Analyst: “It’s clear the U.S. is going down a Keynesian approach to get out of this recession/depression.” I am curious on your viewpoint. Will the Keynesian approach actually work, or will they need to eventually move over to the Chicago School of Free Markets?

John Doody: A free market approach of letting the crisis resolve itself would work, but would cause too much damage; we’d probably lose our auto industry, and it would take too much time. As Keynes said: “In the long run we’re all dead,” so the government is trying to get a faster resolution. The Treasury is pursuing his fiscal policy idea of deficit spending. They’re borrowing the money to bail out the banks. When Obama’s plan is implemented, which could be another $700 billion in stimulus, it will be funded with more borrowings.

Bernanke and the Fed are pursuing a loose monetary policy with a now 0% interest rate. There’s actually no way we can not end up with inflation. This is much bigger than ‘The New Deal’ under Roosevelt. And I think that the market disarray over the last several months has confused investors; but when the markets settle down, it’s clear to me that it will be up for gold and gold stocks.

TGR: Is there any economic scenario that you wouldn’t see gold going up in?

JD: Basically, we’re pumping money into the system, but it’s just sitting there. It’s not being put to work, so there are those who think that we are going to enter a deflationary era. But I can’t see that. Some don’t like Bernanke, but I think there’s probably nobody better prepared to be in his role.

Bernanke is a student of the Great Depression and knows the mistakes the Fed made then, such as forcing banks to upgrade the quality of loans on their balance sheets. His approach is to buy the banks’ low quality loans, enabling them to make new loans. They haven’t done much of the latter yet, which is probably a fault of the Fed not requiring the funds received for the junk to be redeployed, but they ultimately will lend more as that’s how banks make money.

He knows in the early 1930s we went into a deflationary period of falling prices. For three or four years prices were down about 10% annually. He fully understands the risks of that, one of which is the increased burden of existing debt payments on falling incomes. The debt burden is lighter in an inflationary environment and that’s his target. Long term, he knows he can cure inflation; Volker showed us how with high interest rates in the 1980s. But there’s no sure way to cure deflation, and so Bernanke’s doing everything possible to avoid a falling price level. And I think that, because this is a service-driven economy, companies won’t lower prices to sell more goods—they will just lay off more workers, as we’re seeing now. I don’t think we’ll get the price deflation of the ’30s, and I’m sure Bernanke is going to do everything to prevent it.

TGR: But aren’t we already in a deflationary period?

JD: Well, we may be to an extent; you can get a better buy on a car. But, to put it in the simplest terms, has your yard guy lowered his price, or your pool guy, or even your webmaster?

TGR: Yes, but people opt to do things themselves versus paying other people to do it.

JD: Maybe, but if they do, it won’t show up in prices—it will show up in the unemployment statistics. So if the yard guy, pool guy or webmaster don’t lower prices and their clients become do-it-yourselfers, the effect will show up in unemployment, not inflation data.

TGR: So if every major country in the world is increasing their monetary supply, we would expect inflation. Will there be any currency that comes out of this to be considered the new base currency, sort of like the U.S. dollar is now?

JD: Well, that’s the $64,000 question. We don’t really know and, because there’s no totally obvious currency, that is why the dollar is doing well of late. But the dollar is in a long-term downtrend, in part because interest rates in Europe remain higher than here. Higher interest rates, as you know, act like a magnet in attracting investment money, which first has to be converted to the higher interest currency and that bids up its value versus the dollar.

The Euro represents an economy about the size of the U.S., so there may be some safety there. You could argue for the Swiss Franc maybe, but you know the Swiss banks (Credit Suisse, for example) have had some problems, so we’re not quite sure how that’s going.

So, to me, the only clear money that’s going to survive all this and go up, because everything else is going to go down, is gold.

TGR: What’s your view of holding physical gold versus gold equities?

JD: I only hold gold equities. They’re more readily tradable; when gold goes up, the equities tend to go up by a factor of two or three times. Of course, that works to the reverse, as we know. As gold went down, the equities went down more. But because you hold them in a government-guaranteed SIPC account, it provides ease of trading—you don’t have the worries of physical gold. . .insurance, storage or whatever. You may want to hold a few coins, but that would be about it in my opinion.

TGR: On your website, your approach to investing in gold equities is to choose a portfolio of 10 companies that have the opportunity to double in an 18- to 24-month period with the current gold price.

JD: Yes. We don’t really look forward more than 18 or 24 months; but within that timeframe, say a year from now, we could reassess and raise our targets so that, in the following 18 to 24 months, the stocks, while having gone up, could go up more still. There are lots of opportunities to stay in the same stocks as long as they continue to perform well. We’re not a trading newsletter, and as you probably know, the way we define an undervalued stock is based on two metrics.

One is market cap per ounce. The market capitalization of a company is the number of shares times its price. You divide that by its ounces of production and its ounces of proven and probable reserves, and you see how the company’s data compares to the industry’s weighted averages.

Second, we look at operating cash flow multiples. Take the difference between the gold price and the cash cost to produce an ounce, multiply that by the company’s production per year, and you get operating cash flow. Divide that into its market capitalization and you get its operating cash flow multiple. We look at that this much the same as one looks at earnings per share multiples in other industries.

For reference, we last calculated the industry averages on December 29, 2008 for the 50+ gold miners we follow, which is everyone of significance. At that time, the average market cap for an ounce of production was $3,634, an ounce of proven and probable reserves was $194, and the average operating cash flow multiple on forecast 2009 production, assuming $900/oz gold, was 7.4X.

We focus companies that are below the averages and try to figure out why. An ounce of gold is an ounce of gold, it doesn’t matter who mined it. If you’re going to buy an ounce of gold from a coin dealer, you want to get the cheapest price. Well, if you’re going to buy an ounce of gold in the stock market, you should want to get those at the cheapest price, too. It’s oversimplified, as there are other factors to be considered, but this is a primary screening tool to determine which stocks merit further study. The method works, as the GSA Top 10 Stocks portfolio has outperformed every other gold investment vehicle since we began in 1994.

TGR: Are all the companies in your coverage producers or have 43-101’s??

JD: Yes, all are producing or near-producing. They may be in the money-raising stage to build a mine, but they’ve got an independently determined reserve. And that part of the market has done better than the explorers because it has more data to underpin the stocks’ prices.

TGR: And you focus in on having 10 just because, as you point out in your materials, it allows you to maximum upside at minimum risk (i.e., if one of the 10 goes down 50%, you will only lose 5% of your money). Is your portfolio always at 10 or does it ever expand more than that?

JD: No, earlier in 2008 we were 40% cash, so it was six stocks. For a couple of months later in 2008 it was 11 stocks. But 90% of the time it’s at 10.

TGR: What prompted you to be 40% in cash?

JD: That was when Bear Stearns was rescued in March and gold went to $1000; we were just uncomfortable with that whole scenario. And actually we put the 40% in the gold ETF; so it wasn’t true cash.

TGR: Okay. And as you’re looking at these undervalued companies, are you finding that there are certain qualifications? Are they typically in a certain area, certain size?

JD: While we follow Barrick Gold Corporation (NYSE:ABX) and Newmont Mining Corp. (NYSE:NEM) and they’ve both been Top 10 in the past, neither is now. We’re currently looking further down the food chain. There’s one with over two million ounces growing to four million a year. Another has a million growing to two million. So, some are still pretty good sized. And then there are others further down that are either developing mines or are very cheap on a market cap per ounce basis.

Earlier, one of the Top 10 was selling at its “cash in the bank” price. We’ve had a nice little rally since October and this stock has doubled, but it’s still cheap. It has 9 million ounces of reserves at three mine sites in European Community nations, and it’s not Gabriel in Romania. It has no major troubles with permitting its mines and it was selling at its cash/share. Then the chairman of the board bought 5 million more shares. It was already top 10, but I pointed this out to subscribers as great buy signal. It’s doubled since and will double again, in our opinion.

TGR: Can you share with us some of the ones that are in your top 10?

JD: Well, the astute investor would probably recognize Goldcorp (NYSE:GG) as the one at two million ounces growing to four million ounces. Their tremendous new mine in Mexico, Penasquito, which I have been to and written about, is going to average half a million ounces of gold and 30 million ounces of silver a year. It’s going to be the biggest producing silver mine in the world, momentarily anyway, and will produce huge quantities of lead and zinc. At current prices, it’s going to be a billion-dollar-a-year revenues mine, which is enormous. And because of by-products, and even at current prices, the 500,000 ounces of gold per year will be produced at a negative cash cost per ounce.

TGR: Wow. Because of the credits?

JD: Because of the by-product credits. Another one would be Yamana Gold Inc. (NYSE:AUY), which is growing from a million ounces to two million ounces. Both Yamana and Goldcorp are in politically safe areas—no Bolivia, no Ecuador, no Romania—none of the places where you have to take political risk. I think we’ve learned enough from the Crystallex International Corp. (KRY) and Gold Reserve Inc. (NYSE:GRZ) situation in Venezuela, where they’re both on portions of the same huge deposit that is probably 25 million ounces or more. It looks to me that the government is going to take it away from them. So, I would just as soon not be involved in that kind of political risk scenario. There’s enough risk in gold just from the mining aspects of it that you don’t have to take chances on the politics too, as in some nations that’s impossible to assess.

TGR: Yes, another one that is really doing quite well is Royal Gold Inc. (Nasdaq:RGLD). Can you speak about that company?

JD: Yes. Royal Gold has been GSA Top 10 for 18 months now. We put it on in part because of the Penasquito deposit that I mentioned earlier. Royal has a 2% royalty on that, and 2% of a billion dollars is $20 million a year. Royal is unique in that they haven’t prostituted themselves by selling shares on a continuous basis. They only have 34 million shares outstanding and they will have royalty income this year of about $100 million. Penasquito is just coming on line, so its $20 million per year won’t be fully seen until late 2010.

Plus Royal pays a dividend. I think it could pay $1.00/share ($0.32 now). Dividend-paying gold stocks typically trade at a 1% yield. A $1.00/share dividend would make Royal a potential $100 stock. That’s my crystal ball down-the-road target.

Royal is a great play on gold price because they don’t have the aggravation of mining. They have a portfolio of mine royalties, plus a small corporate office. Royal employs 16 people, has $150 million in the bank and over $100 million a year income, which is about $3.00 per share pre-tax. Their biggest cost is taxes.

TGR: I see also that Franco Nevada Corp. (FNV.TO) has had quite a rise, though they have been kind of tumultuous between November and December.

JD: Franco is also a stock we like. About half of its royalties are from oil, so that’s why it’s suffered. The original Franco Nevada, as you know, was merged into Newmont for five years, and then they came public again in December ’07. I think it’s a good way to play gold and oil, and I think everybody agrees that oil is not going to stay in the $40 range for long.

TGR: John, can you give us a few more?

JD: A couple of smaller ones we like are Northgate Minerals Corp. (AMEX:NXG) and Golden Star Resources Ltd. [TSX:GSC]. Northgate is a misunderstood producer. Everybody thinks it’s going out of business when the Kemess Mine closes after 2011, but it’s actually not. It has 200,000 ounces a year from two mines in Australia and has a potential new mine in Ontario where they’ve just announced a 43-101 with over three million ounces. That’s potentially another 200,000 ounces a year, so we think they’ll remain at 400,000 ounces a year from Canada and Australia, both of which are countries we like. Cheap on our market cap per ounce of production and reserves metrics, it’s trading at an operating cash flow multiple under 2.0X.

Golden Star has several nearby mines in Ghana with production targeted at about 500,000 ounces in 2009. They’ve been ramping up to this rate for the past year and cash costs have run much higher than plan. If costs can be controlled and production goals met, it’s a takeover candidate for someone already in the country, such as Newmont or Gold Fields Ltd. (NYSE:GFI).

One thing I think readers should bear in mind is that gold mining will be one of the few industries doing well in 2009. Their key cost is oil, which is about 25% of the cost of running a mine. Oil’s price, as we know, is down about 75% in the $147/barrel high last July. At the average $400 cash cost per ounce mine, that’s a cut of about $75/oz off their costs. That result alone is going to give them an uptick in future earnings versus what they showed for third quarter 2008.

Something else people may not recognize is that currencies are also falling; many are down 20% to 40% versus the U.S. dollar. All the commodity nation currencies—the Canadian dollar, the Australian dollar, the South African Rand, the Brazilian Real, the Mexican Peso—they’re all down 20% to 40%. When your mining costs in those countries are translated back into U.S. dollars, they’ll be 20% to 40% lower.

So, the miners are going to have falling cash costs and even if the gold price remains exactly where it is now profits are going to soar. This will be unique in 2009. I can’t think of any other industry in which people are going to be able to point to and say, “These guys are making a lot more money.” I think the increasing profits will get the gold mining industry recognition that it isn’t getting now. Of course I’m a bull on gold because of the macroeconomic picture. When you put falling costs of production together with a rising gold price, you’ve got a winning combination for the stocks in 2009.

TGR: I was wondering if you could give us something on Silver Wheaton Corp. (NYSE:SLW).

JD: Well, Silver Wheaton is another royalty company; it’s not a producer. It gets its profit royalties by paying a cash sum up front and $4/ounce on an ongoing basis. It captures the difference between the silver price and $4 an ounce; if silver is $10 and it pays $4, it makes a $6 an ounce profit; at $20 silver, its profit would be $16. Aside from no pure silver miner actually producing ounces as low as $4.00, there’s a lot of leverage to silver price. I am not a silver bull, but because I’m a gold bull I think silver will follow gold higher.

Silver Wheaton is one of those companies that doesn’t have the issues of actually doing the mining. It has a portfolio of mines that it gets production from, and it owns 25% of the production from Goldcorp’s Penasquito mine that it buys at $4 an ounce, and will average about 8 million ounces a year. It’s just starting up now, but it will really get going in 2010. Silver Wheaton’s share of the total mineralization at Penasquito is 1 billion ounces. There’s 4 billion total ounces of silver there and it bought 25%. So, for a long time—the mine life of Penasquito is over 30 years—it’s going to be a big producing mine for Silver Wheaton.

TGR: Isn’t there a twin sister to Silver Wheaton in the gold area?

JD: Well, there’s Gold Wheaton Gold Corp. [TSX.V:GLW]. It’s based on the premise that some companies have a gold by-product. With their primary production in some other kind of metal, some might like to lay off the gold for a $400 an ounce on-going payment and an up-front purchase amount. Yes, some of the same guys are involved. I’m not convinced it’s going to do as well because it’s already got a lot of shares outstanding, and I just don’t like the capital structure as much. I wouldn’t bet against these guys but I’m not a believer.

TGR: And you said you’re not a silver bull. Why is that?

JD: We do cover about 15 silver miners, but reason number one for not being a bull is that it’s a by-product. Few mines are built to get just silver; 70% to 80% of silver comes as a by-product to copper, zinc, gold or some other metal. If you’re producing copper, you’re more interested in the copper price than you are in the silver price and you tend to just dump the silver onto the market.

And second, it’s not a monetary commodity. It is poor man’s gold—but it doesn’t have the universal monetary acceptance that gold does. It has a growing list of industrial uses, but it’s not growing at any rate that’s going to offset the falling use in photography. So, the overall demand for silver is not growing at any great rate. It’s not going to go from 800 million ounces a year to 1.6 billion ounces a year; it may get there in 20 years or 30 years, but that’s not our investment time horizon.

I think silver just follows gold along; but, in fact, it hasn’t been following gold along because right now silver is trading at a discount to gold. The ratio of gold to silver price, which normally runs around 50–55, is now around 80, so silver might have a little bit of a pop-up if the discount closes. But there are a lot of new silver mines coming on line and maybe that’s why the discount exists. Penasquito is one and Silver Standard Resources Inc. (Nasdaq:SSRI) has a big one starting in 2009. Coeur d’Alene Mines Corp. (NYSE:CDE) has now one ramping up and Apex Silver Mines Ltd. (AMEX:SIL) San Cristobal is now on line at 20+ million ounces per year as a zinc by-product. There’s potentially more silver coming to market than the world really needs. We do recommend Silver Wheaton, but that’s our single play.

TGR: Can you give us any comments on Minefinders Corporation (AMEX:MFN)?

JD: Well, you know, it’s in the uncertainty phase as to whether or not the new Delores mine in Mexico is going to work. Now built, it’s just starting up. We like the stock as we think it’s going to work. The question is: will it? Two mines in the area—Mulatos, owned by Alamos Gold Inc. [TSX:AGI], and Ocampo owned by Gammon Gold Inc. (GRS) did not start up smoothly. The market is betting against Delores starting smoothly, but this is the last of the three mines to come on line, and the first two mines—Alamos’ and Gammon’s—did get fixed and are now running okay. So, I think Minefinders has probably learned from the experience of the others, and the mine should start up all right. But, you know, the proof will be in the pudding. If you take its market cap per ounce on the forecast 185,000 ounces of production in 2009, or its almost 5 million ounces of reserves, and compare it to the industry averages we calculate, it’s potentially a double or triple from here.

TGR: So, the start-up issues of the other two mines, were they politically related?

JD: No, it was metal related. Processing facilities aren’t like televisions; you don’t just turn them on. It’s more like buying a new fancy computer system that needs to be twiddled and tweaked and loaded with the right programs. And you know, all geology is different, so things seldom start up properly; and, given the long teething problems at the other two mines, that’s sort of been a curse. If Minefinders can beat it and start up on plan, it’s an easy winner in 2009.

TGR: So, John do you have a prediction on where you think gold will go in ‘09?

JD: People talk about $2,000 or $5,000—it’s all pie in the sky, you know. Gold might get there; but the bigger question is: what’s the timeframe? Will I be around when gold is $5,000? I doubt it. Will it get there? Probably.

But we look for undervalued situations no matter what the gold price. And in the ‘90s—you know we’ve been writing Gold Stock Analyst since 1994—in the mid-90s gold did nothing for three years, it traded between $350 and $400. With our methods of selecting undervalued stocks, we had a couple of years of the Top 10 portfolio up 60% and 70% but gold was flat. Until mid-2008 the GSA Top 10 was up almost 800% in the current gold bull market. When gold does go up, the stocks go up more; but, in general, even if gold does nothing, we can still find good buys. Royal Gold is an example of finding winners in a tough market. Made a Top 10 stock at $23 in mid-2007, it gained 60% in 2008 and has doubled over the past 18 months.

We don’t follow the explorers, in part because there is no data to analyze beyond drill hole results, which are a long way from showing a mine can be built and operated at a profit. For us, the pure explorers are too much like lottery tickets. The producers do exploration and you can get your discovery upside from them. Bema Gold (acquired by Kinross Gold in February 2007) was a Top 10 stock with 100,000 ounces per year of production when it found Cerro Casale and it did very nicely on the back of that find. So, with the smaller producers you can get plenty of exploration upside. You don’t need to focus on the greenfield explorers because it’s just too hard to tell who’s going to win and who’s going to lose.


John Doody brings a unique perspective to gold stock analysis. With a BA in Economics from Columbia and an MBA in Finance from Boston University, where he also did his Ph.D.-Economics course work, Doody has no formal “rock” studies beyond “Introductory Geology” at Columbia University’s School of Mines.

An Economics Professor for almost two decades, Doody became interested in gold due to an innate distrust of politicians. In order to serve those that elected them, politicians always try to get nine slices out of an eight slice pizza. How do they do this? They debase the currency via inflationary economic policies.

Success with his method of finding undervalued gold mining stocks led Doody to leave teaching and start the Gold Stock Analyst newsletter late in 1994. The newsletter covers only producers or near-producers that have an independent feasibility study validating their their reserves are economical to produce.

==============================================

***All Posts are  not  to be considered Investment Advice, the articles/posts are presented for Informational Purposes. Consult Your Own Investment Advisors and Carefully Research and Read the Prospectus’s before making any Investment.*** jschulmannsr

As Always Bringing You The Must Have Information for Today’s Gold Markets and Hard Assets Investing- Dare Something Worthy Today Too!  Brought To You By:- jschulmansr


 There is another option, however, which involves debt holders taking a share of the losses. If steps are not taken to ensure that this happens, the greatest heist in history will have occurred: at least $1 trillion will be transferred from taxpayers to debt holders of failed financial institutions. This must not be allowed to happen.

 Mark-to-Market vs. Real Losses

To understand the government’s dilemma, one must realize that the great majority of the not-yet-recognized losses in our financial system are not short-term, mark-to-market losses that will someday be reversed, but permanent losses. This is a huge misunderstanding that many people, especially those in Washington, seem to be suffering from.

 To understand why the losses are real, consider this simple example: imagine a bank that lent someone $750,000 via an Option ARM mortgage to buy a McMansion in California at the peak of the bubble less than two years ago. Virtually all homeowners with this type of loan will default, thanks to declining home prices, the structure of the loan, and the fact that 70-80% of Option ARMs were liar’s loans. If we assume the house is only worth $400,000 today, then there’s been an actual loss of $350,000. That money will never be recovered. If one considers the millions of toxic loans made during the bubble – subprime, Alt-A, Option ARM and second mortgages, home equity lines of credit, commercial real estate, leveraged loans, credit cards, etc. – it easily adds up to at least $1 trillion in additional, unrecognized very real losses.

 Imagine that New RTC buys this loan for $400,000. In this case, it might not lose money, but then the bank (or the structured finance pool) holding the loan has to immediately realize the loss of $350,000 – and it is certain that the U.S. (and world) financial system has not even come close to marking these assets to what they’re really worth, which explains why they won’t lend, even when given new money. Thus, if New RTC buys these assets at fair value, then the financial institutions suffer the losses – but this would bankrupt many of them. Yet if New RTC pays the inflated prices they’re marked at today, then it (and taxpayers) will suffer huge losses.

Who Should Bear the Losses?

To save our financial system, somebody’s going to have bear these losses – the only question is, who? Some fraction of this will certainly have to be taxpayer money, but all of it needn’t be if the government would stop bailing out all of the debt holders.

 Government policy has been all over the map. Among the large financial institutions that have run into trouble (in chronological order, Bear Stearns, IndyMac, Fannie & Freddie, Lehman, AIG, WaMu, Citigroup and Bank of America), in some cases the equity was somewhat protected, while in others was wiped out, and likewise with the debt. Most likely due to the chaos that ensued after Lehman filed for bankruptcy, the current policy, as reflected in the most recent cases of Citi and BofA, is to at least partially protect the shareholders and, incredibly, 100% protect all debt holders, even junior/unsecured/subordinated debt holders.

 The result is at least a $1 trillion transfer of wealth from taxpayers to debt holders. This makes no sense from a financial, fairness or moral hazard perspective. While there’s an argument that the government should protect senior debt holders to preserve confidence in the system (even though they knowingly took risk – after all, they could have bought Treasuries), the junior debt holders got paid even higher interest in exchange for knowingly taking even more risk by being subordinate in the capital structure (of course, equity and preferred equity holders are the most junior). These investors made bad decisions, buying junior positions in highly leveraged companies that made bad decisions, so why should they be protected?

 Moreover, the reckless behavior of debt investors was a major contributor to the bubble. It was low-cost debt with virtually no strings attached that allowed borrowers, especially the world’s major financial institutions, to become massively overleveraged, fueling the greatest asset bubble in history. This was not an equity bubble – unlike the internet bubble, for example, stock market valuations never got crazy – it was a debt bubble, so it would be particularly perverse and ironic if government bailouts allowed equity holders to take a beating, yet fully protected debt holders.

 Case Study: Bank of America

Let’s look at Bank of America (BAC), which effectively went bankrupt last week (disclosure: we are short the stock). The cost to taxpayers of avoiding this outcome wasn’t the headline $20 billion, but far more – the government is going to take a bath on the $120 billion that it guaranteed – and it’s likely that this is just the beginning of the losses.

 Consider this: as of the end of 2008, BofA had $1.82 trillion in assets ($1.72 trillion excluding goodwill and intangibles), supported by a mere $86.6 billion in tangible equity – 5.0% of tangible assets or 20:1 leverage – and $48.9 billion of tangible common equity – 2.8% of tangible assets or 35:1 leverage (common equity excludes the TARP injection of capital in the form of preferred stock, which has characteristics of both debt and equity). (All data from BofA’s earnings release on 1/16/09; note that these figures include Countrywide, but not Merrill Lynch)

 At such leverage levels, it only takes tiny losses to plunge a company into insolvency. It’s impossible to know with precision what BofA’s ultimate losses will be, but among the company’s loans are many in areas of great stress including $342.8 billion of commercial loans ($6.5 billion of which is nonperforming, up from $2.2 billion a year earlier), $253.5 billion of residential mortgages ($7.0 billion of which is nonperforming, up from $2.0 billion a year earlier), $152.5 billion of home equity loans (HELOCs; about $33 billion of which were Countrywide’s), and $18.2 billion of Option ARMs (on top of the $253.5 billion of residential mortgages; all of which were from Countrywide, which reported that as of June 30, 2008, 72% were negatively amortizing and 83% had been underwritten with low or no doc).

 BofA is acknowledging a significant increase in losses, but its reserving has actually become more aggressive over the past year. From the end of 2007 to the end of 2008, nonperforming assets more than tripled from $5.9 billion to $18.2 billion, yet the allowance for credit losses didn’t even double, from $12.1 billion to $23.5 billion. As a result, the allowance for loan and lease losses as a percentage of total nonperforming loans and leases declined from 207% to 141%.

 So BofA had big problems on its own and then made two very ill-advised acquisitions, the result of which effectively wiped out the company, causing the government to come in and bail it out, at a huge cost to taxpayers. So what price is being paid? NONE! The architect of this debacle, Ken Lewis, is still in place, as is the board that approved everything he did. Ditto with Citi. These banks are just getting do-overs, with the management, boards and debt holders not being touched – the only losers are the common shareholders (to some extent) and taxpayers (to a huge extent).

 Since big losses from Merrill Lynch triggered last week’s bailout of BofA, why are all of its debt holders ($5.3 billion of junior subordinated notes, $31.2 billion of short-term debt and $206.6 billion of long-term debt) being protected 100%, while taxpayers are taking a bath eating Merrill’s losses from its reckless, greedy behavior?! This is madness.

A Better Solution

So what’s a better solution? I’m not arguing that BofA (or Citi or WaMu or Fannie or Freddie or AIG or Bear) should have been allowed to go bankrupt – we all saw the chaos that ensued when Lehman went bankrupt. Rather, if a company blows up (and can’t find a buyer), the following things should happen:

1) The government seizes it and puts it into conservatorship (as Fannie, Freddie, IndyMac and AIG effectively were, to one degree or another);

2) Equity is wiped out (again, as with Fannie, Freddie, IndyMac and AIG);

3) However, unlike Fannie, Freddie, IndyMac and AIG (and certainly Citi and BofA), everything in the capital structure except maybe the senior debt is at risk and absorbs losses as they are realized; the government would only provide a backstop above a certain level. This is what happened in the RTC bailout;

4) Over time, in conservatorship, while the businesses continue to operate (no mass layoffs, distressed sales, etc.), the government disposes of the companies in a variety of ways (just as the RTC did via runoff, selling the entire company or piece-by-piece, etc.), depending on the circumstances (as it’s doing with AIG and IndyMac, for example – these are good examples, except that the debt holders were protected).

Counter-Arguments

One counter-argument to my proposal is that we don’t want the government to nationalize banks. I don’t like it either, but the alternative – inject hundreds of billions of dollars of taxpayer money and not take control – is even less palatable. There should certainly be urgency in disposing of the companies, but also the recognition that it could take years, as with the RTC.

 Another counter-argument is Lehman: nobody wants a repeat of the chaos that ensued when the company went under and debt holders were wiped out. But the mistake here wasn’t the failure to protect the debt, but rather allowing the company to go bankrupt, which not only impacted Lehman’s equity and debt holders, but also stiffed Lehman’s countless clients and counterparties. It’s the latter that caused the true chaos. Lehman should have been seized and put into conservatorship, so that all of Lehman’s clients and counterparties could have relied on Lehman (as was done with AIG) – but debt holders would have taken losses as they were realized (which is not being done with AIG).

A final argument for protecting the debt is the fear of contagion effects: for example, other financial institutions who own the debt might become insolvent (this was probably why Fannie and Freddie subdebt was saved). Also, debt markets might freeze up such that even currently healthy banks might not be able to access debt and collapse.

 Regarding the former, the debt is owned by a wide range of institutions all over the world: sovereign wealth funds, pension funds, endowments, insurance companies and, to be sure, other banks. Some of them would no doubt be hurt if they take losses on the debt they hold in troubled financial institutions – but that’s no reason to protect all of them 100% with taxpayer money.

 As for the latter concern that debt markets might freeze up, causing even healthy banks to collapse, it’s important to understand that right now there is no junior debt available to any financial institution with even a hint of weakness – there’s very high cost equity and government-guaranteed debt. Neither of these will be affected if legacy debt holders are forced to bear some of the cost of the failure of certain institutions.

 Conclusion

The new Obama administration needs to understand that the greatest heist in history is underway – at least $1 trillion is being transferred from taxpayers to debt holders of failed financial institutions – and take steps to stop it before taxpayers suffer further unnecessary losses.

=================================================

Share this:

  • Click to share on Reddit (Opens in new window) Reddit
  • Click to share on Facebook (Opens in new window) Facebook
  • Click to share on LinkedIn (Opens in new window) LinkedIn
  • More
  • Click to share on X (Opens in new window) X
  • Click to share on Pinterest (Opens in new window) Pinterest
  • Click to share on Tumblr (Opens in new window) Tumblr
  • Click to print (Opens in new window) Print
  • Click to email a link to a friend (Opens in new window) Email
Like Loading...

Has World War III Started?

09 Friday Jan 2009

Posted by jschulmansr in agricultural commodities, alternate energy, Austrian school, banking crisis, banks, Barack Obama, bear market, Bollinger Bands, bull market, capitalism, central banks, China, Comex, commodities, communism, Copper, Currencies, currency, Currency and Currencies, deflation, depression, diamonds, dollar denominated, dollar denominated investments, economic, economic trends, economy, Finance, financial, Forex, Fundamental Analysis, futures, futures markets, gold, gold miners, hard assets, heating oil, How To Invest, How To Make Money, India, inflation, Investing, investments, Keith Fitz-Gerald, Latest News, Make Money Investing, Marc Faber, market crash, Markets, mining companies, mining stocks, Moving Averages, natural gas, Nuclear Weapons, oil, palladium, Peter Schiff, physical gold, platinum, platinum miners, precious metals, price, price manipulation, prices, producers, production, protection, rare earth metals, recession, risk, run on banks, safety, Saudi Arabia, Sean Rakhimov, Siliver, silver, silver miners, small caps, socialism, sovereign, spot, spot price, stagflation, Stocks, Technical Analysis, timber, Today, U.S. Dollar, uranium, volatility, warrants, Water

≈ Comments Off on Has World War III Started?

Tags

agricultural commodities, alternate energy, Austrian school, banking crisis, banks, bear market, Bollinger Bands, bull market, capitalism, central banks, China, Comex, commodities, communism, Copper, Currencies, currency, deflation, depression, diamonds, dollar denominated, dollar denominated investments, economic, economic trends, economy, financial, Forex, futures, futures markets, gold, gold miners, hard assets, heating oil, India, inflation, investments, Keith Fitz-Gerald, Marc Faber, market crash, Markets, mining companies, Moving Averages, natural gas, oil, palladium, Peter Schiff, physical gold, platinum, platinum miners, precious metals, price, price manipulation, prices, producers, production, protection, rare earth metals, recession, risk, run on banks, safety, Saudi Arabia, Sean Rakhimov, silver, silver miners, socialism, sovereign, spot, spot price, stagflation, Technical Analysis, timber, U.S. Dollar, volatility, warrants, Water

Has World War III already started? According to Marc Faber it has! Check out his interview. Next do you think the government can lose? According to this pundit not only will it lose it is going to lose big! Finally, for years now China has been coming to the rescue by buying Treasuries and US Debt, what will happen when they and other countries stop? Continuation of series from yesterday’s post. Just In! Peter Schiff Interviwed on Russian TV- Get Prepared!  adjust your portfolios and if you own Precious Metals hang on for the ride of your life!- Good Investing!- jschulmansr

Marc Faber on the Economy, Gold, WWIII – Seeking alpha

By: Tim Iacono of Iacono Research

Another good interview with Dr. Marc Faber, this one over at Bloomberg where he’s been a regular for many years (recent appearances at the likes of CNBC are somewhat unusual as he tends to go against conventional wisdom, something that abounds at CNBC).
IMAGE

Click to play in a new window

There’s lots of good stuff in this one – the outlook for the global economy, oil, gold, base metals, natural resource stocks, World War III having already started…

On the subject of alternatives to the government solutions for the current problems, he was asked how he expected the populace to stand for the government doing nothing?

That’s the problem of society. If people can not accept the downside to capitalism, then they should become socialists and then they have a planned economy. They should go to eastern Europe twenty years ago and to Russia and China for the last 70 years.

How do you tell that to somebody in Detroit who’s losing his home today?


Why is he losing his home? Because of government intervention. The government – the Federal Reserve – kept interest rates artificially low and created the biggest housing bubble, not just in the U.S. but worldwide. That is what I’d explain to the worker in Detroit.

============================================

How the Federal Government will Lose in 2009 – Seeking Alpha

By: Rob Viglione of The Freedom Factory

Through a combination of incompetence and greed, the federal government has placed itself in a position of checkmate. There is no way to finance its budget deficits without devaluing the dollar or causing interest rates to rise. With $10.6 trillion in debt, $8.5 trillion in new money created or given away in 2008, and multiple years of trillion dollar deficits planned by Obama, government has no way to fund its extravagances without either printing a lot more money or borrowing unprecedented sums.

This means that either Treasury bonds will crash, or the dollar will suffer significant devaluation relative to foreign exchange or precious metals, especially gold.

TV Does Great Interview With Peter Schiff (Russian TV, That Is)

=====================================================

Remember Dare Something Worthy Today Too!


Market forces are telling the world to shed unproductive assets and shrink capacity, yet central banks and governments around the world, in particular the U.S., are refusing to listen. Rather than allow markets to snap back to sustainable equilibrium from previously artificial highs, the federal government clings to the notion that forcibly shuffling resources, propping up asset prices, and diluting the money supply will magically save the day.

There are consequences to everything. The consequences of shuffling resources (taxing productive ventures and doling out those resources to failing ones, i.e. bailouts) are stunted growth for good businesses and propagation of bad ones. Artificially propping up asset prices means that those who are generally less competent remain the custodians of society’s capital, and diluting the money supply inflates aways everyone’s wealth over time, particularly harming the poor and middle class.

For decades the federal government has gotten away with this reshuffle and inflate game, but the pawns are drowning, the rooks helpless, and the knights ready to turn on the King. Perhaps this is overly dramatic. Clearly, I doubt the capability of the Federal Reserve, Congress, and Obama to “fix” the economy; rather, I strongly believe they are destroying it by forcing us all to drink this Keynesian Kool-Aid. However, whether or not the economy recovers amidst this historic central government action, there are two phenomena we can exploit to our advantage:

  • Short the US dollar
  • Short US Treasuries

In “When will the great Treasury unwinding begin?” I show how government debt has been bid to unsustainable levels and will likely fall. The one concern I see stated all too often is that the Federal Reserve will keep buying Treasuries to artificially depress interest rates. This will, it is claimed, keep bond prices inflated. The one undeniable counter to this is that government must somehow fund its $1.2 trillion estimated 2009 deficit. It cannot do this by issuing and then buying the same bonds. It can only raise revenue by selling bonds to other parties, or by diluting the money supply by cranking up the printing presses. There are no other options. There you have it – we have the government in checkmate!

The likely outcome is that they will try to do both. That is why I am heavily shorting both 30-Year Treasury bonds and the dollar. Both assets will likely lose as the government becomes increasingly desperate and the world’s biggest buyers realize there are better alternatives available. Make your bets now before it becomes treasonous to bet against Big Brother!

Disclosure: Long UDN, short TLT, long GLD.

==============================================

Five New Forces to Drive Gold Higher – Seeking Alpha

By: James West of The Midas Letter

Gold naysayers habitually point to the relatively weak performance of gold relative to the broader market over the last 5 years. Given the market today, that argument is increasingly wrong, and the naysayers are soon to either admit their mistake, or pretend that they were never naysayers at all. That’s because during the last 3 months, five major new forces have emerged to compound the previous strong drivers of the gold price up to now.

These new forces are as follows:

  1. China has stopped buying U.S. debt.
    An interesting piece in the New York Times today signals that China, up until now the biggest buyer of U.S. Treasuries and bonds issued by Fannie and Freddie, is moving towards an end to that policy. China holds over US$1 trillion of such paper, and as interest rates collapse, there is less and less incentive for them to buy American.China has made several adjustments to programs that used to give banks and other financial institutions within the country incentive to buy U.S. assets, which means essentially that these same customers for assets will now be looking for Chinese products.The effect this will have on gold is two-fold. In the first place, reduced demand for U.S. debt will hamper Obama’s plans to keep printing money, because the one limiting factor that still seems to be respected in terms of how much paper can be printed, is the idea that there must be a counterparty to every issuance of T-Bills to warrant continued printing. Theoretically, less demand for T-Bills will force a rise in interest rates to attract investors. But that does not appear forthcoming, which will make the U.S. dollar weak relative to other currencies – especially gold.The second effect is that by eliminating incentives for Chinese banks to acquire U.S. denominated assets, investors there will divert more funds to holding gold as a hedge against their current U.S. dollar holdings, which will be diminishing in value.
  2. Future discoveries of gold deposits will diminish dramatically.
    The biggest source of gold ounce inventory for major gold producers is the discoveries made by the several thousand juniors who scour the earth in search of favorable geology. With the collapse in base metals prices, many of these juniors are under increasing pressure to consolidate and downsize, and many more will disappear altogether.That means less money going into gold exploration, and that means the number of new discoveries that can be acquired by majors is going to go down sharply in the coming years. In theory, as gold continues to outperform all other asset classes, there will be a rush back into junior gold exploration, but that won’t happen until gold is taken much higher and investment demand for it soars.
  3. Existing by-product gold production will fall sharply
    In copper, zinc and other base metals mines around the world, gold occurs in metallic deposits as a by-product of some other dominant mineral. In the United States, 15 percent of gold production is derived from mining copper, lead and zinc ores.With the collapse in prices for these metals, the by-product production of gold is most often insufficient to justify the continued operation of the mine profitably, and it is likely that a significant amount of this by-product gold production will cease along with the shutdown of these operations. The result will be less gold production from existing operations, contributing to the now even faster growing gap between supply and demand.
  4. Gold is becoming mainstream
    One of the biggest contributors to gold’s unpopularity as a main street investment is that it has been mercilessly derided and ridiculed by mainstream investment media and institutions. There is very little opportunity for an investment advisor to insinuate himself into a gold purchase transaction, since most anybody who wants to hold the metal can visit their local bullion exchange or mint and buy as much as they’d like. Because the massive investment institutions that dominate the investment advisory business can’t make a fee out of advising you to buy gold, they try to convince you to purchase other asset classes which their firm has either originated or is a participant in a syndication of investment banks selling such products.Thanks to the widespread coverage of the questionable integrity of these complex securities, and since many main street investors have been burned by their investment advisors (they feel), there is increasing main street advice being doled out to buy gold. One need only search Google news on any given day to discover that headlines critical of gold are now replaced with headlines singing its praises.
  5. Gold is the best performing asset class of the decade
    Now that the global financial meltdown has got up a head of steam, investors are hard pressed to find any investment that has performed well over the last ten years as consistently as gold. The chart below outlines this performance and appears here courtesy of James Turk’s GoldMoney.com.
Gold Performance: 2001-2008 (click to enlarge)
Gold Performance 2001 - 2008

As you can see, any investment still returning an average of 10 – 17 percent is a winner, compared to everything else you can generate a chart for. As this intelligence permeates the none-too-quick popular investment imagination, and, combined with the other 4 factors, gold is going to be where the world’s next crop of millionaires is minted.

===========================================

Share this:

  • Click to share on Reddit (Opens in new window) Reddit
  • Click to share on Facebook (Opens in new window) Facebook
  • Click to share on LinkedIn (Opens in new window) LinkedIn
  • More
  • Click to share on X (Opens in new window) X
  • Click to share on Pinterest (Opens in new window) Pinterest
  • Click to share on Tumblr (Opens in new window) Tumblr
  • Click to print (Opens in new window) Print
  • Click to email a link to a friend (Opens in new window) Email
Like Loading...

The U.S. Dollar and Deficit-Gold Relationships

08 Thursday Jan 2009

Posted by jschulmansr in Bollinger Bands, capitalism, commodities, Copper, Currency and Currencies, deflation, Finance, Fundamental Analysis, gold, hard assets, How To Invest, How To Make Money, Investing, investments, Latest News, Make Money Investing, Markets, mining companies, mining stocks, Moving Averages, oil, platinum, precious metals, silver, small caps, Stocks, Technical Analysis, Today, U.S. Dollar, Uncategorized

≈ Comments Off on The U.S. Dollar and Deficit-Gold Relationships

Tags

agricultural commodities, alternate energy, Austrian school, banking crisis, banks, bear market, Bollinger Bands, bull market, capitalism, central banks, China, Comex, commodities, communism, Copper, Currencies, currency, deflation, depression, diamonds, dollar denominated, dollar denominated investments, economic, economic trends, economy, financial, Forex, futures, futures markets, gold, gold miners, hard assets, heating oil, India, inflation, investments, Keith Fitz-Gerald, market crash, Markets, mining companies, Moving Averages, natural gas, oil, palladium, Peter Schiff, physical gold, platinum, platinum miners, precious metals, price, price manipulation, prices, producers, production, protection, rare earth metals, recession, risk, run on banks, safety, Saudi Arabia, Sean Rakhimov, silver, silver miners, socialism, sovereign, spot, spot price, stagflation, Technical Analysis, timber, U.S. Dollar, volatility, warrants, Water

My Note- Gold came roaring back today and being beaten down yesterday, currently Gold is up $15 at $856+ and holding above the $850 level. Today’s articles explore the relationship of the U.S. Dollar, the Deficit and National Debt; and their relationship to Gold prices. If you are not alarmed by the current deficit you should be! Now with Obama predicting a yearly deficit of over 1 Trillion dollars what does this mean for the Economy, the Dollar and the price of Gold? Read On and Find Out… Good Investing – jschulmansr

Things We Don’t Talk About (But Should); National Debt and the $2 Trillion Deficits- Seeking Alpha

By: Jonathan O’Shaughnessy of Emerginvest Blog & Emerginvest 

It has been around for decades, and has been ignored by many for just as long. However, the US national debt stands to finally be thrown into the forefront of political discussion as the record for a single-year deficit looks to be beaten – by threefold.

According to the government-run TreasuryDirect.gov, US national debt is the largest it has been in history at $10.6 trillion, or $10,638,425,746,293.80. This is at a time when the US is facing the worst economic crisis since the Great Depression, which requires record-shattering government spending to stabilize the faltering economy. In addition, global demand for US national debt is waning as countries world-wide are implementing their own financial stimulus packages. Yet economists are virtually unanimously advocating for radical government spending to stabilize the economy, which leaves future generations of Americans holding extremely large amounts of national debt.

The problem for the average American is twofold: national debt doesn’t seemingly affect their daily lives and $10.6 trillion is a hard number to conceptualize. After a certain point, the human brain stops comprehending the magnitude of a given number, and simply categorizes it as “extremely large.” Subsequently, there is little public outrage or discussion when the US has run up a few hundred billion dollar deficit in years past. It doesn’t seem to affect their lives, no government projects are cut, and adding $0.2T onto $10.6T seems relatively insignificant.

However, when viewed in another light, the enormity of the national debt is astonishing. According to the 2007 United States budget, and TreasuryDirect.gov, the interest alone on national debt is approximately $460 billion. It accounts for the second-highest expenditure on the US budget and if the US could forgo paying that interest on national debt for one year, the United States government could:

1) Pay for the entire education budget of the United States six times over

2) Reduce federal taxes by 33% for all Americans, or

3) Write a check to every man, woman, and child in the United States for $1,500.

Yet, that $460 billion in annual interest looks to grow substantially with looming deficits in the years to come.

A New York Times article entitled “Obama Warns of Prospect for Trillion-Dollar Deficits,” stated: “President-elect Barack Obama on Tuesday braced Americans for the unparalleled prospect of ‘trillion-dollar deficits for years to come.’” President-elect Obama did not give details about the size of the deficit, but projections place the proposed deficit at close to $1.2 trillion for 2009, shattering the record from President Bush last year at $455B.

That is not counting the proposed $800B 2-year stimulus package which could easily raise the deficit into the $1.7 trillion range – bringing the national debt to roughly $12.3 trillion by the end of 2009. Assuming deficits run at approximately $1 trillion per year for the next two years, which may or may not be conservative, the US could see its national debt as high as $15 trillion in three years.

Subsequently, Obama added emphasis on tighter government regulation, quoted in the NYTimes article as saying: “’ We’re not going to be able to expect the American people to support this critical effort unless we take extraordinary steps to ensure that the investments are made wisely and managed well.’” In correlation, he created a new position, chief performance officer, in charge of eradicating government inefficiencies.

This comes at a time however, when global demand for US debt is falling sharply. A prime example is China, one of the largest creditors to the US, which has heavily curtailed its purchases of US debt in light of the recent financial crisis. Another NYTimes article entitled: “China Losing Taste for Debt from U.S.,” states that: “China’s foreign reserves will increase by $177 billion this year — a large number, but down sharply from an estimated $415 billion last year.” The Chinese government is dealing with their own economic woes – a stock market which has shed two thirds of its value in the last year – and is attempting to implement their own economic stimulus package. Furthermore, the sharp outflow of foreign direct investment in China has further complicated the issue. The situation is similar across the world, as the Emerginvest heat map shows the damage from the past quarter (click to enlarge):

The lack of global demand for US national debt could put severe pressure on US interest rates in the years to come if demand continues to shrink drastically. However, there is a political buffer, as the article stated that: “China’s leadership is likely to avoid any complete halt to purchases of Treasuries for fear of appearing to be torpedoing American chances for an economic recovery at a vulnerable time, said Paul Tang, the chief economist at the Bank of East Asia. ‘This is a political decision,’ he said. ‘This is not purely an investment decision.’”

Yet even in the face of significant strain on government debt and sagging global demand, economists are virtually unanimous in calling for exorbitant amounts of government spending to stabilize the economy. Yet another NYTimes article entitled: “A Crisis Trumps Constraint,” states that: “To a degree that would have been unimaginable two years ago, economists and politicians from across the political spectrum have put aside calls for fiscal restraint and decided that Congress should spend whatever it takes to rescue the economy,” in addition to: “’It pains me to say that because I am a fiscal conservative who dislikes budget deficits and increases in government spending,’ Mr. Feldstein told the lawmakers. But he said, ‘Reviving the economy requires major fiscal stimulus from tax cuts and increased government spending.’”

Therefore, it looks as if the U.S. is inexorably tied to unparalleled government spending in the short term, nearly guaranteeing a national debt of over $14 trillion within a few years. The Obama administration has hinted at overhauling Medicare and Social Security as ways of dampening the gargantuan deficits, but the method, and certainly the net effect of such an undertaking remains ambiguous until the budget is revealed. It seems as if, in the interest of short term self-preservation, future generations of Americans will be inevitably saddled with incomparable amounts of national debt which will heavily shape future American fiscal policy for decades.

Disclosure: Emerginvest is an international finance portal, providing analysis and data on 120+ world markets to help individuals find investments from around the world. Emerginvest provides impartial information about world stock markets, and does not have any holdings in foreign equities.

===============================================

Government Panic Could Herald Dollar Panic – Seeking Alpha

Source: John Browne of Euro Pacific Capital

One of the few things more troubling for an economy than government intervention is government intervention driven by panic. Time and again, history has shown that when governments rush to engineer solutions to pressing problems, unintended difficulties arise.

In the current crisis, there is growing evidence that Washington is in a state of increasing panic. Despite its massive cash injections, market manipulations and ‘rescue’ plans, the recession is clearly deepening and spreading. With little to show thus far, politicians don’t know if they should redouble past efforts, break ground on new initiatives, or both. However all agree, unfortunately, that the consequences of doing too little far outweigh the consequences of doing too much.

Although there are many parallels between the current crisis and the Crash of 1929, one key difference is the global profile of the U.S. dollar. In 1929, the dollar was on the rise, and would soon eclipse the British Pound Sterling as the world’s ‘reserve’ currency. Furthermore, the American economy was fundamentally so strong that in 1934 America was the only major nation able to maintain a currency tied to gold.

Ever since, the U.S. dollar’s privileged ‘reserve’ status has been a principal factor in America’s continued prosperity. The dollar’s unassailable position has enabled successive American governments to disguise the vast depletion of America’s wealth and to successfully increase U.S. Treasury debt to where the published debt now accounts for some 100 percent of GDP. The total of U.S. government debt, including IOU’s and unfunded programs, now stands at a staggering $50 trillion, or five times GDP! If the dollar were just another currency, this never would have been possible.

In today’s crisis however, the dollar is likely making its last star turn as the leading man in the global financial drama. Other stronger, less burdened currencies are waiting in the wings for the old gent to take his final bows.

The dollar’s demise is being catalyzed by the neglect of the Federal government. Instead of enacting policies that would restructure the U.S. economy, and restore productive, non-inflationary wealth creation, Congress is simply financing the old crumbling edifice.

Faced with the growing realization that America is not doing the work necessary to right its economic ship, it will not be long before America’s primary creditors begin to seriously question the nation’s ability to service, let alone repay, its debts.

There is now the prospect (inconceivable until recently), that America could lose its prestigious ‘triple-A’ credit rating. In today’s risk adverse market, this could cost the Treasury one percent in interest on long bonds. Each additional percentage point of interest would cost America some $10 billion a year on each trillion dollars of new debt, or some $300 billion over the life of a 30-year bond.

Many of the foreign governments who hold huge amounts of U.S. dollar Treasury debt, such as China and Japan, have announced plans to spend money on their own ailing economies. Should these foreign central banks divert to domestic initiatives some of the funds used to buy U.S. Treasuries, serious upward pressure on U.S. interest rates will result. Should they actually sell parts or all of their holdings they will likely put serious downward pressure on the U.S. dollar. Last week, a Chinese official claimed the U.S. dollar should be phased out as the world’s ‘reserve’ currency.

In the short term, as dollar ‘carry-trades’ continue to be unwound and questions of political will and falling interest rates haunt the Euro and some other currencies, the U.S. dollar may be the recipient of some upward appreciation. But with the American government appearing increasingly to be in panic mode, a run on the U.S. dollar could develop rapidly into cascading devaluation. Even if no such panic run materializes the long-term outlook for the U.S. dollar is one of high risk and low return. This beckons major upward pressure on precious metals.

========================================

What is Going On With Gold? – Seeking Alpha

Source: The Pragmatic Capitalist

Gold (ETF:GLD) is one of the most fascinating and talked about assets on the planet. There are more conspiracy theories and story lines behind gold than just about anything on earth. Heck, the followers of the asset even have their own club: the goldbugs. You can’t go a day without seeing a commercial about gold. If you google “buy gold” you get almost as many results as if you search “buy real estate” (15.4MM vs 16MM).

But gold has been acting funny lately. The conspiracy theories have been running even crazier than usual (from government conspiracy to backwardation) and the goldbugs are angry. As the world economy deteriorates and the U.S. prints money like it’s going out of style, gold has not appreciated. If you had told me in December of 2007 that the global stock market would fall 40% in 2008 I would have told you to buy gold and nothing else because of its safehaven characteristics. But a funny thing happened on the way to the demise of the global economy: Gold fell.

After rallying into the second quarter of 2008, gold went on a gut wrenching 6 month decline of over 30% – all in the midst of one of the greatest financial collapses ever. It was, if nothing else, quite a paradox. Even crazier, the US dollar stabilized and then rallied into the end of 2008. Why did this happen? How could gold fall in such an environment?

Gold remains an anti-dollar investment. It’s as simple as that. When you buy gold you’re essentially buying a hard asset currency with the hope that one day it will become the world’s choice of currency again. If the dollar (UUP) weakens or one day fails the likelihood of a gold based currency increases. In essence, buying gold is a way of betting against the greenback and U.S. economic dominance. You can argue the extent of my argument, but you can’t really argue with the inverse correlation in the two assets:

Click to enlarge

The correlation is clear. If you’re betting on a rise in gold you’re betting on a falling dollar. I’ve been banking on a higher dollar for over 6 months for one reason: it’s the best currency in a bad lot. Jim Cramer should change his area of expertise to currencies, because while there isn’t always a bull market in stocks and commodities, there is always a bull market somewhere in the currency market. Trades are paired in Forex and unfortunately, it’s hard at this time to make an argument in favor of other currencies over the greenback. And as long as the greenback remains strong it’s unlikely that gold will make any sustainable run.

So why is the dollar the best of the worst? It’s quite simple in my mind. Two major currencies on the planet now effectively bear zero interest: the dollar and the Yen. Of the two, the U.S. is the far superior economy. In essence, neither country can really devalue their currency all that much more unless they decide to print money to the point of insanity and although I believe the U.S. is printing wildly I am not incredibly alarmed as of yet simply because the destructive deflationary forces at work are so much greater than the inflationary response by the Fed. Inflation is certain to rear its ugly head in the coming years, but I suspect it will be relatively mild as the economic rebound is slow and the overall monetary destruction of this deflationary phase proves to be incredible.

So, getting back to the greenback – the U.S. was first to enter a recession and it now looks like the world is catching pneumonia from our cold. Unfortunately Europe and Asia still have relatively high interest rates (read: room for currency devaluation) and simply don’t carry the same status as the U.S. – we are the reserve currency and the only true AAA nation. Yes, you can certainly make the argument that the U.S. is no longer a AAA rated country, but if we’re AA then what does that make Japan (the world’s second largest economy) or Germany? Much worse, in my opinion.

So what we’re seeing is essentially a flight to quality in a time of financial distress? Yes, that’s right, the U.S. dollar is a higher quality asset right now than just about any currency on the planet. And if you’re a U.S. citizen you should be thanking your lucky stars it’s THE reserve currency because this crisis would likely be even worse if that wasn’t the case.

So, before you go placing bets on gold it might be better to research the greenback first.

==================================================

Not Time To Exit Commodity Positions – Seeking Alpha

By: J.D. Steinhilber of Agile Investing

Diversified commodities have suffered approximately the same one-year decline as stocks, but the descent has been more violent since broad commodity indexes peaked in the middle of 2008, whereas most stock indexes peaked in October 2007. Just as it is not the time to abandon stock market commitments, this is certainly not the time to exit commodity positions in the context of a diversified multi-asset portfolio.

Cyclical commodities are not a valuable hedge to a stock portfolio in a deflationary bust and a liquidity crisis such as we have seen, but those conditions are not likely to persist over any investment horizon measured in years rather than months. Massive government reflation and stimulus efforts will support hard assets in 2009. Infrastructure spending is bullish for commodity prices, and tighter credit conditions, along with lower prices, puts pressure on the supply of commodities as suppliers curtail production.

Gold finished the year on a very strong note and managed to produce another year of positive returns in 2008. Gold has the most attractive three and five year annualized returns of all the asset classes we track. Gold will continue to be whip-sawed by the volatility in the currency markets.

We hold Gold (GLD) in our portfolios as an insurance policy against financial crisis and paper currency devaluation. The opportunity cost of holding gold, which produces no dividend or interest income, is now very low given that the Federal Reserve has cut the official U.S. overnight lending rate to zero to 0.25%, and has stated that “weak economic conditions are likely to warrant exceptionally low levels of the federal funds rate for some time.”

[click to enlarge]


===================================================

How Will Obama’s “Trillion Dollar Deficits” Affect the Markets? – Seeking Alpha

By: Simit Patel of Informed Trades.com

The New York Times has an article this week reporting on US President-elect Barack Obama’s warning that there will be ‘trillion-dollar deficits for years to come.” What does that mean for the markets?

The first line of recourse will be the issuance of Treasury bonds; in other words, the US government will look to borrow money, offering to pay it back with interest. The key question, though, is to what extent buyers of Treasuries will be easily found. As we have discussed previously, the very low yield on bonds coupled with the fact that the economic pains are being felt all around the world suggest one of two possibilities: bond rates will have to go up or the Federal Reserve will have to “monetize the debt” — meaning it will simply have to print more money.

I have stated and continue to believe that the result of increased deficit spending, due largely to government bailouts, in this environment will be debt monetization (even if there is a rate hike, that will only increase the future debt, and thus will only delay and exacerbate debt monetization). I believe this will prove to be inflationary, that it will devalue the US dollar, and that this is the real way the bailouts will be paid for; not via a direct tax, but rather a tax through inflation. Economist Mike Shedlock, however, offers a counter viewpoint:

The Fed at some point will resort to out and out monetization, and that will have the inflationists screaming at the top of their lungs. However, banks will still be reluctant to lend, and consumers and businesses will be reluctant to borrow. In addition, I expect the velocity of money printed to be close to zero and for the savings rate to rise. In aggregate, these are not hyperinflationary things. Heck, they are not even inflationary things.

Admittedly, I am one of those inflationists who will be screaming at the top of my lungs.

There are two reasons I believe debt monetization will be inflationary:

  1. I disagree with the notion that banks won’t lend and consumers won’t borrow. As I recently noted, we are seeing a declining TED spread as well as an increase in many money supply metrics (M1, M2, MZM). And even in this environment, we have seen companies like Verizon be able to secure a massive $17 billion loan.
  2. Even if lending is reduced due to the economic climate, debt monetization increases the likelihood that foreigners will not only stop buying Treasuries, but that they will sell the ones they have, and will dump US dollar holdings out of a concern of dollar devaluation by the part of the Federal Reserve. This suggests there will be a “run on the currency,” similar to what was seen in Argentina. See our previous article on the similiarities between the US economic crisis and the Argentinian crisis of 2001 for more on this subject.

How to Trade This Scenario

Timing is the key issue for trading this; we are currently seeing a rally in the market, though I expect that at some point in the second half of 2009 we will see the concerns about the Treasury market begin to manifest. As a trend-following trader I look for momentum that corresponds to my fundamental viewpoint, with the exception of precious metals, which I treat as buy and hold type investments.

With that in mind, here are the conclusions I am making based on the trillion dollar deficit scenario:

  1. US dollar will fall in value. For stock market traders, UDN is an ETF to watch.
  2. Dollar hedges like gold and silver will rise. GLD and SLV are corresponding ETFs.
  3. Both monetization of debt as well as a hike in interest rates will send bond prices falling, as a rate hike devalues all bonds previously issued at a lower rate while monetization of debt introduces inflation concerns and the possiblity of the bond being paid back with a currency that is worth less.
  4. A rate hike, which I think is increasingly unlikely given the Fed’s behavior though still possible, will be bearish for US stocks. DOG and SH are inverse ETFs worth considering in such a scenario.

Disclosure: Long gold and silver; currently short US dollar against Australian dollar.

==============================================

My Note: Whether as “Portfolio Insurance”, or as a Speculative Investment, I think now is the time to buy and Invest in  Gold and Precious Metals in any form. I am calling for $1000 to $1250 Gold later this year and even higher if the Middle East Situation disintergrates and gets worse. Other factors are mentioned in detail above, don’t kick yourself later, buy Precious Metals and Miners at these ridiculously low levels NOW!

My- Disclosure: I am long Physical Precious Metals, Etf’s, and Mining/Producer Stocks. I.e. my money is where my mouth is! Remember to do your own Due Diligence and read all Prospectus’s before making any investment. -jschulmansr

Share this:

  • Click to share on Reddit (Opens in new window) Reddit
  • Click to share on Facebook (Opens in new window) Facebook
  • Click to share on LinkedIn (Opens in new window) LinkedIn
  • More
  • Click to share on X (Opens in new window) X
  • Click to share on Pinterest (Opens in new window) Pinterest
  • Click to share on Tumblr (Opens in new window) Tumblr
  • Click to print (Opens in new window) Print
  • Click to email a link to a friend (Opens in new window) Email
Like Loading...

Gold-History Repeating Itself?

06 Tuesday Jan 2009

Posted by jschulmansr in Bollinger Bands, capitalism, commodities, Copper, Currency and Currencies, Finance, Fundamental Analysis, gold, hard assets, How To Invest, How To Make Money, inflation, Investing, investments, Jschulmansr, Latest News, Make Money Investing, Markets, mining stocks, Moving Averages, oil, precious metals, silver, small caps, Stocks, Technical Analysis, Today, U.S. Dollar, Uncategorized

≈ Comments Off on Gold-History Repeating Itself?

Tags

agricultural commodities, alternate energy, Austrian school, banking crisis, banks, bear market, Bollinger Bands, bull market, capitalism, central banks, China, Comex, commodities, communism, Copper, Currencies, currency, deflation, depression, diamonds, dollar denominated, dollar denominated investments, economic, economic trends, economy, financial, Forex, futures, futures markets, gold, gold miners, hard assets, heating oil, India, inflation, investments, Keith Fitz-Gerald, market crash, Markets, mining companies, Moving Averages, natural gas, oil, palladium, Peter Schiff, physical gold, platinum, platinum miners, precious metals, price, price manipulation, prices, producers, production, protection, rare earth metals, recession, risk, run on banks, safety, Saudi Arabia, silver, silver miners, socialism, sovereign, spot, spot price, stagflation, Technical Analysis, timber, U.S. Dollar, volatility, warrants, Water

Today’s action: Gold opened down by a few dollars and now has reversed itself and is cusrrently up $7-10 oz. Based off of chart formations it would appear that  Gold is breaking out to the upside and getting ready to challenge the $900 level, If it can break that then we are set up for a test of the $950-$975 level. If it fails here, a pullback to the $800 level (support base) will probably occur. Today’s articles include one about a new 2yr gold price cycle that appears to be forming. Next some questions answered about the markets for 2009. Finally a special report from Gold World about Gold Backed Banking. Enjoy and good investing! – jschulmansr

Gold’s 2-year cycle – MineWeb

A Mineweb reader has noticed a recent two-year cycle for gold price behaviour which, if it continues will likely give some guidance to price movements this year and next.

By: Joseph Cafariello

EDMONTON, CANADA –

There seems to be a two-year cycle in the gold price which has been repeating itself since about 2004.  The even years follow one pattern, while the odd years follow another pattern.  The even years tend to reach exaggerated extremes to the upside and to the downside on a percentage basis, while the odd years tend to be a little calmer with less volatility.

For example, 2008 went very much like 2006, with exaggerated highs reached in the spring of each year, and a late start to the traditional autumn-winter-spring upswing, which began around October/November of 06 and 08.  On the odd-number side, 2007 went much like 2005, with moderate highs reached in May of each year, and an early start to the traditional autumn-winter-spring upswing, which began around August/September of 05 and 07.

If this is indeed a reliable cycle, we can expect 2009 to be much like 2005 and 2007 all throughout the year.  The first half of 2009 should see gold follow the same pattern as the first halves of 2005 and 2007.  In the springs of 05 and 07, gold kept hitting its head against the previous year’s high all throughout the spring.  More than once during the spring of 2007, gold topped out at about $690, coming to within about 5% of the 2006 high of $735.  Similarly, the spring of 09 should see gold hitting its head against 2008’s high of $1,035, coming to within 5% of it, or up to about $985.  That will be the high for the first half of 2009 at around the beginning of May, though this will not be the high for 2009 as a whole.

Given the odd-number year pattern, we might also expect the back half of 2009 to be much like the back halves of 2005 and 2007.  In both 2005 and 2007, the summertime pull-backs were modest, and the autumn-winter-spring upswings started early, at around August/September of 05 and 07.  The latter half of 2009, then, should see a modest summer-time pull-back of about 5% to 7% of its spring 09 high, taking gold down from $985 in May 09 to about $925 by August 09.  However, the low for 2009 will still be the upcoming January low of $800, which is now only about a week or two away.  The lows of January 2005 and January 2007 were also “the” or “close to the” annual lows for those years.  So the low of 2009 will be at around $800 in January.

The high for 2009 will come in December.  The traditional autumn-winter-spring upswing in 2009-10 will be much as it was in 2005-06 and 2007-08, with an early start.  The year-end run for 09 will begin around August or the beginning of September, jumping from about $925 in Aug/Sep 09 and rising steadily until the end of December 09.  The annual highs for 2005 and 2007 were hit in or near December of each year, and each high was about 20% higher than the average of their first halves.  Thus, the annual high of 2009 will be hit in or near December, and will be 20% higher than the average of its first half, putting the 2009 high at about $1,150 in December.

The traditional autumn-winter-spring upswing, however, will certainly not end in 2009, but will spill over into the spring of 2010 much as it did in the springs of 2006 and 2008.  The high in the spring of 2008 was about 40% higher than high in the spring of 2006.  Hence, the high in the spring of 2010 will be about 40% higher than 2008’s high of $1,035, putting gold at about $1,450 in the spring of 2010.  Then, the summertime pull back of 2010 will be just as stark as were the summertime pullbacks of 2006 and 2008.

And so the two-year cycle will continue, where even-number years follow a pattern of extremes, while the odd-number years are calmer, but with a nice upward kick at the end.  This two-year cycle with even-number years on the extreme side and odd-number years on the moderate side will continue until the commodity boom is over (say around the year 2030, when the populations of China and India finally achieve a 75% middle-class), and until the US dollar recovers at around the same year (2030), when the rest of the world will be looking to the US as a nice place to shop given its then-to-be dirt-cheap dollar.

The above comment was contributed by Mineweb reader Joseph Cafariello who describes himself as “A raving gold bug and proud of it”

==========================================

2009 Market Q&A: Four Questions Answered – Seeking Alpha

Source: Eric Roseman of The Sovereign Society

By Eric Roseman

Over the last several weeks I’ve received numerous questions from Sovereign Society subscribers, including individuals who frequent our daily blog.

As we start 2009, I thought this would be an ideal forum to collect some of these important questions and attempt to give you my best conclusions. I can’t reprint all of these inquiries; but I’ve compiled several excellent questions from our members.

Overall, I don’t like forecasting. I generally believe it’s a total waste of time and most consensus estimates ahead of 2008 ended in the basement with the majority of analysts dead wrong about the economy, the market and just about everything else.

I have to admit that I never expected the markets to crash, the banking system to go bust or the dollar to skyrocket in the midst of the worst financial crisis in 75 years. To be fair, I think most pros failed to make accurate predictions.

Question: I’m a retired investor living on income. Prior to the big rally in Treasury bonds, I held most of my savings in short-term Treasury’s and bank term deposits. But with short-term rates under 1% and government bonds yielding a pittance, I’m nervous. What should I do to supplement my income?

Comment: This is perhaps the most challenging environment for retirees in more than a generation. With money-market funds yielding almost nothing, Treasury bonds yielding around 2% and bank CDs paying under 1%, retirees must supplement their income.

My advice is to take a small portion of your savings, say 20%, and scatter that sum across a dozen or more investment grade corporate bonds. I emphasize “investment grade” and not junk debt. Investment grade debt includes anything rated BBB or better in my book and, to make it easier, I would stick to issues rated A- or higher.

The Dow Jones Corporate Bond Index now yields 6.90% – down from its post-crash high yield of 8.87% in early $100 bill image
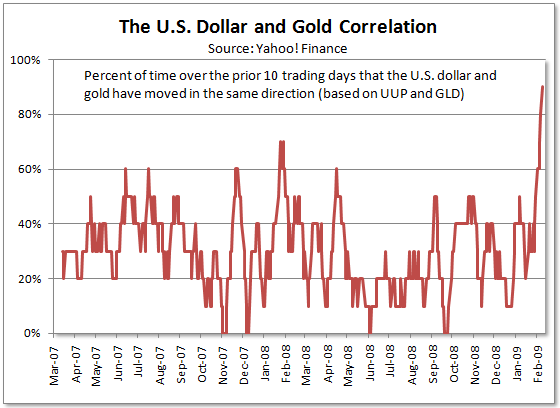
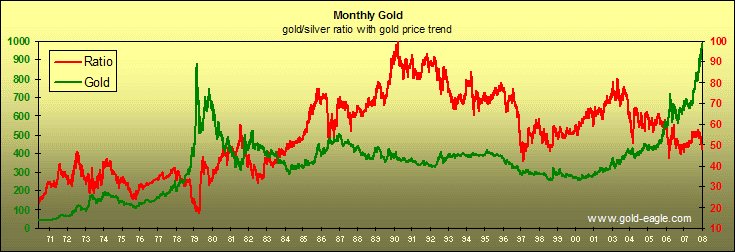
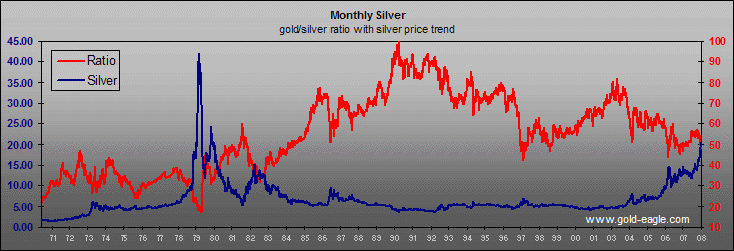
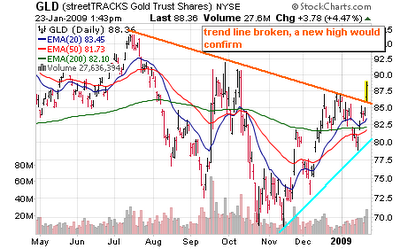
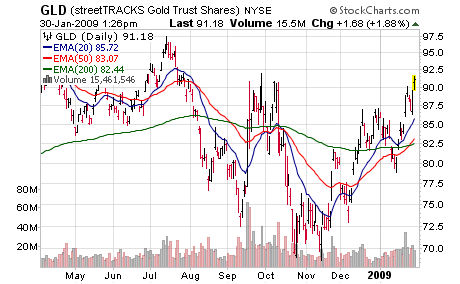
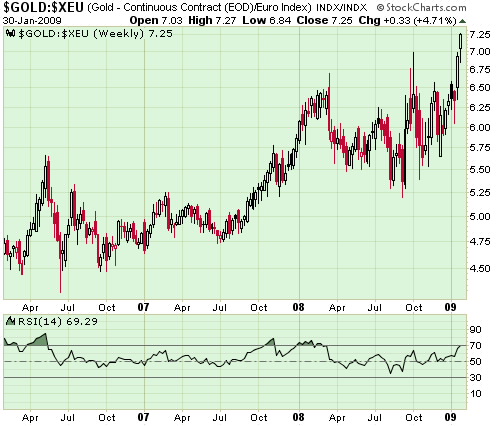
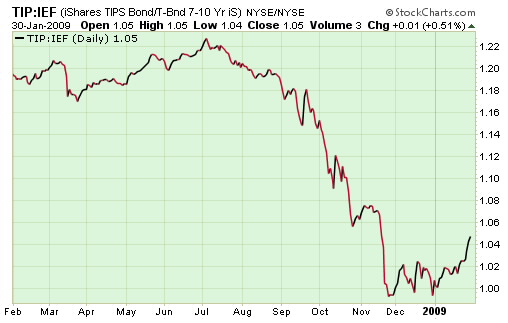
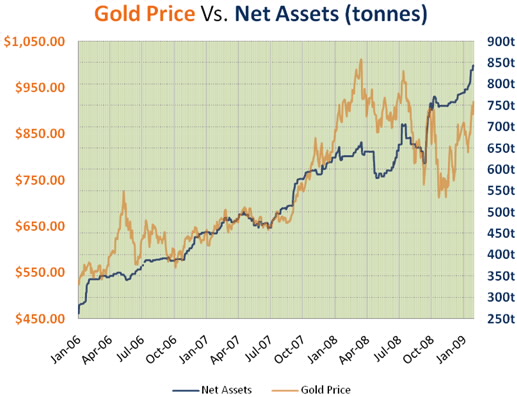
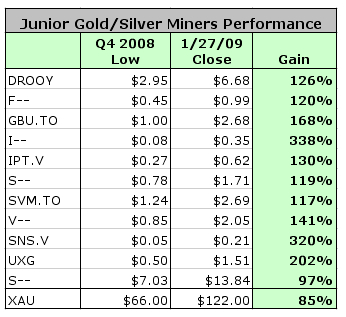
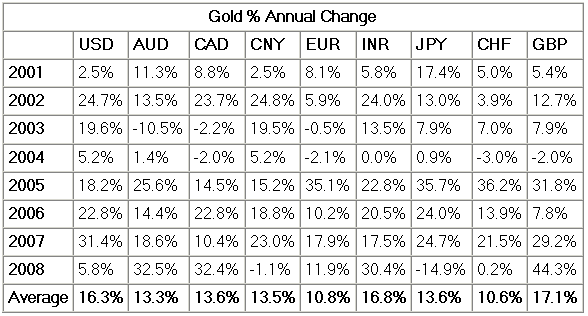
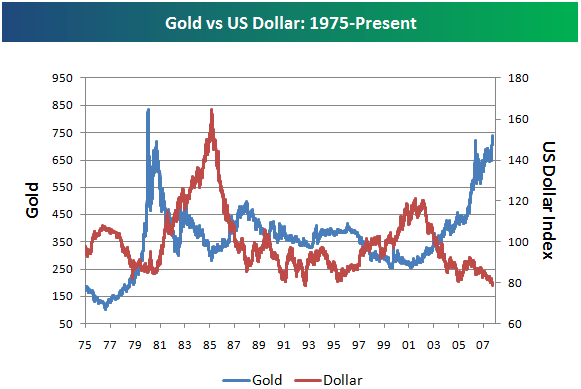
October. Still, investors can tap into non-financial bonds like IBM, Johnson & Johnson (JNJ), Wal-Mart (WMT) and Kraft Foods (KFT) – all paying 5.5% or more. Or, look at corporate bonds issued by America’s largest banks, including JPMorgan Chase (JPM), Goldman Sachs (GS), Wells Fargo (WFC) and US Bancorp (USB). These banks won’t default.

A good strategy to keep things simple is to buy a laddered portfolio of corporate bonds ranging from two years all the way to seven years. This should at least give your nest egg a boost and if you feel comfortable with this formula, then increase your position to say 35% of your portfolio. But remember, don’t go whole-hog; at some point over the next 12 months, perhaps later, Treasury bond prices will get smashed and long-term rates will head higher as the government expands credit to the moon. Keep your powder dry.

Question: Do you think we’ll avoid another Great Depression? Despite all the money thrown at the markets since late 2007 we’re still in the midst of a severe credit contraction and the global economy has literally fallen off a cliff since October.

Comment: I think we’ll avoid another Great Depression but only because government will nationalize or partially nationalize key industries. Without government intervention, the free market would have resulted in massive failures and a total collapse of the banking system and the broader global economy. There’s no doubt in my mind that the government made a big mistake not rescuing Lehman Brothers last September. Once you’re bailing out major banks, then do it right. But in all honesty, we don’t know what transpires behind the Fed’s walls or the Treasury’s. There’s some crazy buddy system in progress with special interests influencing government policy. The government doesn’t give a damn about you or me. What they care about is protecting their interests. That’s why we must protect our assets and, in the end, I believe gold will triumph above all paper money, especially against the dollar.

I don’t advocate government intervention; but these are not normal times and the consequences might have resulted in the death of capitalism and perhaps the emergence of a new social order, similar to what occurred in post-Weimar Germany in the 1920s. Harsh economic times usually result in a new socio-economic regime. If the Fed and Treasury fail to rescue the credit system, then we might face similar consequences. The world as we know it will come to an end.

It’s hard to know exactly what goes on behind the Federal Reserve’s closed doors and at the Treasury’s. Thus far, government efforts have been bold since the October crash, including major central banks worldwide. Major credit indicators have indeed improved since November but the housing market – the crux of the crisis – is still in a freefall. Housing must stabilize before this severe recession ends.

In my eyes, it seems that bailouts and backstops are not addressing the real problem; most TARP money is ending up in bank coffers again and, in most cases, these institutions aren’t lending. The core of this credit crisis lies with the consumer and with housing. If you’re going to fork out several trillion dollars to fix or remedy this crisis then give the money to the consumer – not the banks. The consumer is in a severe bear market with personal assets plummeting over the last 18 months, including real estate, stocks, most bonds and now, possibly his or her job might be next on the chopping block.

Give consumer households $50,000 or more and allow them to clean-up their busted balance sheets, keep their homes (service mortgages) and pay off installment debt. You might not agree with me and, in all fairness, it’s against the tenets of the Sovereign Individual; but what good will all this money do if it’s basically squandered by government and ending up in the pockets of reckless bankers again? I have serious doubts about how the government is dealing with this crisis and I don’t think Obama’s spending package will help much at all despite perhaps growing the economy for a few quarters.

Question: What about the banks? With governments now standing behind their biggest financial institutions, is the worst over?

Comment: The global banking system, for all intents and purposes, is effectively bust or bankrupt. This is especially the case in the United States, Europe and, to a lesser extent, in Japan. More than a dozen emerging market banks are totally bust, including Iceland, the Baltics, Hungary, Romania, Bolivia, Ukraine, Ecuador, Argentina, etc. Not a pretty picture.

I think we’re more than 75% through the worst at this juncture. Governments now stand behind the largest banks in each country and, in some cases, even guarantee entire deposits until 2010 (e.g. European Union). I wouldn’t worry about the largest banks failing at this point. The worst is now behind us.

Question: I know you’re a big gold bug, but isn’t the euro a strong currency and do you think it’s a better hedge against the dollar than gold? Is it too late to purchase gold coins and, if not, where would you suggest I buy coins?

Comment: I have absolutely zero faith in the U.S. dollar and other currencies, including the euro or yen. In the end, all currencies will decline vis-à-vis gold and, in fact, since 2005 the world’s currencies have been losing their relative value to gold bullion. Despite big moves by the yen and euro over the last several years, they pale against gold.

Increasingly, the average man in the street will realize that paper money is not protecting his purchasing power and will revolt against fiat money. At The Sovereign Society, we’ve driven home this message since our first year of publication in 1997. Gold is the only asset in this world that isn’t someone else’s liability; with U.S. interest rates effectively at 0%, paper money now competes with gold, which also pays 0% interest. In a zero percent world, which asset would you rather own? I think the answer is obvious.

The government’s enormous spending plans to rescue the financial system and bailout almost every ailing industry Gold Coin Imageassures dollar destruction because the Fed is now on course to print money like never before to quash deflation. We all better hope and prey that the Fed can drain excess bank liquidity very quickly when this credit crisis ends. If not, we’ll have some serious inflation – much worse than what we saw prior to July 2008.

I think every investor should hold at least 10% of his assets in physical gold. This means coins, wafers or bars. Getting gold coins today is difficult because the U.S. Mint has stopped selling Eagles since last summer while other dealers are complaining about tight supplies amid booming investor demand. I suggest KITCO or First Federal Coin Corporation.

Also, I would not hold or store all of my physical gold at my home domicile. I strongly suggest parking some of your gold in Switzerland, too. Remember, you must report assets outside of the United States and Canada.

I’m convinced we’ll see some sort of government confiscation of gold again just like we did in the 1930s. Back then, FDR did allow Americans to hold a maximum of 100 ounces. I’m not so sure the next confiscation will be so generous.

I hope you found this helpful.

===============================================

2009 Gold Outlook – Gold World

How To Invest in Gold in 2009

By Luke Burgess

The investment markets are yielding to the fact that the global economy will remain weak for the better part of 2009.

As a result, investors will continue to seek safe havens.

Under normal conditions, these safe haven investments would include land and real estate. These assets have intrinsic value; or in other words, their value will never fall to zero. But with falling prices, investing in real estate is out of the question for most people right now. And there’s little doubt that investors will look elsewhere for safety against financial crisis.

The best safe haven asset in the world right now is still gold because it is never considered to be a liability.

And we believe that safe haven investment demand will drive gold prices during 2009. With this in mind, we would like to present a broad overview of Gold World‘s 2009 gold outlook. But before we get into that, let’s review what happened to gold prices in 2008.

Gold Was One of the Best Investments of 2008

In March 2008, gold prices hit a record high of $1,033 an ounce as the gold bull market entered its seventh year of life. This was followed by a normal 18% correction, which drove gold prices back down to $850 an ounce.

Gold prices subsequently rebounded and were once again closing in on the $1,000 level in mid-July. At the same time, however, the fundamental and psychological effects of the slowing housing and credit markets were just beginning to devalue significantly the investment markets across the board.

As a result, many long gold positions had to be sold in order to cover losses from investments in other markets. Over the next several months, this forced selling pressure pushed gold prices down.

Gold prices were also held down during the second half of 2008 as the U.S. dollar enjoyed a +20% rally. Foreign governments, institutions, and banks began buying the U.S. dollar, which despite a legion of problems continues to be the world’s most important reserve currency, as a hedge against domestic economic turmoil.

20090105_2009_gold_outlook.png

These factors contributed to a significant drop in the price of gold, which officially bottomed out for the year at an intraday low of $683 an ounce in October 2008.

Gold prices have subsequently bounced off of the $700 level as major selling has dried up, and fresh buying has come into the market.

Despite three 20% corrections and serious deflation in the market, gold exited 2008 with a positive 5.4% gain for the year. Although subtle, this gain outperformed every major equity index and commodity in the world. Here are just a few examples…

Index/Commodity
Percent Change During 2008
Dow Jones
-34%
NASDAQ
-41%
S&P 500
-39%
TSX -35%
TSX Venture -74%
Oil
-55%
Silver
-23%
Copper
-54%
Gold
+5%

This made gold one of the best investments of 2008.

And the 2009 gold outlook looks just as strong.

Gold’s 2009 Outlook

Despite a bit of downside in the immediate future, we expect gold to have a stellar year.

Global economic turmoil and deflation will undoubtedly continue to influence gold prices in the near-term. A short-term pullback in gold prices from current levels to $800—maybe even a bit lower—is not out of the question. However, we expect gold prices to break new records during 2009.

For our current perspective, we expect gold prices to reach as high as $1,300 during 2009, which would be a profit of over 50% from current levels.

Gold prices in 2009 will be supported more heavily by supply/demand fundamentals than in the previous years of this gold bull market.

As we’ve previously discussed, during the third quarter of 2008, world gold demand outstripped supply by 10.5 million ounces. This deficit was worth $8.5 billion and was the largest supply/demand deficit since the gold bull market of the 1970s.

Official 4Q 2008 world gold supply/demand figures will be calculated and reported later this month. Gold World will report them to you when the data is released.

In the meantime, though, all estimates suggest that there will be another very large deficit in world gold supplies from the fourth-quarter, with investment demand continuing to drive the market.

We expect that a continuing surge in investment demand could push gold prices as high as $1,300 at one point during 2009.

There will likely be a bit more volatility in the gold market in 2009 as more and more speculators come into the market. It is likely that the gold market will experience three or four price peaks (selling points) during 2009.

How to Invest in Gold for 2009

As we expect a near-term drop in gold prices as a result of continuing deflation, we are advising our readers to hold off on any physical gold buying for the immediate future. As previously mentioned, gold prices could dip back down to $800 before recovering again.

Nevertheless, we expect 2009 to be another great year for gold investors.

Good Investing,

Luke Burgess and the Gold World Research Team
www.GoldWorld.com

=================================================

Gold World Special Report – Gold Backed Banking

Special Report – Here’s How To Get Your Own Copy – Simply Subscribe

January, 2009

Gold Backed Banking

It’s a wonder Americans aren’t rioting in the streets.

Not including the $700 billion blank check issued to the banks and signed by the US taxpayer, the sum of liabilities assumed by the US government from the finance industry in the past 6 months alone exceeds 50% of the GDP.

Despite this unprecedented government intervention, the solvency of other every commercial and investment bank is still at stake!

Recognize this all-but-forgotten quote?

“The central bank is an institution of the most deadly hostility existing against the Principles and form of our Constitution. I am an Enemy to all banks discounting bills or notes for anything but Coin. If the American People allow private banks to control the issuance of their currency, first by inflation and then by deflation, the banks and corporations that will grow up around them will deprive the People of all their Property until their Children will wake up homeless on the continent their Fathers conquered.”
— Thomas Jefferson, Founding Father, Third President of the United States, and the principal author of the US Declaration of Independence

How bout a drink from the cup of truth…

The Bush administration’s $700 billion bailout plan may keep some banks afloat for the time being. But fundamental problems are still deeply rooted within the financial markets that threaten to bring down the whole system.

The hard truth is that there is no 100% safe place to keep your money.

Physical cash and gold are the safest places to hold your wealth right now. Anyone who tells you otherwise has either a motive or no clue.

Those with the means to do so should be holding at least some physical cash and gold.

Of course, people will debate why you should hold these assets…

Gold is the ultimate in hedging against financial turmoil. But as it stands today, it’s quite rare to find someone willing to trade a product or service for gold. In other words, it’s difficult to spend gold like money, which has been a criticism of owning physical gold for decades.

Today’s digital age allows consumers to move electronic fiat money around at speeds exponentially faster than ever before. This morning I paid my cable bill with my check card. The entire transaction was completed within 5 minutes. Had I paid by mailing a check, it could have taken up 1-2 days to reach the cable company and 3-5 days to clear my account.

So what if there was a way gold could be used as easily as electronic money?

The World’s Only “100% Backed-by-Gold Bank”

You might have a hard time believing this, but you can actually put yourself on a personal gold standard with a new kind of currency, and it’s rapidly growing among gold bugs.

Understand first, this new currency is not legal tender issued by any government. That means there’s no debt, inflation, geopolitical turmoil, or any other considerations normally associated with government-issued currency.

The currency comes in electronic form, but can be used like any other currency in the world today to pay for goods and services, and even settle debt. But there’s one major difference that sets this currency apart from every other in the world:

It’s 100% backed by gold.

In fact, in most cases you can instantly exchange this currency for physical gold at any time… a feature taken away from the US dollar decades ago.

This currency has a new system fully established, making it as easy to use as the current banking industry’s electronic money. Right now, in fact, there are already over 3,000 outfits—and climbing—in which you can pay online using this currency.

How the “Gold Bank” Works

Customers transfer funds from traditional bank accounts into these unique gold-backed bank accounts, and earn interest on their funds prior to placing an order.

Meanwhile, for customers already holding gold and silver in secured (and insured) vaults, their metals are insured and held in specialized bullion vaults. Their metals assets go through an annual audit, and are fully reported to customers.

Once customers’ funds are in the database, customers’ orders are made through its secure online system. Database servers record all transactions and store currency and metal balances.

The Advantages of Using this Currency?

Being backed by gold, the purchasing power of this currency fluctuates in relation to the price of gold.

This means that as the price of gold increases, the purchasing power of the account increases. On the flip side, however, if the price of gold falls, so does the value of the account. Nonetheless, the risk of significant price fluctuation in gold is small compared to the risk of value fluctuations among fiat currencies, especially the US dollar.

And despite a short-term correction, the price of gold has increased significantly over the past five years. So this factor has worked out to the advantage of anyone holding this currency over that period. And with +$2,000 gold on the horizon, holders of this currency should do quite well in the future.

Now you should know that I’m in no way affiliated with this service, nor do I receive any compensation from it. That said…

I Recently Put the Final Touches on my New Research Report…

This report shares all the details about the new gold-backed electronic currency, and it’s yours free after you take a risk-free trial of the Mining Speculator service.

It’s your chance to get in on the biggest and best buying opportunity in junior gold and silver stocks… ever.

That’s right. The junior gold market is about to blast off, after a brutal beat-down sparked by the financial crisis. Truth is, it’s pushed many gold and silver stocks to new lows…

… Which is why you don’t want to wait a minute longer to position yourself in the Mining Speculator’s mining and precious metals portfolio. Our team of analysts scour the earth for opportunities in gold, as protection against the financial uncertainties engulfing the U.S. and world markets.

It’s the ultimate opportunity in a period of great crisis.

You see, as our government continues to lose control of its ability to manage and prop up markets, gold and silver will undoubtedly make meteoric moves that will stun the populace.

And just in case you still harbor doubts about gold, consider this… reported last week in the Financial Times…

“… Investors in gold are demanding ‘unprecedented’ amounts of bullion bars and coins and moving them into their own vaults as fears about the health of the global financial system deepen.”

And since gold bullion is getting harder and harder to come by, more investors are looking for the next best alternative, and that’s…

Precious Metals Mining Stocks

Bottom line: Junior mining stocks will begin to make major moves to the upside, rewarding those who got in early and held on… and those who get in now at what are, frankly, bargain share prices.

You see, nothing can keep gold from doubling up and hitting $2,000 an ounce… causing shares in our mining exploration companies to skyrocket.

I’m talking about junior mining stocks with the potential to double, triple—even quadruple!

Of course, many people have trouble accepting gold as an investment—even now that they’ve witnessed a financial upheaval that’s shaken our country by the shoulders.

But I also know that those who have heard me out-and followed through with my research and recommendations-have made extraordinary, life-altering returns.

Which is why I maintain…

There’s never been a better time-a more crucial time-to protect your portfolio with gold and precious metals.

And for a brief time, we’re making it easy to do just that… for as little as $25.

To get immediate inside access to the junior mining companies poised for major run-ups – the ones I’ve visited firsthand and carefully selected after exhaustive research and quality controls – simply take a trial of my Mining Speculator advisory.

When you sign up for Mining Speculator, I will immediately send you the free report on the new gold-backed currency mentioned in this editorial.

So, for only $25 you’ll begin to receive my Mining Speculator junior stock advisory… one that held an average 212% gain over five years… plus you’ll get our new special report on “The World’s Only 100% Backed-by-Gold Bank.”

All you have to do is click here to get started.

Good investing,

Greg McCoach, Investment Director, Mining Speculator
Luke Burgess, Editor, Gold World

====================================================

My Note: I do not receive any renumeration or commissions for recommending either the Gold backed banking or the Mining Speculator. As Always be sure to do your own due diligence and read the prospectus before making any investments or deposits into financial institutions.-jschulmansr

Share this:

  • Click to share on Reddit (Opens in new window) Reddit
  • Click to share on Facebook (Opens in new window) Facebook
  • Click to share on LinkedIn (Opens in new window) LinkedIn
  • More
  • Click to share on X (Opens in new window) X
  • Click to share on Pinterest (Opens in new window) Pinterest
  • Click to share on Tumblr (Opens in new window) Tumblr
  • Click to print (Opens in new window) Print
  • Click to email a link to a friend (Opens in new window) Email
Like Loading...

A Lesson In Geo-Political Energy + Gold News

05 Monday Jan 2009

Posted by jschulmansr in Bollinger Bands, capitalism, commodities, Copper, Currency and Currencies, deflation, diamonds, Finance, Fundamental Analysis, gold, hard assets, How To Invest, How To Make Money, inflation, Investing, investments, Latest News, Make Money Investing, Markets, mining stocks, Moving Averages, oil, Politics, precious metals, silver, small caps, Stocks, Technical Analysis, Today, U.S. Dollar

≈ 1 Comment

Tags

agricultural commodities, alternate energy, Austrian school, banking crisis, banks, bear market, Bollinger Bands, bull market, capitalism, central banks, China, Comex, commodities, communism, Copper, Currencies, currency, deflation, depression, diamonds, dollar denominated, dollar denominated investments, economic, economic trends, economy, financial, Forex, futures, futures markets, gold, gold miners, hard assets, heating oil, India, inflation, investments, Keith Fitz-Gerald, market crash, Markets, mining companies, Moving Averages, natural gas, oil, palladium, Peter Schiff, physical gold, platinum, platinum miners, precious metals, price, price manipulation, prices, producers, production, protection, rare earth metals, recession, risk, run on banks, safety, Saudi Arabia, silver, silver miners, socialism, sovereign, spot, spot price, stagflation, Technical Analysis, timber, U.S. Dollar, volatility, warrants, Water

My Note- Today I present an interesting article about the Geo-Political ramifications of the Battle for the Caspian Seas, plus some of the latest Gold News. Gold today is making a much needed correction in prices, if Gold can hold here and/or we have any increase in tensions of the Middle East; I think the next leg will take prices into the $900-$950 range.- jschulmansr

Geopolitical Energy Centered on the Caspian Sea – Seeking Alpha

By: Michael Fitzsimmons of Musings From the Fitzman

I’ve just finished reading a fascinating book authored by Lutz Kleveman entitled The New Great Game. The book is about Kleveman’s visits to all countries surrounding the Caspian Sea and to the countries involved in actual and proposed oil and gas pipeline routes required to bring Caspian Sea energy assets to the world market. He interviews an amazing cast of intriguing characters along the way.

The investigative journalist delves deeply into the geopolitical implications of world powers struggling to control Caspian Sea energy reserves – some of the largest remaining oil and gas fields in the world. It is fitting the game of chess was invented by the Persians. It is worth purchasing The New Great Game just to gaze at the maps on the inside and backside covers…each central Asian country being ruled by a government or dictator who one minute moves diagonally like a bishop, only years later to morph into a rook and move horizontally and vertically like a knight, and every once in awhile going hay-wire and imitating the unorthodox movement of a knight. Who will win the great game? What will OPEC’s response be to non-OPEC oil production in the Caspian Sea region? How will China and Russia respond to American military might in the region? Only time will tell.

The map below shows the countries surrounding the Caspian Sea which are Russia, Kazakhstan, Turkmenistan, Iran, and Azerbaijan.

Most people are fairly familiar with the oil history of Baku, Azerbaijan dating back to Russian oil discovery and production in the early 1870s. Kleveman relates an interesting story of Swede Robert Nobel who was the older brother of factory owners Ludwig and Alfred Nobel who had become very wealthy producing arms and dynamite. Robert had been sent to Baku with 25,000 rubles to purchase Russian walnut to make rifle butts. Instead, he caught Baku oil fever and bought a small refinery. After only a few years, the Nobel Brothers Petroleum Producing Company vaulted over Rockefeller’s Standard Oil as the largest oil producer in the world. Later, the Nobel’s invented the first oil tanker in a story well told in Daniel Yergin’s The Prize, for which, ironically, Yergin won the Nobel Prize for non-fiction literature in 1992. And yes, the prize is named after the same Nobel family as those men seeking walnut wood for rifle butts in Azerbaijan.

Fast forward to today: Baku Azeri oil is being shipped to the Mediterranean Sea and world markets via the so-called BTC (Baku-Tbilisi-Ceyhan) pipeline. The picture below shows the pipeline’s route from Baku, Azerbaijan through Tbilisi Georgia, and finally to the Mediterranean Turkish port of Ceyhan.

This pipeline was hailed as the “Contract of the Century” by Azeri officials very much interested in getting their oil to market independent of Iranian and Russian involvement. Of course, the US was more than mildly interested in this solution as well. The pipeline is owned by a consortium of energy companies, among them:

  • British Petroleum (BP): 30.1%
  • State Oil Company of Azerbaijan (SOCAR): 25%
  • Chevron (CVX): 8.9%
  • StatOil (STO): 8.71%
  • ConocoPhillips (COP): 2.5%

BP is the BTC pipeline operator.

The big question in today’s energy riddle is how to route the large energy assets of the Caspian Sea to the world market and thereby offer America an alternative to OPEC supplies. Take the giant Tengiz oil field, discovered of the coast of Kazakhstan, as an example. Estimated at up to 24 billion barrels of oil Tengiz is the sixth largest oil field in the world. It is one of the largest oil discoveries in recent history. The Tengizchevroil (TCO) joint venture has developed the field since the early 1990’s. The partners are:

  • Chevron: 50%
  • ExxonMobil (XOM): 25%
  • KazMunayGas (Kazakhstan): 20%
  • LukArco (Russia): 5%

Chevron has predicted that Tengiz could potentially produce up to 700,000 barrels of oil per day by 2010. The field also contains large reserves of natural gas. On the downside, the oil is very high in sulfur content, once reason western technology was so desperately required. Currently the oil from the Tengiz field is piped from Kazakhstan through Russia to the Russian Black Sea port of Novorossiysk via the CPC (Caspian Pipeline Consortium). The BTC pipeline is a competing option, preferred by the US to bypass Russia, but is expensive: the oil must first be tanked across the Caspian Sea from Tengiz to Baku, and then offloaded into the BTC pipeline infrastructure. French energy giant Total is interested in developing a common sense alternative pipeline through Iran which everyone knows is obviously the most economically viable solution, withstanding the geopolitical climate in Iran. Of course the US does not favor this route at all.

The US’s long favored route for Caspian Sea energy was first suggested and studied by Unocal (now part of Chevron). This countries involved in this route are highlighted in color in the picture below.

This so-called Central Asian pipeline was to begin with a natural gas pipeline from huge Turkmenistan gas fields through western Afghanistan to the Pakistani deep water port of Gwadar on the Gulf of Oman (Indian Ocean). The natural gas pipeline was to be followed by an oil pipeline along the same route, serving not only the energy starved countries of Pakistan and India, but the world energy markets as well. The US believes this route, bypassing Russia and Iran, as well as the congested Straits of Hormuz, is in the strategic interest of the US as a secure non-OPEC source of oil.

But the key word in the last sentence was “secure”. Unilateral policy decisions by the US in Iraq and elsewhere have instigated a tide of central Asian anti-American resentment. The Taliban, once supported and funded by the US, are now in control of the pipeline’s route. The pipeline project has been delayed until “control” and “security” has been established. Anti-American opposition in Pakistan is also a problem, regardless of that countries dire need for the energy and potential income the pipeline could deliver.

The US’s oil centric foreign policy agenda is apparently to irritate the two major powers in the Caspian Sea region: Russia and Iran. With the USSR’s disintegration in 1991, all the former Soviet states in the region were being eyed for their energy reserves. At the same time, Russia still considers these former states as within their “sphere of influence”.

Instead of joining with the Russians in mutually beneficial energy projects, technology transfers, and contracts, the US instead decided to take the opposite approach: it first propped up a government in Georgia irritating the Russians. Then the US supported NATO membership for former USSR countries Ukraine and Georgia. The US also proposed missile defense systems on Russia’s western borders, further infuriating the Russians. Russia finally had enough and acted in Georgia as George Bush was attending the Olympics in China. Russian actions put exclamation points on the obvious – it can take out the BTC pipeline any time it wants, and is resentful of American military meddling in its backyard.

The prior secret agreements between Putin and Bush to fight the mutual “terrorists” foes appear to be in the distant past. Recent activities involving Russian natural gas transports through Ukraine underscore the vulnerability of Europe’s energy supplies. Europe currently imports some 40% of its natural gas from Russia, and this amount is bound to increase in the future. This further complicates the puzzle by placing US actions at odds with supposed allies in Europe.

With respect to Iran, the US has military forces in Iraq, Afghanistan, Uzbekistan, Kyrgyzstan and elsewhere in the region – completely surrounding Iran. The US has further tried to isolate Iran (to the dismay of the Europeans who vitally need Iranian energy) by imposing economic sanctions on the country. Iran was one of three countries with distinguished membership in George Bush’s “Axis of Evil”. These US actions have left the Iranians no choice but to develop nuclear weapons in order to protect themselves against the same kind of American aggression they have witnessed elsewhere in the region.

Meantime, flawed US/Israeli policy, combined with Israel’s recent activities in the Gaza strip and the powerful Jewish lobbying efforts in the US for military action in Iran, seem to increase the odds for more conflict in the region.

Have US foreign policy moves in Central Asia been successful? Yes and no.

One bright spot is Iraq. Iraq was always the priority in “the war on terror”, not because the terrorists were there (they are now…) but because Iraq holds the world’s second largest oil reserves after Saudi Arabia. Many of Iraq’s oil fields also have the important advantages of being sweet crude (high quality), are shallow, and are under pressure, making Iraqi production costs very low – in the neighborhood of $10/barrel. For those who actually believe the US government’s marketing job of WMDs, “freedom”, etc. as a pretext for invading Iraq, please note the recent announced that Iraq’s oil resources are now “open for business” and up for bidding. Western oil companies such as BP, ExxonMobil, Chevron, and Royal Dutch Shell (RDS.A) stand to benefit handsomely in Iraq while at the same time boosting the country’s oil production by some 2-3 million barrels over the new few year. So, Iraq can be considered a US success story assuming security is maintained and the oil can reach the market. A big if, but time will tell.

The BTC can also be considered a success. It has operated fairly reliably, and has shown to be a fairly secure source of Caspian Sea oil. This was a huge project, and many people in the oil business doubted its success and completion. But it’s up and running today and survived Russia’s recent invasion of Georgia. That said, the BTC’s continued success is extremely dependent on maintaining security in the area.

Now it’s time to head to Afghanistan and take care of business over there. Boy-oh-boy is that going to be one tough nut to crack. The Afghan/Pakistani issue is so deep I can’t even begin to cover it in enough detail to do the subject justice. Those who believe the US motives in Afghanistan are simply “terrorism” or “freedom” should take note that the US fully supported and funded the Taliban when it was decided they were the best option with respect to getting the Central Asian pipeline built. Unocal sponsored the Taliban on trips to Houston to stay at 5-star hotels and visits to NASA. It was only later when the Taliban wouldn’t “play ball” that the US stopped their support and labeled the Taliban terrorists. Even the US installed Afghani President Hamid Karzai worked as an advisor and consultant to Unocal during the initial Central Asian pipeline feasibility studies.

So, US policies have had some successes in the region as far as oil is concerned. From a humanitarian aspect, well, I’ll leave that up to the reader to figure out on his or her own. From an economic standpoint, one would have to make a detailed analysis of military spending versus the economic benefits in order to come to any conclusions. Perhaps I will write an article on this some day, but for now, I’ll sidestep that question as well.

For the US, I am not such an idealist to think for one minute the symbiotic “Pentagon-Petroleum” relationship will change anytime soon. Further, as a realist, I also understand how important the game being played in Central Asia is. I am aware of the actions the US and other world powers are taking in Central Asia in order to acquire the energy reserves they need to power their economies. My eyes are wide open.

What I continue to struggle with is why the US directs so many resources and dollars toward these overseas strategies while at the same time almost completely ignoring what steps could be taken to reduce our foreign oil requirements by adopting some fairly simple and obvious policy changes. It, quite simply baffles me. Even a cock-sure trader hedges his bets now and again. The most amateur investor knows some diversification is prudent. So, why does the US continue oil centric policies which are certain to lead to more conflict, more debt, more trade deficits, and a weaker economy and currency?

Most readers are very familiar with my proposed energy policy, but I will add the link yet again in the hopes that someday, someone out there with a bit of power and influence will read it and make it happen.

So what does all this have to do with investing you ask? In a word: everything. Where can US investors put their money these days? Financials? Consumer cyclicals? Auto makers? I think not. Despite current low oil prices, the recent strength in the US dollar, and the subject matter of this article, I continue to believe the best opportunity for US investors is to participate in energy companies and to buy gold. Now, I know that some of you who read my articles earlier in the year and went out and bought my recommended stocks got a hurt, and hurt bad, right along with me and everyone else. I’m truly sorry, and feel bad if my advice caused you any pain (at least realize I felt the pain as well!). That said, let’s look at the 2008 returns for some of my picks:

  • British Petroleum (BP): -36.1%
  • Chevron (CVX): -20.7%
  • ConocoPhillips (COP): -41.3%
  • ExxonMobil (XOM): -14.8%
  • Schlumberger (SLB): -57%

Not awfully bad, considering these returns (from this weekend’s WSJ) do not include the nice dividends some of these companies’ payout and the S&P500 was down 38.5% in 2008, its worst year since 1931. At the same time gold held up rather well, gaining 7% in the course of the year.

The bad news was some of my theme picks didn’t do well at all. Energy services, which at one point in 2008 were my “number one investment pick”, simply got hammered. Likewise, my advice to get into strategic metals via Vanguard Precious Metals (VGPMX) was a disaster as the stocks in this fund were sold off big time during the great leverage unwinding.

Making matters worse was the huge distribution VGPMX made at the end of the year which just infuriated me. I actually called Vanguard and asked them how a fund which lost over 60% for the year could possibly justify making a year end taxable distribution that equaled roughly 12% of the fund’s entire NAV?! I mean, if you sold enough to make such huge gains, why the hell is the fund down 60%? If you didn’t sell, and watched the stocks go down, why not sell the losers so that the losers and gainers cancel each other out so that no taxable distribution takes place? I was told I simply “didn’t understand”. They were right, I don’t! Seems to me even a moron could manage a fund better than that. The loss in the fund’s NAV I can understand. The huge year end distribution is simply inexcusable.

What I learned during the year is this: if a person wants to invest in precious metals, buy gold, take personal delivery of it, and bury it in the backyard and forget about it. Sure, people flock to the US dollar in times of crisis, but did anyone see the action in US treasuries last Thursday and Friday, as well as the headline in Barron’s this weekend? The financial mismanagement by the US government, Treasury, and Federal Reserve combined with the lack of a strategic long-term comprehensive energy policy must lead to a long-term weakening of the US currency. So, buy oil, buy gold. When inflation comes back, it will come back very quickly and these hard assets will once again take off like a rocket. I mean, how can the economy not re-inflate with the Federal Reserve printing US dollars as fast as the presses will print them?

My picks for 2009 are as follows: XOM, BP, CVX, COP, SLB and gold bullion, in particular American Eagles and Canadian Maple Leafs.

Goodbye 2008! Indeed, very soon we will be saying goodbye to George W. Bush as well. Let’s all hope that 2009 will be better than 2008. It won’t take much! Let’s also hope that the new administration hedges its foreign policies bets with a bet on the American people and what we can do at home by enacting a strategic long-term comprehensive energy policy. In the meantime, buy Kleveman’s book The New Great Game, enjoy, and learn. The last paragraph of the book sums up my feelings perfectly.

========================================

Get The Book: The New Great Game – by: Lutz Kleveman

========================================

Gold Due for a Pullback; Silver Approaching Resistance- Seeking Alpha

By: Jeff Pierce of Zen Trader

I like gold here as an investment going forward- I just liked it a whole lot better a few weeks ago. I think we at the top of this wedge formation and due for a pullback and the RSI could come back to the previous high around 50. That would be very constructive and bullish allowing this metal to bust through 900 on its next run. While I don’t have a specific price target for where I think it will correct to, the 20-day moving average seems like a reasonable guess.

Obviously if tensions heat up in the Middle East this could fuel another rise in gold and all bets are off. However I’ve learned in the past not to underestimate gold’s ability to correct quickly so I took my profits on Friday and will enter on a pullback. I wanted to be flat going into next week as anything can happen when all the fund managers get back from vacation.

gold

Silver has been up 6 straight days and is fast approaching resistance. I would rather it pause here and gather some strength to possibly break through the 11.75 area instead of shooting straight up using up all it’s firepower. Use any further strength to unload positions and wait for a pullback to add or establish new positions.

slv

=============================================

Profiting From Bernanke’s Super-Fed and Obama’s Newer Deal – Seeking Alpha

By: Naufal Sanaullah of The Gotham Fund and Dorm Room Derivatives

The historic wealth destruction of 2008 was obviously deflationary. Defaults strip away wealth. Institutions respond by selling assets to raise capital. Widespread deleveraging leads to supply expansion in assets and contraction in money and credit (i.e. deflation).

Nevertheless, the response has been unprecedented in its own merit. Government debt held by the public was $5.51 trillion when September began; by the end of 2008, it had risen to $6.37 trillion. The more than $1 trillion expansion in Treasury borrowing surely partially serves to offset the $438 billion budget deficit. But what about the additional half a trillion dollars?

On September 17, the Treasury announced the creation of the the “Supplementary Financing Account” in the Federal Reserve. This is a capital reserve in Fed financed by the Treasury selling new debt and it greatly expands the Federal Reserve’s balance sheet, albeit stealthily. The excess capital is trapped in this Fed account and does not reach currency in circulation. As of January 2, $259 billion is in this Treasury-financed cash pool and counting the Treasury’s “General Account” with the Fed, there is a total of $365 billion sitting at the Fed. The capital itself is money borrowed by the public, so its immediate net effect is deflationary.

On top of that, the Fed in an unprecedented gesture has started incentivizing excess bank reserve deposits by issuing interest on these holdings. Rather than being lent out, liquidity provided to banks by the Fed is thus trapped as it earns interest deposited at the Fed. The Fed is essentially issuing debt, and banks are engaging in what amounts to be a dollar-based Fed vs. interbank carry trade. Banks borrow money from the Fed, deposit them back into the Fed (use borrowed dollars to purchase Fed debt), and profit from the differential between the fed funds and overnight rates (profit off of the difference between the interest rates offered by Federal Reserve and other banks).

Less than $40 billion a year ago, the excess reserve deposits held by the Federal Reserve has ballooned to $860 billion. The banks can also deposit printed money into a Fed category called “Deposits with Federal Reserve Banks, other than reserve balances,” which is what the Supplementary Financing and General Accounts also fall under.

The “Other” subsection of these deposit accounts, which can be construed to represent bank deposits, has increased from $281 million in September to $15 billion today. Both the reserve and non-reserve deposits comprise another huge pool of excess liquidity on the Fed’s balance sheet that doesn’t immediately affect circulated currency.

Another Fed-induced cash trap has been in the form of increased reverse repurchase agreements, which are up to $88 billion. Reverse repurchase agreements are the offering of collateral in exchange for a cash loan. The Fed has utilized reverse repurchase agreements in its liquification of banks. It buys off toxic defaulting assets in exchange for cash and immediately reclaims the cash by selling the banks T-bills. The Fed printed money to pay for these T-bills, so there is excess liquidity that is trapped in time-sensitive debt. But why would the Fed be taking liquidity away from the system?

The Fed’s balance sheet suggests it has been cranking the printing presses like mad. Fed liabilities have expanded to $2.26 trillion, up over 140% since September. However, currency in circulation is up only 7% in that same time period. Where is this “trapped” $1.37 trillion? The answer is the Fed has confined it into temporary cash pools, whether in the Supplementary Financing Account or excess reserve deposits or in time-sensitive T-bills. The Federal Reserve seems to be sequestering all of this cash to buy time for the Treasury to finish its funding activities. What is scary is this wave of future bailout funding is probably not even close to what will be needed for Obama’s infrastructure and stimulus spending, which will be comparable only to FDR’s and will be liquidity injected directly into the economy.

But who is going to keep funding this expansion Treasury debt issuance? The American public is broke and cannot offer its capital in return for terrible yields. Foreign nations don’t have the means or will to continue financing our debt. Commodity prices have collapsed, cutting deeply into foreigners’ export revenues. Oil is down from highs around $150/barrel this past summer to around $40/barrel now.

According to the CIA World Factbook, China has a $6 billion budget surplus. However, it announced a $585 billion economic stimulus package in early November to be invested by the end of 2010. The Chinese government agreed to provide only $170 billion of the the funds, in an effort to prevent an unreconcilable deficit. How will China raise the other $415 billion for continuous use until the end of 2010? Surely, local governments and private banks and businesses can’t finance such a large package in the midst of a historic recession.

The only reserve China can tap into to finance its stimulus package is its $1.9 trillion foreign exchange reserves, $585 billion of which is in US Treasury securities. Also, according to the Guangzhou Daily, in mid November, the People’s Bank of China began an effort to increase its gold reserves from 600 tons to 4500 tons to diversify risk held by its huge dollar debt reserves. Financing its stimulus package and gold purchases would require selling Treasury securities, but becoming a net seller of US debt could have disastrous economic, political, and even militaristic consequences for China, so it will be interesting to see how events unfold. What seems for certain, however, is that China can no longer purchase more American debt to finance the US Treasury (and consequently the Fed).

This is a problem echoed by the rest of the big creditor nations. After China, the biggest holders of American debt securities are Japan, the UK, Caribbean banking centers, and OPEC nations. Japan is facing enormous headwinds as its quality-focused exports are suffering massive demand destruction as its consumers abroad lose wealth at epic proportions in the economic crisis. Japan was a net seller of US Treasuries in 2008 and with the current wealth destruction, it is highly unlikely it will switch to a net buyer of American debt. The British demand for American debt represented Middle Eastern oil-financed investment, but with oil prices collapsing, it will be next to impossible for this proxy demand from the UK to rise and finance additional debt.

The demand for US debt by Caribbean banking centers is because of their tax laws and because of the dollar’s status as the international reserve currency. As the credit crunch leads to liquidity destruction in Caribbean banks and the dollar slowly loses its reserve status, these tax haven banking centers will no longer be able to buy additional US debt. OPEC nations’ US debt demand, similar to the UK’s, is tied to Middle Eastern oil revenues financing American consumption (of their oil exports). As oil prices tank, as will OPEC nations’ economies and they too will have no wealth to buy up more American debt.

Bernie Madoff is well-recognized as the biggest Ponzi scheme in history, at $50 billion. I beg to differ with that claim. The United States has financed debt with debt since the late 80s, when its external debt/GDP broke the 0 mark. Since then, it has risen to over 100% of its GDP (which in itself is quite artificially inflated because of manipulated hedonics-adjusted inflation figures), and now stands at $13 trillion. That is what’s called a debt bubble. Bernie who?

But the debt bubble appears ready to collapse. The literal pyramid scheme is finally running out of investors, and many Treasury ETFs (like SHY, TLT, IEF, and IEI) are showing classic parabolic topping patterns and the next few weeks should confirm or deny my suspicions. Interest rates are at an obvious floor at zero, so there is nowhere to go but up. That means bond prices have nowhere to go but down, and the way bubbles burst, the falling prices will cascade into more selling until the debt bubble deflates and all the spending is financed by quantitative easing. The minute the Treasury finishes its current funding activity, the debt bubble will begin its collapse. Judging by gold backwardation (discussed later) and the bearish charts on the bubbly debt ETFs, I think the debt monetization and dollar devaluation will begin within the next six weeks.

With an insolvent public and no foreign demand for Treasuries, the Federal Reserve will monetize debt to finance its continued bailouts and economic stimulus. This is purely created capital pumped right into the system. This is not anything new for the Fed– for the past two decades, it has kept interest rates artificially low and created massive artificial wealth in the form of malinvestment and debt-financing. In the past, the Fed has been able to funnel the inflationary effects of its expansionary monetary policy into equity values with its low rates, which discourage saving, causing bubble after bubble, in the form of techs, real estate, and commodities. The excess liquidity (the artificial capital lent and spent because of low interest rates and debt financing) was soaked up by the stock market, which gave the appearance of economic growth and production. With inflation being funneled into equity and real estate over the last two decades, illusionary wealth was created and the public remained oblivious to the inflationary risk and the much lower real returns than nominal.

Now that the “artificial wealth bubble” being inflated for the past two decades is finally collapsing, one of two scenarios can occur: capital destruction or purchasing power destruction. Capital destruction occurs when the monetary supply decreases as individuals and institutions sell assets to pay off debts and defaults and savings starts growing at the expense of consumption. This is deflation and the public immediately sees and feels its effect, as checking accounts, equity funds, and wages start declining. Deflation serves no benefit to the Federal Reserve, as declining prices spur positive-feedback panic selling and bank runs, and debt repayments in nominal terms under deflation cause real losses.

Purchasing power destruction is much more desirable by the Fed. Its effects are “hidden” to a certain extent, as the public doesn’t see any nominal losses and only feels wealth destruction in unmanageable price inflation. It breeds perceptions of illusionary strength rather than deflation’s exaggerated weakness. The typical taxpayer will panic when his or her mutual fund goes down 20% but will probably not react to an expansion of monetary supply unless it reaches 1970s price inflationary levels. In addition, the government can pay back its public debt with devalued nominal dollars, which transfers wealth from the taxpayers to the government to pay its debt. Inflation is essentially a regressive consumption tax, which the government wants and the Fed attempts to “hide”. Not only is the Treasury’s debt burden reduced, but the government’s tax revenues inherently increase.

The Fed, in an effort to minimize inflationary perception, has for the last two decades supported naked COMEX gold shorts to keep gold prices artificially low. The Fed, as well as European central banks, unconditionally supported these naked shorts to deflate prices and stave off inflationary perception, as gold prices stay artificially low. This caused gold shorts to be “guaranteed” eventual profit, by Western central banks offering huge artificial supply whenever necessary, causing long positions in gold to be wiped out by margin calls and losses.

Now that the economy is contracting, the Fed won’t be able to funnel the excess liquidity into equities or other similar assets. It also can’t allow the excess liquidity of today, which is different in both its size (already $1.37 trillion) and nature (it is printed “counterfeit” money and not malinvested leveraged and debt-financed capital), to be directly injected into the economy. That would prove to be immediately very inflationary, as more than three times the money is chasing the same amount of goods, technically leading to 300% price inflation. These figures are strictly based on monetization of the Fed’s current liabilities, not including any future deficit spending (which is sure to dramatically increase, especially with Barack Obama’s policies), the American external debt, or unfunded social programs that need payment as Baby Boomers retire.

In order to funnel the excess liquidity into a less harmful asset, the Fed appears to be abandoning its support for gold naked shorts, causing shorts to suffer their own margin calls and cause rapid price expansion in gold. On December 2, for the first time in history, gold reached backwardation. Gold is not an asset that is consumed but rather it is stored, so it is traditionally in what is called a contango market. Contango means the price for future delivery is higher than the spot price (which is for immediate settlement). This is sensible because gold has a carrying cost, in the form of storage, insurance, and financing, which is reflected in the time premium for its futures. Backwardation is the opposite of contango, representing a situation in which the spot price is higher than the price for future delivery.

On December 2, COMEX spot prices for gold were 1.99% higher than December gold futures, which are for December 31 delivery. This is highly unusual and it provides strong evidence to the theory that the Fed is abandoning its support for gold shorts. Backwardation represents a perceived lack of supply (in this case, the artificial supply the Fed would always issue at strategic times no longer existed), causing investors to pay a premium for guaranteed delivery. On May 21, when crude oil futures reached contango, I started waiting patiently for the charts to offer a short sell trigger because the contango represented a supply glut relative to perception and current pricing. Oil was priced at $133/barrel at that time and six weeks later, on July 11, oil topped at $147, and six days later crude broke its 50DMA on volume and triggered a large bearish position against commodities that resulted in some of my most profitable trades last year.

I consider gold’s backwardation as a similar leading indicator to the opposite effect—a dramatic increase in prices. Crude began its most recent backwardation in August 2007 at around $75/barrel and increased dramatically over the next nine months to $133/barrel at contango levels. Backwardation, especially in the case of gold prices, reflects a lack of supply at current prices and is very bullish.

But why would the Fed abandon its support for naked COMEX shorts? What makes gold such a desirable asset to attempt to direct excess liquidity into? The unique nature of gold and precious metals provides its desirability in this Fed operation. Gold has little utility outside of store of value, unlike most commodities (like oil, which is consumed as quickly as it’s extracted and refined), so its supply/demand schedule has unusual traits. Most commodities and assets go down in price as the public loses capital, because the public has less to consume with and that is reflected in demand destruction that leads to price deflation. Gold is not directly consumed and its industrial use and consumer demand (jewelry) is at a lower ratio to its financial/investment demand than almost any other asset in the world.

As a result, gold is relatively “recession-proof,” as evidenced by its relative strength in 2008. Gold prices rose 1.7% last year, which is quite spectacular considering equity values went down 39.3%, real estate values went down 21.8%, and commodity prices went down 45.0% in the same period (as determined by the S&P 500, Case-Shiller Composite, and S&P Goldman Sachs Commodity Indices, respectively). Because gold is not easily influenced by consumer spending, highly inflationary gold prices don’t do any direct damage to the public and are a good way to funnel excess liquidity without economic destruction.

Federal Reserve Chairman Ben Bernanke is a staunch proponent of dollar devaluation against gold and is very supportive of President Franklin D. Roosevelt’s decision to do so in 1934. In the past, manipulating gold prices to artificially low levels was beneficial because it prevented capital flight into a non-productive asset like gold and kept production, investment, and consumption high (even if it were malinvestment and unfunded consumption).

Bernanke’s continued active support of gold price suppression would lead to widespread deflation that would collapse equity values and cause pervasive insolvencies and bankruptcies. Insolvency in insurers removes all emergency “backups” to irresponsible lending and spending, which would surely ruin the economy. Bernanke’s plan seems to be to devalue the dollar against gold with huge monetary expansion, causing equity values to rise and economic stabilization. I’ve heard estimates of 7500 and 8000 in the Dow Jones Industrial Average as being minimum support levels that would cause insurers and banks to realize massive losses, causing widespread insolvencies in them and other weak sectors like commercial real estate that would irreversibly collapse the economy.

This gold price expansion, set off by the massive short squeeze, will continue until gold prices reflect gold supply and Federal Reserve liabilities in circulation. The “intrinsic” value of gold today (called the Shadow Gold Price), calculated dividing total Fed liabilities by official gold holdings, is about $9600/oz, compared to around $865/oz today. This gold price calculation essentially assumes dollar-gold convertibility, as is mandated by the US Constitution and was utilized at various periods of American history. The near-term price expansion in gold, mainly led by abandonment of gold shorts and the first traces of inflationary risk, should show $2000/oz by the end of this year. As the leveraged deals from the pre-crash credit craze mature, with the majority of them maturing in 2011-2014, there will be more monetary expansion for debt repayment, which will structurally weaken the US Dollar (which is inherently bullish for gold) and will also provide new excess liquidity to be funneled into precious metals. This leads me to believe gold will be worth $10,000/oz by 2012.

The US Dollar’s strength as the equity and commodity markets collapsed was due to deleveraging and an effect of the Fed’s temporary sequestration of dollars, taking dollars out of supply. That is over. Oil seems to be putting in a bottom on strong volume, no one is left to buy any more negative real yield securities the Treasury is issuing, and gold has started looking very bullish.

But a good speculator always considers all situations. Even if deflation is to occur, which I see as next to impossible, gold prices should still rise to $1500/oz levels next year, because it has shown relative strength as one of the most viable assets left to invest in. In addition, the short squeeze occurring in gold will provide substantial technical price expansion, even in the absence of dollar devaluation. Because of this, I suggest gold as an investment cornerstone for the foreseeable future.

I see the market breaking down from these levels to about the November lows, starting on Monday. Commercial real estate stocks like Simon Property Group (SPG), Vornado Realty Trust (VNO), and Boston Property Group (BXP) should lead the down move, as well as insurers like Allstate (ALL), Prudential (PRU), and Hartford (HIG), banks like Goldman Sachs (GS) and Morgan Stanley (MS), and retailers like Sears Holdings (SHLD). I recommend short positions (including leveraged bearish ETFs like SRS and FAZ) and buying puts against these stocks for the very near term. If the market indeed breaks down but shows bouncing/strength around 7500-8000 in the Dow Jones, that would confirm to me that the Fed is able and willing to inflate its way out of this crisis and I will sell my bearish positions and buy into bullish gold positions.

Because in inflation the dollar is devalued, I am a proponent of owning bullion and avoiding gold ETFs, but I do believe gold and gold miner stocks will provide great returns over the next few years. Royal Gold (RGLD), Iamgold (IAG), Jaguar Mining (JAG), Anglogold Ashanti (AU), Newmont Mining (NEM), Randgold (GOLD), Goldcorp (GG), and Barricks (ABX) are among my favorite gold equities at this early stage in the process. Their charts are all quite bullish and look to see much more upside. I believe gold will pullback for a few weeks as the market continues lower and deleveraging occurs, but like I said, I don’t believe the Fed will allow the markets to breach its November lows. If indeed deflation wins out and the Fed can’t prevent equity value collapse, I will just hold on to my aforementioned bearish positions and trade in particularly those securities for the foreseeable future, and I suggest you to do the same.

Literally the only thing that I find suspicious in all of this is the fact that I see so many inflationists out there and I even see commercials on TV about precious metals. I usually like to stay contrarian to the public, which I consider irrational and wholly incompetent. But this enormous debt and monetary expansion is a structural problem that common sense may provide better insight for than the most complex of models and theories.

I leave you with this, a quote from Fed Chairman Ben Bernanke about President Franklin D. Roosevelt’s 1934 Gold Reserve Act, which was the greatest theft of wealth I’ve aware of in American history:

“The finding that leaving the gold standard was the key to recovery from the Great Depression was certainly confirmed by the U.S. experience. One of the first actions of President Roosevelt was to eliminate the constraint on U.S. monetary policy created by the gold standard, first by allowing the dollar to float and then by resetting its value at a significantly lower level … With the gold standard constraint removed and the banking system stabilized, the money supply and the price level began to rise. Between Roosevelt’s coming to power in 1933 and the recession of 1937-38, the economy grew strongly.”

My predictions: gold at $2000/oz by the end of the year and $10,000/oz by 2012 and silver at $30/oz by the end of the year and $130/oz by 2012.

Disclosure: Long SRS, SRS calls, TBT, TBT calls, gold bullion.

===============================================

Please Feel Free To Comment on any of these articles! – jschulmansr

Dare Something Worthy Today Too!

Share this:

  • Click to share on Reddit (Opens in new window) Reddit
  • Click to share on Facebook (Opens in new window) Facebook
  • Click to share on LinkedIn (Opens in new window) LinkedIn
  • More
  • Click to share on X (Opens in new window) X
  • Click to share on Pinterest (Opens in new window) Pinterest
  • Click to share on Tumblr (Opens in new window) Tumblr
  • Click to print (Opens in new window) Print
  • Click to email a link to a friend (Opens in new window) Email
Like Loading...

A Golden Opportunity For 2009

31 Wednesday Dec 2008

Posted by jschulmansr in Bollinger Bands, capitalism, commodities, Copper, Currency and Currencies, deflation, Finance, Fundamental Analysis, gold, hard assets, How To Invest, How To Make Money, inflation, Investing, investments, Latest News, Make Money Investing, Markets, mining stocks, Moving Averages, oil, precious metals, silver, small caps, Stocks, Technical Analysis, Today, U.S. Dollar

≈ Comments Off on A Golden Opportunity For 2009

Tags

agricultural commodities, alternate energy, Austrian school, banking crisis, banks, bear market, Bollinger Bands, bull market, capitalism, central banks, China, Comex, commodities, communism, Copper, Currencies, currency, deflation, depression, diamonds, dollar denominated, dollar denominated investments, economic, economic trends, economy, financial, Forex, futures, futures markets, gold, gold miners, hard assets, heating oil, India, inflation, investments, Keith Fitz-Gerald, market crash, Markets, mining companies, Moving Averages, natural gas, oil, palladium, Peter Schiff, physical gold, platinum, platinum miners, precious metals, price, price manipulation, prices, producers, production, protection, rare earth metals, recession, risk, run on banks, safety, Saudi Arabia, Sean Rakhimov, silver, silver miners, socialism, sovereign, spot, spot price, stagflation, Technical Analysis, timber, U.S. Dollar, volatility, warrants, Water

2008 What a Year! So what does 2009 have in store? In today’s post we explore a “Golden Opportunity” Imagine re couping your 2008 losses and more! Everything is lining up in place for our “Golden Opportunity”, read on and find out how you can benefit in 2009- jschulmansr

Portfolio Advice for 2009: Stick to Gold, Stay Away From Stocks- Seeking Alpha

Source: Sovereign Society- Eric Roseman

Records were broken in 2008 – money-losing records from an investor’s perspective.

U.S. stocks will record their worst calendar year since 1931. As measured by the S&P 500 Index, the broader market tanked 40% this year while the Dow Jones Industrials fell 36%.

U.S. stocks are already “dead money” since 1996. They’ve shown no net gain at all – including dividends. The ongoing market environment is eerily similar to another period of dismal returns – from 1966 to 1982. During those 16 years, the Dow and S&P 500 Index posted zero profits. Adjusted for soaring inflation, the markets actually recorded a loss.

Global equities as measured by the MSCI World Index posted its worst year since inception in 1969. International equities fared even worse with European and Japanese stocks down more than 45% and the MSCI Emerging Markets Index clobbered – down 53% in 2008.

World Markets Got Trashed in 2008

Gold Stocks and Oil Chart

For stocks, the ongoing bear market has resulted in record mutual fund outflows as investors continue to dump their holdings and run for cover into money market funds.

Unfortunately, money market funds are now paying barely any yield at all since the Fed slashed interest rates to effectively 0% on December 16.

Only Treasury bonds, European and Japanese government bonds yielded a profit for investors in a wickedly harsh year for investors. As a currency investor, naturally you already know that the Japanese yen was also a winner against the dollar and euro as the “carry-trade” came to a crushing halt.

So Much for “Diversification”

With the exception of super-safe and low yielding U.S. Treasury bonds, yen and gold, the entire gamut of assets from stocks to non-Treasury bonds all plummeted in 2008.

Commodities, certain currencies, fine art and hedge funds all succumbed to brutal price declines. Overall, 2008 was the first losing year for U.S. and global stocks since 2002 and the worst period to be invested in financial and hard assets in more than 75 years.

Stop-losses rang out like pinball machines in 2008. Diversification across sectors, industries, countries and currencies proved futile. Almost everything was pummeled. By October 10, a panic gripped world markets as the threat of systemic collapse threatened the viability of the banking system.

Chaos to the Rescue

In late 2007, I introduced the TSI Chaos Portfolio to my Sovereign Society readers. It’s a U.S.-based portfolio of six equally-weighted investments, including short-term Treasury bonds, gold, Japanese yen and reverse-index funds that bet against the S&P 500 Index. Recently I added a seventh safe-haven – short-term German government bonds.

This cost-effective strategy dominated my recommendations in 2008 rising more than 17%, including dividends.

For growth investors, hedging your market exposure is vital in a secular bear market. I continue to like the TSI Chaos Portfolio in 2009 even though the stock market has probably suffered the bulk of its declines at this point.

Volatility will remain rampant in an uncertain economic environment marked by growing consumer credit woes, massive government bond issuance to support gargantuan fiscal spending plans and weak corporate earnings. Investors must hold downside market protection.

Short Most Commodities, But Stock Up on Gold/Silver

Starting in October 2007, I recommended my Commodity Trend Alert (CTA) subscribers begin to bet against oil and gas stocks as a way to hedge against the energy sector. At the time, oil prices were racing to US$100 a barrel and the oil stocks were in the midst of a multi-year bull market. We all know how that story fared in 2008.

Since peaking in July, the benchmark CRB Index has crashed more than 50% as the entire commodities complex continues to aggressively deflate in a rapidly slowing global economy.

To protect our natural resource exposure in CTA, I immediately issued a series of reverse-index purchases betting against commodities. We were most successful betting against industrial metals or base metals, as copper and other metals collapsed. That position, still open, has gained a cumulative 80% since August 2008.

And since September, CTA has been riding a broad commodity index to the basement as part of our reverse index strategy – up more than 60%. We also maintain hedges against gold, oil, gas and long-term Treasury bonds.

Gold has also been a strong performer compared to most other assets in 2008. Significantly, gold is the only asset that is completely outside the credit system and the only asset that has no liability.

In 2008, spot gold prices gained a modest 1% – not much in absolute terms but certainly impressive compared to other plunging assets. Silver, more of an industrial metal and therefore more vulnerable to broad economic trends, declined 18%.

Looking ahead to 2009, growth investors will only reluctantly return to stocks. Losses have been massive for investors since late 2007 as mutual fund redemptions hit records.

Stocks might indeed offer better values compared to mid-2007 after plummeting more than 40% from their highs. But domestic consumption in the United States, Japan and Europe is depressed and likely to remain under threat as unemployment rises and savings rates begin to rise again.

The correlation between a higher savings rate and corporate earnings is negative. It’s difficult to be bullish on earnings when the world’s largest economy will remain mired in a period of sluggish growth, debt retrenchment and rising job losses. The same is true for Japan and Germany – the second and third largest economies, respectively.

This is not the time to be aggressively buying stocks. Odds are prices will get cheaper again following any bear market rally. That’s certainly been the case every time stocks have rallied off their lows since October 2007.

Instead, make sure your portfolio includes gold, portfolio hedging strategies and income from high quality investment-grade corporate bonds in 2009.

==================================================

Predictions For 2009: Who Will Be the Winners and Losers? – Seeking Alpha

Source: Tony Daitorio of Oxbury Publishing

Visit: Investing Answers

Visit: Bourbon and Bayonets

The year 2008 is coming to a close. Good riddance! 2008 will be remembered as the year that the chickens came home to roost for America’s brand of “elitist capitalism” and will long be remembered as the year where the greed of so few penalized so many.

In 2008, the vast majority of pension plans and retirement accounts incurred losses of one quarter to one half of their value because of the greed of Wall Street. To me what is most sad is that Wall Street’s greed not only devastated the savings of a generation of Americans but has also shackled future generations of Americans with the bondage of enormous amounts of debt.

Echoes of History

Human greed and financial bubbles are, of course, nothing new. History has many examples of manias and bubbles such as the South Sea Bubble. To me, most striking is the parallel between today’s hedge funds and the investment trusts of the 1920s.

Investment trusts used leverage as do hedge funds. Investment trusts were able to get away with revealing little about their portfolios because the equity bubble of the 1920s conferred an aura of omniscience on their managers. Sound familiar? Their managers, by the way, were also very highly compensated.

Reputations inflated in the bubble of the 1920s promptly evaporated in the 1929 crash and the 1930s bear market. The 1930s bear market also exposed numerous outright swindles by Wall Street. Some of the swindles were all too reminiscent of Bernie Mad(e)off and his Ponzi scheme. I believe that, as in the 1930s, many lofty Wall Street reputations will be washed away.

Recently, the Financial Times had an interesting article about 19th century Victorian England and its literature. Financial crises were part of everyday life at that time, which greatly affected their literature. The article spoke of authors such as Charles Dickens, Anthony Trollope, Elizabeth Gaskell, and William Makepeace Thackeray.

A character in Charles Dickens’ Little Dorrit – Mr. Merdle – whose schemes initially offered his investors huge returns before wiping them out definitely reminds me of Bernie Merdle, I mean Madoff. The literature of those times definitely echoes in our times.

A Penny for My Thoughts?

Obviously, at the end of last year no one predicted the dire straits that we would face in 2008. This just reinforces in my mind one thought. Why does anyone still watch CNBC and listen to what any of those shills has to say? The only person on CNBC that has some brains is my paisano – Rick Santelli. The rest of the people on CNBC are absolutely worthless.

Since at the start of a new year everyone seems to like to make predictions, I thought I would throw my two cents out there for readers to ponder. Please contact Oxbury Publishing for your comments on my predictions or feel free to make your own predictions about the upcoming new year.

The Biggest Loser(s)

Picking the biggest losers for 2009 is relatively easy. You simply find the assets that have the most fat. I believe that in 2009 we will actually have two biggest losers. Which asset classes?

As I said – where the fat is. The fat is where the Wall Street money managers have run to hide and cower in fear for their jobs. That is, of course, the US Treasury Market! As I stated in my previous article – the HMS Treasuries – the “pirates” of Wall Street have loaded all of their ill-gotten booty onto the ship called the HMS Treasuries. I firmly believe that this ship will follow its predecessor, the HMS Titanic, into history and sink below the waves. Remember – both ships were considered to be ultra-safe and “unsinkable”.

A close second ‘biggest loser’ will be the US dollar. The US dollar has been strong in 2008 because of the perverse reaction of Wall Street money managers. An analogy I used in previous articles was that a nuclear blast went off right in the middle of Wall Street.

Even a rudimentary knowledge of science would dictate that you get as far away as possible from the blast. Yet, Wall Street money managers ran full speed toward the nuclear blast – nobody said that Wall Street money managers were smart. Most of them sold all of their assets overseas and moved the assets into dollars.

I believe that this move will prove to be “radioactive” in 2009, as overseas investors seem to be waking up to the fact that the US will need many trillions of dollars to bail out the US economy. Overseas investors may not sell the US dollar outright, but they will not be anxious to add to their positions.

Predictions

My first prediction is that in 2009, ‘bombs’ will continue to go off up and down Wall Street. I predict that the Bernie Madoff $50 billion Ponzi scheme will be just the first of many such major swindles that will be revealed on Wall Street.

I predict that the government will be forced to inject many more trillions of dollars into the black hole laughingly called bank balance sheets, inflating our government’s deficit to levels undreamed of only a few years ago.

However, I also predict that the amount of money sunk into banks will be miniscule in comparison to the amount of money that will be created out of thin air by the Federal Reserve in 2009. This money creation will puncture the balloon of the deflationists.

In astronomy, when talking about the distance between stars, astronomers don’t measure the distance in trillions of miles. Astronomers use light-years as a convenient measure of distance. So instead of trillions of dollars, perhaps some similar measuring stick will be adopted as a measure of how fast the Federal Reserve will be create funny money.

I can hear it now – “yes, in the last light-second the Fed just created $10 trillion of funny money”. Instead of the Big Bang Theory, perhaps there will be the Fed’s Big Buck Theory. This theory will describe how out of deflationary nothingness, the Federal Reserve created a rapidly expanding inflationary economic universe.

Winners?

Will there be any winners in 2009? I guess I have to predict some winners, huh? Which asset classes?

I am looking at the asset classes most beaten down by the forced liquidations of hedge funds and other Wall Street fools.

One such asset class is corporate bonds. Corporate bonds are priced right now by the Wall Street numbskulls for conditions to become worse than the 1930s and a 25% default rate. I predict that corporate bonds will have a very good year.

Another asset that has been sold off by the Wall Street numbskulls who have bought fully into the deflation myth are TIPS or Treasury Inflation Protected Securities. When the Fed’s Big Buck Theory becomes apparent, I predict that TIPS will be a huge winner.

I also predict that most commodities will stage a decent comeback. I believe that gold will have a decent year and re-visit the $1000 per ounce level. I also believe that oil will rebound to a more fundamentally sound price of between $71 and $87 per barrel.

I also predict that the best of bad equity markets will be in the countries that actually have cash and/or assets and do not have to borrow enormous amounts of money. Sovereign debt will become two words that are not spoken in mixed company. I don’t believe it’s a wise economic policy for a nation to rely on the kindness of strangers. Examples of the “better-off” countries would be China and Brazil.

================================================

Will the New GCC Single Currency Include Gold? – Seeking Alpha

Source: Peter Cooper of Arabian Money.Net

Gulf Cooperation Council leaders yesterday concluded their 29th annual summit meeting in Muscat, Oman with a final approval for the creation of a single currency for the six-nation economic bloc, still targeted for 2010.

Saudi Arabia is the largest economy in the GCC and boasts substantial gold reserves. But whether gold will be included in the currency basket has not yet been decided.

Golden opportunity

GCC assistant secretary-general Mohammad Al Mazroui told Gulf News: ‘We first have to decide on the location of the Central Bank, then the Central Bank and Monetary Council will have to decide on the gold reserves for the Central Bank’.

The creation of the GCC single currency – likely to be known as the Khaleeji which means Gulf in Arabic – is a major gold event for two reasons.

First, the breaking of their dollar pegs by the Gulf Arab nations is clearly dollar negative. Secondly, any inclusion of gold either as a part of the monetary basket, or in the reserves of the new GCC Central Bank will create additional demand for the precious metal.

2009 deadline

The project is gathering pace, and no lesser a figure than Saudi Arabia’s King Abdullah has directed that GCC economic integration committees speed up their work and complete the whole exercise by September 2009.

It is only a couple of months since a group of Saudi businessmen allegedly bought $3.5 billion worth of gold, believed to be the largest ever single transaction for the precious metal. Perhaps in 2009 it will be gold rather than local currencies which become of interest to speculators about monetary reform in the GCC.

Gulf countries are keen to break away from the link with the US dollar because it ties them to inappropriate monetary policies that exaggerate the boom-to-bust cycle in their economies.

==================================================

Don’t Miss The Coming Gold Bull- Seeking Alpha

By: Naufai Sanaullah of Dorm Room Derivatives

With the massive monetary expansion experienced in recent months and the promise for unprecedented levels of money and credit supply increase in coming months, the United States Federal Reserve looks on paper to be sending America straight into hyperinflation. Germany’s post-World War I Weimar Republic, post-World War II Hungary, 2001 Argentina, and present day Zimbabwe are all analogous examples of massive debt monetization, which all led to hyperinflationary disaster. Never before has the entire world’s economy been linked to one nation’s, however, as is the case today with the United States.

In a case of economic mutually assured destruction, foreign creditor nations and their central banks can’t afford to spark a run on the US Dollar, because it would kill their own export-based economies, as well as devalue their debt repayments and foreign exchange reserves. But the United States has been financing consumption through debt for decades and has resorted to monetary expansion to finance its debt and deficit spending, which is only going to increase with Barack Obama’s infrastructure and social programs. The Troubled Assets Relief Program (TARP) itself amounts to $700B, all of which will essentially be “printed.” Foreign demand for US debt is all but gone, as creditor nations are now attempting to unwind their USD positions. Huge creditor nations like China and Iran were net sellers of US Treasuries in recent months, attesting to the weakening of the American debt bubble. So where’s all this excess liquidity go?

The answer is gold, and it is the only way to prevent the hyperinflationary scenarios referenced above from materializing in the United States.

The Fed has been on a money printing binge of unprecedented proportions, but has been able to thus far “trap” the excess liquidity from reaching the consumer level, which is what causes price inflation. It started a massive foreign currency sale this summer through the Exchange Stabilization Fund (ESF) that led to a supply increase of Euros and suppression of dollar usage. It has been liquifying troubled banks by issuing them T-bills financed through monetization in exchange for toxic assets by utilizing reverse repurchase agreements. And it has used the recent deleveraging and commodity collapse (partially caused by credit defaults in many of the overleveraged institutions that were supporting the commodity bull) to supply the temporary demand for US Dollars and feeding its own foreign exchange reserves.

But the excess liquidity thus far is trapped in time-sensitive and manipulated instruments now, and without a demand for American debt, it has to go somewhere. As T-bills expire and the stock market descends further, actual currency is going to be released out of sequestration into the economy. The Fed cannot allow the market to breach below its November lows, unless it wants widespread insolvency in insurers and banks, which are legally required to halt operations in the event of insolvency. I’ve heard estimates of 7500 and 8000 in the Dow as being minimum support levels that, if broken for an extended time, would lead to economic collapse in America as financials would all go under. To prevent this and to finance Obama’s deficit spending, actual dollars will have to be injected into the system and they will be.

Weakness in the dollar causes strength in gold, which is something the Fed (through America’s banks) has been suppressing for years. COMEX shorts dominate this suppression of gold prices, but this act will be discontinued to prevent economic collapse. Allowing gold’s price to rise to current fair levels (and then rise further to represent gold’s rising fundamentals) will soak up much of the excess liquidity, preventing hyperinflationary price increases in consumer goods. Gold reached backwardation this month, signifying the big gold market manipulators are abandoning their short positions.

Ben Bernanke is a proponent of dollar devaluation against gold and is a staunch advocate of Frank D. Roosevelt’s decision to do so in 1934 during the Great Depression. Dollar devaluation is one of the government’s most prized tools, as it allows debts to be paid back in devalued nominal terms, transferring risk and purchasing power destruction to American taxpayers, who have no clue what is going on. Inflation is a tax on the people and with a fiat currency, a power-limitless Fed can (and has) tax the hell out of the American people.

The dollar, and fiat currency as a whole, faces collapse now, however, as the artificial wealth created and used in the past few decades is now showing its nature as being just that– artificial. The global monetary system will have to return to some sort of precious metal backing, directly or indirectly, and surging gold prices is essential for this to occur.

Rising gold prices represents the excess liquidity being soaked up and also causes nominal equity values to rise without dramatic rises in consumer goods. Gold has little utility outside of store of value, which is why its price hasn’t collapsed at nearly the same rate other commodities, like oil and natural gas, have. As crude and steel suffered demand destruction from consumers losing wealth quickly, gold was barely touched at all and in fact probably would have shown even more strength hadn’t it been for the aforementioned manipulations of the Fed and the global deleveraging of financial institutions.

Creditor nations like China and Iran are buying as much gold as is possible without dramatically disturbing prices, and Iran has said it wants to convert the majority of its foreign exchange reserves into bullion. Gold-buying sentiment is getting stronger as the massive seigniorage of the Fed, and with gold shorts being abandoned by the Fed, the huge demand is finally going to surface into price expansion.

Technically, gold appears poised to break out of its countertrend down move in its primary bull, leading to much higher prices soon. It broke out of its 50DMA on strong volume recently and is approaching a 200DMA breakout. With backwardation occuring this month, all indicators point to gold surging in the coming months.

Gold and gold miner stocks are also looking quite bullish. I recommend Royal Gold (RGLD), which recently broke out of a great long-term base, as well as El Dorado Gold (EGO), Goldcorp (GG), Iamgold Corp (IAG), Barrick Gold (ABX), Randgold Resources (GOLD), Jaguar Mining (JAG), Anglogold Ashanti (AU), Agnico-Eagle Mines (AEM), and Newpont Mining (NEM) for the coming year. Also, look into buying the Ultrashort 30-year Treasury Bond ETF (TBT) as the US debt bubble collapses and debt monetization starts to show up in the Fed’s balance sheets. I do suggest buying lots of bullion, however, as stock market returns are in nominal dollar-denominated terms.

The American total credit market debt to GDP ratio is at unprecedented highs, well above 350%, and this with ridiculously manipulated inflation numbers artificially deflated through hedonics. The government deficit could top $2 trillion next year. And the Fed is going to print money to pay for it all. The only way to prevent hyperinflation is to return to some sold of hard asset-backed monetary system and to allow gold’s price to rise dramatically.

My prediction: gold breaks $2000/oz in 2009 and $10,000/oz by 2012.

Disclosure: Long gold bullion; no positions in stocks.

================================================

Gold Bugs Have Fed to Thank for Recent Rally

Source: Monday Morning

By Don Miller

The currency markets reaction to the Federal Reserve’s recent interest rate cuts has ignited a rally in gold, as investors weigh the benefits of owning the yellow metal versus U.S. Treasuries and the dollar.

As a result, gold has started to shine again as a stable source of value at a time when the dollar and other commodities – like oil and copper – have fallen hard. The spot price of gold has climbed above $870 an ounce on the New York Mercantile Exchange, up about 20% from its October lows.

Gold has been on roller coaster ride in 2008, moving from its all time high of $1035 in March, to as low as $681 an ounce. Some of that decline occurred during the recent stock market plunge. Many investors were forced to liquidate profitable gold positions in order to raise money to cover their paper losses.

Its decline was then accelerated by the recent onslaught of financial bailouts, as many investors held a preference for liquidity and safety in the form of cash holdings guaranteed by the U.S. government.  That was reflected in the skyrocketing prices of government bonds and investments in government-backed banks, which also lowered yields.
But with the Fed’s recent decision to cut its target interest rate to a range of 0% to 0.25%, the dollar has suffered a significant decline. Suddenly, foreign investors who were scooping up dollars have cut back on their flight to safety, knocking the dollar index (NYBOT: DX) down 10% in the last month.  The index reflects the dollar’s value against the Euro, Japanese Yen, British Pound, Canadian Dollar, Swedish Krona, and Swiss Franc.

The Fed’s interest rate cut may also have given gold a comparative boost in the eyes of investors. Gold, which never pays interest, suddenly doesn’t look so bad when compared to T-bills, which also are paying zero interest lately.

Volatility has risen this year compared to previous years, and the last few months have been the most volatile of all – an indication of investor ambivalence. But any uncertainty about the increasing price of gold may have been waylaid by the Fed’s recent rate cut and its dampening effect on the dollar and Treasuries.

Consequently, don’t expect this rally to be short-lived. As we pointed out in our 2009 Outlook Report on Gold, the fundamentals in the market hold the promise of more gains ahead.

It appears unlikely central bankers around the world will stop stimulating economies, printing money and doing whatever it takes until growth and confidence are restored – even if the cost is rampant inflation.

Consider these wild card inflation indicators that Money Morning Contributing Editor Martin Hutchinson believes will carry gold prices to $1,500 an ounce by the end of 2009:

  • Over $7 trillion of freshly minted U.S. dollars are now in circulation with the aim of saving the global financial system.
  • The incoming Obama administration has promised another $1 trillion or so stimulus package is on the way.
  • It’s likely the Fed’s interest rate cuts will soon be followed by central banks around the world.

These economic stimuli are designed to do one thing – get the consumer spending again. 

The bailout of the banks was the first step, but the banks are still keeping a tight rein on credit. Now the government is trying to get easily available, cheap money back into the hands of the consumer by running the printing presses around the clock.

“The government is pumping money in so many banks, and that money has to come out somewhere,” said Hutchinson.

Some of that money will “come out” into the economy in the form of higher stock prices. That will make consumers wealthier, and could give them more confidence in the economy. More confidence means more spending. As that happens, prices for goods should begin ticking upward, giving another booster shot to gold prices.

For instance some of that money is already going into gold bars and coins. In fact, the U.S. Mint was forced to suspend sales of the popular American Eagle and Buffalo gold coins for extended periods twice in the last year. The mint was unable to secure enough gold blanks from suppliers to match demand.  

“I’ve never seen a case where demand was so high and supply was so short,” Chicago coin dealer Harlan Berk told the Associated Press. 

With massive amounts of capital floating around, the time it takes to re-inflate the global economy will be far shorter than most analysts expect. Governments fear deflation more than anything.  It appears they will only fight inflation when they are assured they have won the first battle, which is growth at any cost.

When inflation kicks in, the dollar’s buying power will suffer long-term.  In fact, we expect a decline in all the world’s paper money, over time.  Historically, investors in gold have prospered during periods of weakening fiat currencies.

That leaves gold as a bright light in the investment world, making it an odds-on favorite to open a new leg of a long-term uptrend
. 
News and Related Story Links:

  • Fortis Metals:
    Fortis Metals Monthly – December 2008
  • Associated Press:
    Woes on Wall Street coincide with gold coin rush
  • Money Morning:
    Five Ways to Play Gold’s Rebound to $1,500 an Ounce

Share this:

  • Click to share on Reddit (Opens in new window) Reddit
  • Click to share on Facebook (Opens in new window) Facebook
  • Click to share on LinkedIn (Opens in new window) LinkedIn
  • More
  • Click to share on X (Opens in new window) X
  • Click to share on Pinterest (Opens in new window) Pinterest
  • Click to share on Tumblr (Opens in new window) Tumblr
  • Click to print (Opens in new window) Print
  • Click to email a link to a friend (Opens in new window) Email
Like Loading...

Market Alert! Gold and Silver and More…

19 Friday Dec 2008

Posted by jschulmansr in commodities, Copper, Currency and Currencies, Finance, Fundamental Analysis, gold, hard assets, inflation, Investing, investments, Jschulmansr, Markets, mining stocks, Moving Averages, oil, precious metals, silver, small caps, Stocks, Technical Analysis, U.S. Dollar

≈ Comments Off on Market Alert! Gold and Silver and More…

Tags

agricultural commodities, alternate energy, Austrian school, banking crisis, banks, bear market, Bollinger Bands, bull market, capitalism, central banks, China, Comex, commodities, communism, Copper, Currencies, currency, deflation, depression, diamonds, dollar denominated, dollar denominated investments, economic, economic trends, economy, financial, Forex, futures, futures markets, gold, gold miners, hard assets, heating oil, India, inflation, investments, Keith Fitz-Gerald, market crash, Markets, mining companies, Moving Averages, natural gas, oil, palladium, Peter Schiff, physical gold, platinum, platinum miners, precious metals, price, price manipulation, prices, producers, production, protection, rare earth metals, recession, risk, run on banks, safety, Saudi Arabia, Sean Rakhimov, silver, silver miners, socialism, sovereign, spot, spot price, stagflation, Technical Analysis, timber, U.S. Dollar, volatility, warrants, Water

My Note: Gold is testing it’s new base of $825 to $840 level, if Gold Hold here then our next target will be $900-$940. After it clears that and yes I am bold enough  to make that prediction, then watch out! I have heard predictions of $1000, $1200, $1600, even $2000 and above. On a seasonal basis Gold usually makes it’s low in Nov. and then has a great rally through the 1st and even 2nd quarters of the following year. My prediction is that we should see Gold somewhere in the $1250 range on this next leg of the rally. Next, the Gold to Silver Ratio is 80-1, historically it has been averaging 50-1. If the ration tightens only to 60-1, then at $1250 gold we should see $25 silver. Platinum, not to be forgotten will resume it’s normal premium to Gold level (see article below) and I think with $1250 Gold we will see $2200 to $2500 Platinum. Bottom line if you haven’t gotten in (invested), NOW would be an excellent time! Now for the latest news… Enjoy! – jschulmansr

Gold and Silver Forcaster Market Alert!

By: Julian D. Phillips of Gold/ Silver Forcaster.com- Global Alert!

Gold has now entered the next and major leg of the long-term gold bull market after correcting down from $1,035.   We believe it is now targeting $1,000, initially.   This will be achieved with pullbacks and periods of consolidation.


We believe, too, that gold shares will benefit to a greater extent than gold itself, in the next moves up.  In particular, we feel that soundly based gold “Junior” mining companies will benefit strongly.


Please refer to our latest issues for our preferred shares.


The move has been triggered by the clear signal from the Fed that the deflationary spiral gripping the global economy is far more serious than realized until now.   The initial impact has already been seen in the precipitous fall of the U.S.$ to over $1.41 so far.   As repeated attempts to re-invigorate the flow of liquidity have failed, the U.S. Federal Reserve had to do more, much more. 


q       The Fed’s interest rate cuts and ‘Quantative Easing” will soon be followed by central banks across the world.  

q       The swamping of the global economy with liquidity will stem deflation, but will also badly damage confidence in the world’s monetary system and give rise to explosive inflation.  

q       The time it takes to reflate the global economy will be far shorter than most commentators expect.  

q       The strains that the world will now feel, particularly in the different world economies, will become in many instances, unbearable, so we expect to see restrictive local action in those economies to manage the huge capital flows that will be experienced.  


All of these prospects are very positive for gold.


We last issued a similar Alert early in September in 2007.   History shows how correct we were!     


This alert is to prompt you to act now before the market really takes off.

====================================================

Gold Stock On The Move

By: Brad Zigler of Hard Assets Investor / Brad’s Desktop

Real-time Inflation Indicator (per annum): 10.5%

====================================================

Why The Bull Market is Far From Over

Source: Gold Forecaster.com


Some talk of the end of the credit crunch. Some say that the gold bull market has suffered severe damage, which will affect its long-term prospects. If we were to accept these statements then it would appear that the gold ‘bull’ market is over. But are these statements acceptable and do they reflect the true picture underlying the gold [and silver] markets?

To get the proper perspective let’s stand back
and look at the ‘BIG’ picture.


Is the Worst Over?
Credit Crunch Not according to the I.M.F. An assessment by the International Monetary Fund says potential losses as a result of the credit crisis could exceed US$1 trillion. The assessment includes warnings that further losses and write-downs on prime mortgages, commercial real estate, leveraged loans, and consumer finance were likely. The IMF’s Global Financial Stability report put credit market losses at USD945bn, as of mid-March, with more losses expected for months to come.
The report also stressed the fact that the credit crisis was impacting the full spectrum of the financial market in one way or another, with losses distributed between banks, insurance companies, pension funds, hedge funds, and other investors. We note that credit card finance alonside car finance has been included in assets acceptable to the Fed as collateral, which tells us it is not over by a long shot.

U.S. Trade Deficit February recorded a Trade deficit of $62.3 billion against a January deficit of $59.0. This still looks like a $720 billion deficit to us and with oil prices now at over $120 a barrel and Chinese imports still cheaper than local products and flooding in, the prospects are for a worse annual Trade deficit than ever before. And there is no real sign that this deficit is dropping.


Oil Prices With OPEC talking of a potential oil price of $200 a barrel something has to be done to stop more than a decline in the $; a stop must be put to the massive global scramble for resources by a combination of the developed world and the emerging world, because prices will continue to rise until they are so high that some will have to do without. This problem is about the massive rises in demand with far greater ones to come.
 
So are there solutions in the pipeline? It seems that the only solutions available to the authorities are existing market controls and proposed market controls on all types of markets, but not on a globally coordinated front. Unless there is global coordination such control will be completely inadequate.

Control of the Markets
Little has been published on the proposed actions by the Treasury department, the Fed and the G-7. But they are actions that will attempt to place important markets under the control of monetary authorities of the G-7. They do not, however, include the interests of the emerging nations on important fronts.

The plan of Treasury Secretary Paulson to overhaul the financial system included a crucial proposal: it would officially transform the Federal Reserve into a “market stability regulator.” The U.S. Treasury has indicated that the Fed could use proposed new regulatory powers to stop, “credit and asset market excesses from reaching the point where they threaten economic stability.” David Nason, assistant secretary for financial institutions, said the Fed could even use its proposed “macro-prudential” authority to order banks, hedge funds and other entities to curtail strategies that put financial stability at risk.

Treasury wants to merge the Securities and Exchange Commission, the US markets watchdog, with the Commodity Futures Trading Commission that is charged with overseeing the activities of the nation’s futures market. A conceptual model for an “optimal” regulatory framework focused was being put forward to achieve three objectives: market stability, safety and soundness with government backing, and business conduct.

A working group was being established between Britain and the United States to sketch out the best way to tackle financial market turmoil. The British government said that it wants to work closer with the US and our other major international partners in dealing with the global financial turbulence. This is a global issue that requires a global response, it said. While it appears the intentions are noble, they are without a doubt ways and means to control markets as the Fed deems fit, inside the USA and the UK.

“The G-7 group of nations agreed to “calm markets showing irrational moves”. But this message did not have enough emphasis or was it ignored as a threat? To reinforce the statement, Jean-Claude Juncker, Luxembourg’s premier and the chair of Europe’s finance ministers, announced on April 23 “financial markets and other actors [had not] correctly and entirely understood the message of the [recent] G7 meeting.” In other words, markets were put on notice that the world authorities may [will and are?] take action to halt the collapse of the US$ and undercut commodity speculation by hedge funds.”

“French Finance Minister Christine Lagarde likened the recent G-7 stance to the 1985 Plaza Accord when the industrialized nations agreed to “coordinated intervention” to drive down the US$.

“Could this be a joint effort by the States and Europe to try to impose a tight trading range on the €: $ movements in the future? We think it is as the €: $ exchange rate moves of the last few weeks have shown [trading between $1.54 and $1.59 against the €]. Much as Central Banks don’t want to ‘intervene’ in foreign exchange markets, it seems that they will do so. Threats will be ignored until turned into action.

“Now we have food crises; governments in the emerging world are proposing other market controls. The issue of food inflation has led some governments to contemplate provocative strategies to lower food prices. India is reported to be considering a ban on trading in food futures, a move designed to stifle what the Indian government regard the speculative influence of hedge funds and financial market traders in the recent surge in commodities prices. As food shortages build up food protectionism is starting in some nations, curtailing exports of food needed internally. This type of control has to become more widespread as food prices hurt nation after nation going forward. With food as well as resource prices running up dramatically action to restrain them will have to be taken on a national basis, which we do not see being followed through on an international front.


“It seems inevitable that more and more controls will have to be imposed on more and more markets. It is inevitable that global movements of capital will have to be retrained at national levels. The world just cannot afford to have the huge wealth funds and trade surpluses running through constrained exchange rates, spreading inflation through higher prices, until local capital and trade markets demand drastic exchange controls. Attempts at intervening in foreign exchange markets to contain exchange rates will attract the switching of huge surpluses into currencies other than the US$. US-based funds can be controlled for sure, but can Asian and Middle Eastern ones? History well testifies that it takes the full impact of a crisis to give good political cause to trigger draconian measures, such as Capital and Exchange Controls.

The Impact on Gold and Silver Prices
While monetary authorities may not be happy to see a resurgence of global demand for gold and silver, those who are able to, will see these mounting controls as a threat to the true measurement of value, which currencies have provided since the last world war. As the dangers become more apparent, the $: € exchange rate will not serve as a determinant of the gold and silver prices, but the falling macro-confidence, fear of more instability, doubts about the value of global currencies, both ‘hard’ and ‘soft’ and uncertainty on a broad global front, will prompt a broadening of the type of global investors attracted to these metals to reflect these fears over time, to ensure that the gold and silver prices reflect global values and counter those measured against controlled values [managed currencies] in other markets.

Certainly, the ‘bull’ market in gold and silver is far from over. The market is metamorphosizing into a new phase promising far higher prices than we even contemplate now.

What prices will gold and silver have then?

“The actual prices of gold and silver will become simply academic.”

============================================================

Gold Marks Two Important Milestones!

By: Martin Zielinski of 8 Stock Portfolio.com

In the past week, gold quietly marked two important milestones.

First, as of Monday the price of gold is now showing a gain for the year. The closing price of gold on December 31, 2007 was $833.75. The price of gold today is $854.60. That makes gold up 2.5% for the year to date. If gold can hang onto this gain into the end of the year, this will also mark the eighth year in a row that gold has had a positive return. For the year and for this decade, gold has humbled its naysayers and rewarded its investors.

Second, on Tuesday the price of gold exceeded the price of platinum. The two metals now trade within a few dollars of each other with gold at $854.60 and platinum at $858. This is a big change from earlier in the year when platinum was trading over $2,200 per ounce, more than double the price of gold. If I’m not mistaken, the price of platinum has been higher than the price of gold for this entire decade. Not since the 1990s has gold been more expensive than platinum. Considering that platinum is thirty times scarcer than gold, this makes a strong statement about the demand for gold.

Disclosure: Author is long physical gold and platinum

=====================================================

A New Place For Investors To Find Silver

By: David Morgan of Silver Investor.com

received a phone call from Tarek Saab, a former finalist on Donald Trump’s television show, The Apprentice. At first I was a bit suspicious because, believe it or not, there are a few flakes floating around the gold and silver arena, and having someone claim to be associated with The Donald did send up warning flags. I must state, however, that perhaps to an outsider, all gold and silver bugs probably seem nuts!

Tarek’s call was followed by an e-mail and this gentleman sounded as bullish on the precious metals as anyone I have met. In fact he began something that many of my friends and associates have talked about for years. He began a peer-to-peer network where buyers and sellers can find true price discovery and deal in physical silver and gold.

His company, GoldandSilverNow.com, is helping solve a “shortage” problem in the precious metals market by linking buyers and seller directly. In a previous article, I mentioned that one of my colleagues in Belgium has put together a method of tracking eBay (EBAY) prices; see Precious Metals Price Discovery.

The current situation is a huge spread between the paper derivative price on COMEX and the actual price paid for silver and gold by retail investors. This was discussed in my article “Silver Arbitrage.” People can take advantage of a price differential between two or more markets, striking a combination of matching deals that capitalize upon the imbalance, the profit being the difference between the market prices.

There is without a doubt a price differential between retail silver product, such as 100-troy-ounce silver bars, and the spot price for silver on the Futures Exchange. In fact, this presents a very good arbitrage opportunity for those willing to take the risk. This is accomplished by selling lots of 1000 troy ounces in 100-ounce-bar increments and locking in the 1000-oz. COMEX bars for delivery. This process is achievable and, as with all arbitrage situations, will find some market participants willing to take advantage of this opportunity.

But GoldandSilvernow.com is not an auction house. The company, described by Saab as a “virtual bullion dealer,” has a simple transaction process: A seller registers and sends a picture of his inventory. The buyer, who must purchase a minimum of 500 ounces silver and 10 ounces gold, wires funds directly to the company, which acts as escrow. When the funds clear, the seller ships his bullion via registered mail, according to strict packing instructions.

Now it must be impressed that this seems to be a rather simple idea, and in fact it is, but to my knowledge it is just beginning to be implemented. Saab’s is not the only one, however; we are seeing more and more Web sites pop up that are selling precious metals.

There is another Web site that has begun business recently that is known as seekbullion.com and has some of the expertise from goldseek.com and silverseek.com. The founder of goldseek.com came to one of my first appearances at the Wealth Protection Conference in Phoenix, Arizona, and we have been friends ever since.

According to their Web site, “SeekBullion.com™ is an online precious metals/bullion auction Web site that deals with trusted pre-screened authorized dealers (sellers). SeekBullion.com™ is a division of GoldSeek.com and SilverSeek.com, Gold Seek LLC, founded in 1995. SeekBullion.com™ aims to create a new marketplace for bullion products at competitive rates, whereas other auction Web sites will charge several percent on auctioned products which increases the cost to both parties. SeekBullion.com™ aims to greatly reduce the cost of bullion auctions with the trust and integrity of Gold Seek LLC, the premier global leader in precious metals information and financial truth.”

A third Internet site that deals in silver is FlettExchange.com. According to its Press Release:

Flett Exchange LLC is introducing a new silver market. 100 oz and 1,000 oz silver bars are now listed on Flett Exchange, LLC, to buy and sell. For hundreds of years silver has been recognized as a superior form of monetary currency and is internationally accepted. It has retained its intrinsic value by backing paper currencies and has many versatile industrial uses. Our 100 oz and 1,000 oz silver bar markets will allow participants to convert cash into silver and silver into cash.

100 oz and 1,000 oz silver bars are proficient way for investors to gain access to a growing silver market. These premium bars are easily shipped, conveniently stored, uniformly stacked and are dependable forms of financial liquidity. Our silver bar markets are live, anonymous, two-way market determined by Flett Exchange, LLC, users. Customer price-negotiation eliminates the premium buyers pay and the discount sellers incur, when transacting with major bullion houses and other auction platforms.

These are just three of the recent websites that have seen an opportunity and capitalized upon it. To be clear I have not personally dealt with any of them, so I am not necessarily endorsing any of them but do find it interesting that market participants and proving the free market still exists. In closing, this will be the last weekly article in the public domain as we are working overtime on the January issue which is by far the largest issue of the year. Those interested in viewing our work in full can click here.

Some readers outside of the U.S. have asked us where can I buy without huge premiums and one place that works with industrial size bars can be found by clicking here.

So, in closing out another year, I wish everyone Peace in the New Year

My Note: If you go to these websites please due your due diligence and check them out before investing or buying- A word to the wise!- jschulmansr

=====================================================

In light of what I just mentioned above, here are some tips-jschulmansr

Ponzi Red Flags!

By: Andy Abraham My Investors Place

It is front page news that Bernie Madoff created one of the largest Ponzi schemes ever….How could sharp investors get sucked in… it is really unbelievable…The question is what can you do to protect yourself…Here are some of my quick thoughts…as well open the floor to all to add their thoughts..

1.Avoid managers who are unknown, or unregulated, or come without good referrals, or haven’t been in the industry long.
2.Look out for an investment manager who wants complete control of your money and does not fully detail what EXACTLY he does… it has to be simple enough that anyone could understand.
3.Check Finra (I added the link-jschulmansr)
4. Understand the EXACT strategy
5. Don’t rely on black box ideas
6. If the returns are too good to be true…( it goes without saying)
7.Have a broker dealer have custody and get copies of your statements directly from the broker.
8.Ask for recent audits…and make sure the accounting firm is a reliable entity…

Some of these basic ideas would have kept you from investing with Madoff… but with consistent 10% returns for years… it almost becomes a self fullfilling prophecy…and as other investors plow money into the idea… the safer you might feel… but look at this list…and I would like to hear your opinions as well…

Andy


===================================================
Have a Great Weekend! –jschulmansr
DARE SOMETHING WORTHY TODAY TOO!


Noticed something? Take a look at the inflation number in the subhead. The indicator’s gone into double digits as the result of the Fed’s recent move to cheapen the dollar. Gold, not surprisingly, responded with a gap-higher opening Wednesday and a fill-in trading session Thursday.

February COMEX gold has set itself up for a test of the $880 level, a price visited but not held on Tuesday. A close above $880 would be convincing evidence of bullish resolve to work toward the October reaction highs above $900. On the other hand, a close below $803 would indicate that a short-term top is in.


COMEX Gold (Feb. ’08)


It’s that “other hand” stuff that’s so worrisome to gold aficionados.

There’s been a lot more enthusiasm for gold stocks recently. Over the past trading week, mining issues proxied by the Market Vectors Gold Miners ETF (NYSE Arca: GDX) have gained 6.5%, while bullion has risen just 4%. The performance edge, in fact, has been held by gold equities for more than a month as bullion formed a base and started working higher. That can be visualized by comparing the relative performance of the SPDR Gold Shares Trust (NYSE Arca: GLD) to the Market Vectors portfolio. The bullion trust’s price multiple has fallen from 4.1 to 2.8 since late November.


Bullion (GLD)/Gold Equities (GDX) Ratio


Of the Market Vectors ETF’s three dozen components, Royal Gold Inc. (Nasdaq: RGLD) has been the strongest. And for good reason. Denver-based Royal Gold acquires and manages royalty interests in a variety of production, development and exploration stage projects worldwide. Strong fundamentals such as industry-beating cash flow-to-sales and current ratios, together with a steady dividend stream, have attracted interest in the stock. So much so that Royal Gold shares have appreciated nearly 38% for the year, with 20% less volatility than the Market Vectors portfolio.


Royal Gold Inc. (RGLD)


So, the big question remains:. If Royal Gold has been noticed by investors, is its stock now fully valued?

If you’re a “glass half empty” investor, you’d have reason to be concerned. After all, a 38% return in a market like 2008’s is a gift. The “glass half full” folks, though, are looking at a short-term price objective of $51, another 18% in upside potential.

You can either raise your half-empty glass to bid farewell to 2008 or toast the new year with your half-full glass.

Enjoy your holidays.

Share this:

  • Click to share on Reddit (Opens in new window) Reddit
  • Click to share on Facebook (Opens in new window) Facebook
  • Click to share on LinkedIn (Opens in new window) LinkedIn
  • More
  • Click to share on X (Opens in new window) X
  • Click to share on Pinterest (Opens in new window) Pinterest
  • Click to share on Tumblr (Opens in new window) Tumblr
  • Click to print (Opens in new window) Print
  • Click to email a link to a friend (Opens in new window) Email
Like Loading...

Is the “Squeeze” Starting In Gold?

16 Tuesday Dec 2008

Posted by jschulmansr in capitalism, commodities, Copper, Currency and Currencies, Finance, Fundamental Analysis, gold, hard assets, inflation, Investing, investments, Latest News, Markets, mining stocks, Moving Averages

≈ Comments Off on Is the “Squeeze” Starting In Gold?

Tags

agricultural commodities, alternate energy, Austrian school, banking crisis, banks, bear market, Bollinger Bands, bull market, capitalism, central banks, China, Comex, commodities, communism, Copper, Currencies, currency, deflation, depression, diamonds, dollar denominated, dollar denominated investments, economic, economic trends, economy, financial, Forex, futures, futures markets, gold, gold miners, hard assets, heating oil, India, inflation, investments, Keith Fitz-Gerald, market crash, Markets, mining companies, Moving Averages, natural gas, oil, palladium, Peter Schiff, physical gold, platinum, platinum miners, precious metals, price, price manipulation, prices, producers, production, protection, rare earth metals, recession, risk, run on banks, safety, Saudi Arabia, Sean Rakhimov, silver, silver miners, socialism, sovereign, spot, spot price, stagflation, Technical Analysis, timber, U.S. Dollar, volatility, warrants, Water

Is the “Squeeze” Starting In Gold?

Short Note by jschulmansr of Dare Something Worthy Today Too!

Word is slowly leaking out on the street that a potential short squeeze is developing in the Gold Market where we are already seeing backwardation. If traders and investors etc. start taking delivery on their gold contracts we will see a lot of the “Shorts” scrambling to be able to make delivery, while chasing a very short supply. It would appear that we have a “perfect storm” starting to form. Since the “Shorts” are actually legally bound to make delivery there is a very real possibility of a “bidding war ensuing in the Gold Market Commodity Trading Pits.  In turn this may turn out to be the final catalyst needed to breakout gold above the $850 resistance level and “jump-start” the next upward leg of the “Golden Bull”. If you haven’t already started, get invested in Precious Metals especially Gold NOW! If already invested you may want to load up on some more and increase your holdings. Either way in the long term picture I do not think that you will be disappointed. However, remember to do your Due Diligence before making any investments.

Good Investing!-jschulmansr

===============================================

Counterparty Risk May Lead to Potential Squeeze in Gold Market – Seeking Alpha

By: Mark O’Byrne of Gold and Silve Investments  

Gold rallied sharply last week and was up nearly 9% despite continuing uncertainty and a very mixed performance in stock markets. The US dollar index fell some 4% on the week and it looks increasingly likely that the dollar may have topped out and may soon resume its bear market. For the year, gold is now up by more than 4% in dollar terms and by much larger amounts in euros (+11.7%) and pounds (+40.4%).

Gold rallied sharply on the open in Asia and has remained elevated as oil is stronger (up some 4%) and the dollar remains weak.

The FT reported late Friday on the potential for squeeze in the gold market by year end which would see prices rise materially.

The FT’s Chris Flood reported that:

Traders have been hearing talk that the gold market could face a potential squeeze at the end of this year if market participants with futures position on New York’s Comex exchange decide not to roll over their positions, because of concerns about counterparty risk and opt for physical delivery instead.

But dealers dismissed the threat of a squeeze, pointing out that Comex gold stocks stand at 8.5 million ounces, well above the five-year average of almost 6 million ounces. …”

The 8.5 million ounce figure cited by the FT is actually the total Comex gold inventory which includes gold that belongs to customers who are storing it on the exchange which is not available for delivery. The amount that is registered to dealers, and therefore available for delivery, is only 2.846 million ounces. The delivery notices that have been issued so far in December total 1.26 million ounces, which is 44 percent of the available deliverable gold. There is also the possibility that some of the gold may be encumbered in lending/swap operations.

According to the Gold Anti-Trust Action committee (GATA), the Comex authorities themselves have been alerting various futures firms about the potential of a squeeze on the December contract . The Comex is allegedly advising the $840 December shorts to exit their remaining open positions. There have been 12,636 notices of delivery. The shorts have until December 31 to make delivery. Normally they deliver early to take in cash and earn the interest.

This represents about 43 percent of the gold available at the Comex. Some speculate that concerned futures players could buy the February gold contract and then spread into December, which would shock the shorts and lead to a massive short squeeze sending prices markedly higher in a short period of time.

Former Federal Reserve Governor Says Fed’s Gold is Important Asset

Another bullish development for the gold market was former Federal Reserve Governor, Lyle Gramley reassuring that the Federal Reserve’s solvency was not at risk (due to its rapidly deteriorating balance sheet). Gramley denied such concerns were valid as he said the Fed has significant assets in the form of undervalued government gold certificates.

Interviewed Monday last week on the “Trading Day” program of the Business News Network in Canada, Gramley hinted that a big upward revaluation of gold may figure heavily in the Fed’s attempt to rescue the U.S. economy. Gramley, now senior adviser at Stanford Group in Houston, was asked about the seemingly grotesque expansion of the Fed’s balance sheet in recent months by the program’s guest host, Niall Ferguson, an author and history professor at Harvard.

Ferguson asked:

I’ve heard it said that the Fed has turned into a government-owned hedge fund, leveraged at 50 to 1. Do you feel nervous about what this might actually do to the Fed’s reputation?

Gramley reponse was:

I think you have to reckon with the fact that one of the Fed’s assets is gold certificates, which are priced, as I remember, at $42 an ounce, and if we were to price them at market prices, the Fed’s leverage would look a lot less than it is now.

More signs that gold is increasingly being viewed as the potential savior of central banks internationally from the global deflation gripping the world. The Federal Reserve is one of the largest holders of gold in the world with most of its foreign currency reserves in gold. A devaluation of the dollar and revaluation of gold may help the U.S. government and the Federal Reserve to protect their solvency and inflate their way out of a Depression.

================================================

Gold Is One of The Few Investments That’s Up This Year

By: Tim Iacono of The Mess That Greenspan Made

Don’t look now, but the little yellow metal that pays no interest and provides no dividend is one of just a few assets that can make the claim of being in positive territory for the year.
IMAGE

It’s only eked out a gain of about one percent – a London PM fix of $833.75 last December 31st versus about $840 as this is written – but, most investors would be happy with any number that doesn’t start with a minus sign this year.

Interestingly, if you held the physical metal versus the paper variety, you’d be up somewhere around five percent at the moment.

The next two weeks could also be kind to gold as the second half of December has produced an average gain of about two percent over the last seven years, since the price began rising at the rate of almost 20 percent per year.

IMAGE Just an average gain between now and New Year’s Day would put the price at around $860 an ounce, still down more than 15 percent from the high seen in the spring, but quite a good result, all things considered.

=================================================

These Commodities Are Starting To Look Tradable Again –

by Lee Lowell, Futures Options & Commodities Specialist, Smart Profits Report

In my last column on December 1, the price of crude oil had just slid under the $50 a barrel level – and over the past couple of weeks, the action has continued to be anything but boring.

We’ve seen the price drift down just shy of the $40 mark – a level we haven’t seen on a front-month futures contract since December 2004.

To illustrate how fast the market is moving these days, we saw a very brief bounce back to $50 earlier today before the gooey stuff fell right back down to $45.

Now that’s what I call some good, old-fashioned intraday volatility.

I don’t know about you, but I’ve noticed that the price of gasoline at my local station has shifted more than usual on an intraday basis, too.

But if the OPEC oil cartel has its way, we could see oil climb more forcefully again. The ministers have already promised to “shock” the market with a supply cut when they meet on Wednesday. I think anything under a two million barrel per day cut will be seen as bearish for the market.

Natural Gas Edges Closer To A Prime Bullish Level

Natural gas prices have made another move lower, finally falling under the $6 per MMBtu level to its current level of approximately $5.650 per MMBtu. We’re looking for natural gas prices to get down to the key $5 per MMBtu level.

Why? Because the $4.500 to $5.000 per MMBtu area has proven to be a solid support level for the past six years. The last time prices traded under $4.500 per MMBtu on a consistent basis was in early 2002. If it does so again, this is the price at which we could consider a bullish trade.

Has Logic Returned To The Precious Metals Market?

At last! The old theory of precious metals being in high demand during times of economic turmoil might finally be coming back into play.

It seems that gold and silver have washed out all the weak bullish speculators, with both metals enjoying decent technical bounces and possibly regaining some upside momentum.

Gold has already made solid upside moves over the last two weeks and silver looks like it might be able to break out of the narrow trading channel that has trapped it for the past two months.

Keep an eye on these because if the world markets continue with their downtrends, these metals could be the only bullish things around.

But hold on a second…

Grains Looking Good

Over in the grains world, we’ve seen some good upside action over the past week, with corn, wheat, and soybeans all beginning to look up.

Check out their charts here:

CORN: http://futuresource.quote.com/charts/charts.jsp?s=ZC%20H9
WHEAT: http://futuresource.quote.com/charts/charts.jsp?s=ZW%20H9
SOYBEANS: http://futuresource.quote.com/charts/charts.jsp?s=ZS%20F9

Along with the rest of the commodity sectors, these markets topped out in July after making new all-time highs and have been mired in stubborn downtrends ever since.

It may be too early to tell if these markets have finished with their downmoves as historically speaking, prices are apt to trend lower from this time forward until springtime, since most of the harvests have been concluded. But while we may see grains drift south just a little bit longer, we might have seen the last of the 2008 lows at this point.

Cotton Looks Tempting, But We’re Going To Hold Off A Little While Longer

As I’ve mentioned a few times in recent weeks, the cotton market was trending down towards its all-time low price of $0.28 per pound, which it set in 2001 (based on information spanning back to 1979). So with that possibility still in sight, I’m keeping a close watch on it.

The current front-month futures contract (March 2009) dipped under the $0.40 per pound level on November 20 and has since turned higher to its current level of $0.44 per pound.

In my opinion, it’s starting to coil itself into tighter trading ranges and when it finally blasts out, you can expect it do so with gusto. We just need to wait and see what direction it will break to.

Until next time… good trading.

Lee Lowell

Share this:

  • Click to share on Reddit (Opens in new window) Reddit
  • Click to share on Facebook (Opens in new window) Facebook
  • Click to share on LinkedIn (Opens in new window) LinkedIn
  • More
  • Click to share on X (Opens in new window) X
  • Click to share on Pinterest (Opens in new window) Pinterest
  • Click to share on Tumblr (Opens in new window) Tumblr
  • Click to print (Opens in new window) Print
  • Click to email a link to a friend (Opens in new window) Email
Like Loading...

IAMGOLD: Expect a Move Higher – Seeking Alpha

08 Monday Dec 2008

Posted by jschulmansr in capitalism, commodities, Copper, Currency and Currencies, Finance, Fundamental Analysis, gold, hard assets, inflation, Investing, investments, Latest News, Markets, mining stocks, Moving Averages, precious metals, silver, small caps, Stocks, Technical Analysis, Today, U.S. Dollar, Uncategorized

≈ 1 Comment

Tags

agricultural commodities, alternate energy, Austrian school, banking crisis, banks, bear market, Bollinger Bands, bull market, capitalism, central banks, China, Comex, commodities, communism, Copper, Currencies, currency, deflation, depression, diamonds, dollar denominated, dollar denominated investments, economic, economic trends, economy, financial, Forex, futures, futures markets, gold, gold miners, hard assets, heating oil, India, inflation, investments, Keith Fitz-Gerald, market crash, Markets, mining companies, Moving Averages, natural gas, oil, palladium, Peter Schiff, physical gold, platinum, platinum miners, precious metals, price, price manipulation, prices, producers, production, protection, rare earth metals, recession, risk, run on banks, safety, Saudi Arabia, Sean Rakhimov, silver, silver miners, socialism, sovereign, spot, spot price, stagflation, Technical Analysis, timber, U.S. Dollar, volatility, warrants, Water

IAMGOLD: Expect a Move Higher – Seeking Alpha

By: Glenn Cutler of The Winners Forum.com

IAMGOLD Corp (IAG) is a Canadian based mining company that participates in worldwide exploration and development of mineral resources and produces roughly 1 million ounces of gold annually from eight property locations on three continents: North America, South America and Africa. The company boasts the largest cash flow ratio on investment in the entire industry and is second among top mining companies in terms of achieving earnings per $1000 invested. Revenue, adjusted net earnings and cash flow have all risen sharply through the first 9 months of 2008.

IAG MAINTAINS STRONG FINANCIAL POSITION

Given recent concerns about the economy and in particular, debt and leverage, stocks which are most likely to attract investor attention are those of companies that have bullet proof balance sheets, stable or growing cash flow and access to capital. IAG is a gold star candidate, with a low Debt/Equity Ratio and recent liquid assets as published in their 2008 TWP Presentation document as follows:

  • CASH and CASH EQUIVALENTS – $153 million
  • GOLD BULLION (at market value) – $154 million
  • 5-YEAR UNDRAWN CREDIT FACILITY – $140 million
  • TOTAL FUNDS AVAILABLE – $447 million
  • YTD 9 MONTH OPERATING CASH FLOW – $189 million

GOLD PRODUCTION/GEOGRAPHIC DIVERSIFICATION – This company produced 253,000 ounces, a 5% increase in the latest quarter. They are on track to produce 950,000 ounces in 2008. Production costs are $476/ounce slightly below the estimated $480-490 range. Geographic diversification is another important factor for investors. IAG has production at 8 different facilities which breaks down as 51% (Africa), 30% (Suriname) and 19% (Quebec). Its current goal is to double total production to 1.8 million ounces in 2012.

RESERVES and RESOURCES

Mines Proven & Probable Measured & Indicated* Inferred
Rosebel 3,233,000 8,283,000 79,000
Doyon Division* 206,000 662,000 576,000
Mupane 311,000 792,000 7,000
Tarkwa 2,307,000 2,752,000 733,000
Sadiola 394,000 1,609,000 325,000
Yatela 200,000 234,000 103,000
Damang 274,000 468,000 266,000
Total 6,925,000 14,800,000 2,089,000

IAMGOLD Acquires 71.6% of EURO RESSOURCES S. A. (EUR.TO) for $1.20 / Reopens Offer

On December 3rd, IAMGOLD Corp announced results of its $1.20/share tender offer for French company Euro Ressources S.A. That company’s principal asset is a 10% royalty interest in the Rosebel Gold Mine in Suriname which is operated by IAMGOLD. This mine which is estimated to have 10 million ounces, achieved record throughput and the $44 million expansion and optimization project in on target for completion in early 2009. According to the CEO of IAMGOLD, this strategic purchase will reduce cash costs by about $45 per ounce produced at this specific property.

With the recent decline in the foreign exchange rate of the Euro currency, IAG was able to move quickly to purchase Euros and lock in the transaction cost at an average rate of 1.27, approximately 15% below the 1.47 exchange rate the date they announced the deal. Regulations require the offer be reopened for an additional 10 days at the same price, until December 17th.

IAG STOCK – Recent Price Activity

Typical of most mining stocks, IAG has been in a steady downtrend over the past year. Shares were banging around $10 when the year began and then gradually declined. The price stair-stepped its way down, spending time in each support zone before breaking down to the next area where buyers would regroup. The $5-6 range held from April through most of September, and then when financial markets cracked the price tumbled hard and fast to print a recent new low around $2.22 a share. Shares have been trending modestly higher since hitting their lows, and it’s possible we could see a new pattern of higher lows and higher highs on a recovery.

Given its outstanding balance sheet and strong positive cash flow, downside investment risk is small. Technical patterns indicate a high probability for shares to move up into their recent congestion zone between $5.50 and $6.50, where there will be overhead supply to work through before the stock could continue higher. As with all mining stocks, performance relates directly to how the underlying precious metals perform, so it’s critical that gold move in either a sideways manner where mining stocks can consolidate and base build or trend modestly higher. Or, if the gold market can rally strong, there is no doubt shares of mining stocks will also rise nicely.

Based on a multi-decade chart of gold, there is reason to believe a move higher is not far off. A more detailed discussion of the technical outlook for gold is available in a published report at TheWinnersForum.com – Cutler’s Stock Market Blog.

OTHER FUNDAMENTAL FACTORS – Considerations for Investment

UNDERVALUED MARKET VALUATION VERSUS PEERS – The slide in the share price to below $4 now values the entire company at $1.2 billion, which is now only 1.5x trailing 12-month revenue, far below industry peers. To compare: Agnico-Eagle Mines (AEM) trades at 10x, Kinross Gold (KGC) trades at 6.5x, Newmont Mining (NEM) trades at 2.2x and Barrick Gold (ABX) trades at nearly 3x revenue.

RECENT ACQUISITION OF DOYON ROYALTY – In July, with a focus on reducing cash costs, the firm acquired the participation royalty in the Doyon/Westwood Property located in Quebec from Barrick Gold for $13 million. The acquisition eliminated royalty payments which was 25% of gold prices above $375 an ounce. The savings was about $140 an ounce. The participation royalty also extended to the Westwood Development Project, about 2 kilometers from the Doyon mine. Westwood production was also freed from royalty obligations.

Other Mining Activities / Projects

Niobium Mine in Quebec – Through its Niobec Mine in Quebec the company mines a lesser known metal called Niobium. Originally known as Columbium, this 41st element is a paramagnetic metal which has a high melting point and low density. One of its noteworthy characteristics is that it is corrosion resistant. It has superconductivity properties. It is used as an alloy in the steel industry because it increases the toughness strength and weldability of steel. It is also used in producing commemorative coins. According the company, the addition of $4 of niobium can reduce the weight of mid-sized cars by 100kg which save .05l/100 km in fuel consumption. It is also used in construction and land based turbine and jet engines. They company forecast to produce 4300 tons in 2008.

Quimsacocha gold Project in Ecuador – A new constitution took effect in Ecuador in October which received 64% of a referendum vote. This is a positive development that will enable a new mining law to allow responsible mining in the country. The 100% owned 3.5 million ounce Quimsacocha Project will complete its feasibility study in 2009.

Share this:

  • Click to share on Reddit (Opens in new window) Reddit
  • Click to share on Facebook (Opens in new window) Facebook
  • Click to share on LinkedIn (Opens in new window) LinkedIn
  • More
  • Click to share on X (Opens in new window) X
  • Click to share on Pinterest (Opens in new window) Pinterest
  • Click to share on Tumblr (Opens in new window) Tumblr
  • Click to print (Opens in new window) Print
  • Click to email a link to a friend (Opens in new window) Email
Like Loading...

GoldMoney – Alert!

02 Tuesday Dec 2008

Posted by jschulmansr in Bollinger Bands, capitalism, commodities, Copper, Currency and Currencies, deflation, Finance, Fundamental Analysis, gold, inflation, Investing, investments, Latest News, Markets, mining stocks, Moving Averages, oil, precious, precious metals, silver, Stocks, Technical Analysis, Today, U.S. Dollar, Uncategorized

≈ 1 Comment

Tags

agricultural commodities, alternate energy, Austrian school, banking crisis, banks, bear market, Bollinger Bands, bull market, capitalism, central banks, China, Comex, commodities, communism, Copper, Currencies, currency, deflation, depression, diamonds, dollar denominated, dollar denominated investments, economic, economic trends, economy, financial, Forex, futures, futures markets, gold, gold miners, hard assets, heating oil, India, inflation, investments, James Turk, Keith Fitz-Gerald, market crash, Markets, mining companies, Moving Averages, natural gas, oil, palladium, Peter Schiff, physical gold, platinum, platinum miners, precious metals, price, price manipulation, prices, producers, production, protection, rare earth metals, recession, risk, run on banks, safety, Saudi Arabia, silver, silver miners, socialism, sovereign, spot, spot price, stagflation, Technical Analysis, timber, U.S. Dollar, volatility, warrants, Water

GoldMoney – Alert!

James Turk

A Successful Test of Support

In the last alert I referred to “the growing body of evidence” indicating that “the correction in gold that began after making a new record high in March above $1020 is ending.” Importantly, this point is confirmed by the following monthly chart presenting gold’s rate of exchange against the US dollar.

To explain this key development in technical terms, after making a new record high this past March, gold retraced back toward its previous record (marked in the above chart by the dashed line). Gold did the same thing back in 1978 after breaking above $200 in July that year (marked by the red circle), its previous record high. Gold climbed another 17% through October 1978, and then corrected the following month by testing $200. Support at that level held.

From there gold never looked back. It began a stellar advance that took it to $681.50, its month-end close in January 1980, the level that was just successfully tested.

The big difference between now and back then is the time needed to re-test support. The correction lasted only one month in 1978, but is now already eight months old. There are a number of reasons for this different result, but one is not the gold cartel. It was active back in the late 1970s too, dishoarding 775 tonnes from the International Monetary Fund in a vain and useless attempt to make the dollar look better by trying to cap the gold price.

The clear conclusion is that governments, even when they coordinate their effort, cannot in the end stop the market from bidding up the price of gold. So it is logical to expect a new record high for gold soon against the US dollar. It is noteworthy that gold closed this past month at new record highs against the British pound, Canadian dollar, Indian rupee and South African rand.

The driving force to exit national currencies and to buy gold is the same now as it was in the 1970s. Gold is better money than national currencies.


Published by GoldMoney
Copyright © 2008. All rights reserved.
Edited by James Turk, alert@goldmoney.com

Share this:

  • Click to share on Reddit (Opens in new window) Reddit
  • Click to share on Facebook (Opens in new window) Facebook
  • Click to share on LinkedIn (Opens in new window) LinkedIn
  • More
  • Click to share on X (Opens in new window) X
  • Click to share on Pinterest (Opens in new window) Pinterest
  • Click to share on Tumblr (Opens in new window) Tumblr
  • Click to print (Opens in new window) Print
  • Click to email a link to a friend (Opens in new window) Email
Like Loading...

Don’t Give Up on Gold Just Yet!+ Peter Schiff Bonus!

02 Tuesday Dec 2008

Posted by jschulmansr in capitalism, commodities, Copper, Currency and Currencies, deflation, Finance, Fundamental Analysis, gold, hard assets, inflation, Investing, investments, Latest News, Markets, mining stocks, Moving Averages, oil, precious metals, silver, Stocks, Technical Analysis, Today, U.S. Dollar, Uncategorized

≈ Comments Off on Don’t Give Up on Gold Just Yet!+ Peter Schiff Bonus!

Tags

agricultural commodities, alternate energy, Austrian school, banking crisis, banks, bear market, Bollinger Bands, bull market, capitalism, central banks, China, Comex, commodities, communism, Copper, Currencies, currency, deflation, depression, diamonds, dollar denominated, dollar denominated investments, economic, economic trends, economy, financial, Forex, futures, futures markets, gold, gold miners, hard assets, heating oil, India, inflation, investments, Keith Fitz-Gerald, market crash, Markets, mining companies, Moving Averages, natural gas, oil, palladium, Peter Schiff, physical gold, platinum, platinum miners, precious metals, price, price manipulation, prices, producers, production, protection, rare earth metals, recession, risk, run on banks, safety, Saudi Arabia, silver, silver miners, socialism, sovereign, spot, spot price, stagflation, Technical Analysis, timber, U.S. Dollar, volatility, warrants, Water

Don’t Give Up on Gold Just Yet – Seeking Alpha

By: Keith Fitz-Gerald of Monday Morning

If you were counting on gold to boost your returns this year, chances are you’ve been cruelly disappointed. In fact, when it comes to gold-related investments, virtually every category is down, making this one of the worst years in history for gold investors.

So, why is it that the largest of the large futures traders have some of the lowest net short positions in years? And what does this tell us about gold prices in the near future?

I’ll get to that in a minute. But first …

What Went Wrong?

In my analysis, I’ve identified the three missteps most investors made. First, investors did what they’d been told to do. But in their panic, they flocked to gold on the assumption that the yellow metal would perform as advertised. They forgot the “safety first” strategy that we’ve emphasized this year – one that included a safer, more-conservative way of buying gold.

Strike one.

Adding insult to injury, very few investors (Money Morning readers aside) failed to understand that the massive “de-leveraging” process that’s been part and parcel of the global financial crisis would put downward pressure on virtually every asset class at the same time. And that includes gold. As we’ve seen in the last few months, during times of global panic, investors around the world want the safety of U.S. dollars – and a lot of them – even more than they want gold right now.

Strike two.

But, above all else, most investors failed to realize that gold, just like any other asset, produces the best returns when it is attractively priced. So most investors made the classic mistake of piling in on the basis of performance. In other words, they bought in at the top.
Strike three.

What’s Changed?

During times of crisis, investors have been taught to latch onto those asset classes with the highest relative stability – including gold and precious metals. More often than not, investors who have followed these time-proven practices have been handsomely rewarded for doing so.

This time around, however, the parameters have changed, as the increased use of such “derivative” securities as “credit default swaps” has exacerbated the fallout from the global financial crisis, and touched off the aforementioned de-leveraging process. As asset markets have melted down, hedge funds, financial institutions worldwide, and even government-controlled sovereign wealth funds have taken heavy losses, forcing them to deal with unprecedented margin calls and redemption requests. Because this has never before been part of their crisis-management process, institutional investors have engaged in a massive, concerted effort to sell anything that’s at all liquid – including gold.

Making matters worse, the so-called “carry trade” unwound with a vengeance, forcing offshore investors to buy U.S. dollars in order to offset the sell-off of dollar-denominated assets. In contrast to what you’re hearing on the news, this really is not a sign that the dollar is any stronger than other currencies. Instead it signifies that the greenback is still the global currency of choice – much to the chagrin of Russia, Venezuela and others who begrudgingly tie themselves to it.

It also highlights something that most investors forget, or perhaps never knew in the first place. For better or worse, the dollar is the most liquid of the world’s reserve currencies. Part of that’s because many assets – especially oil – are still predominately traded in dollars.

The problem is that the dollar’s healthy appearance may be just that – an appearance that covers up an inner ill health. These still-hidden maladies have been worsened by the recent machinations of “Bailout Ben” – U.S. Federal Reserve Chairman Ben S. Bernanke – and U.S. Treasury Secretary Henry M. “Hank” Paulson Jr., whose fix-it programs have created a financial Frankenstein that will chase American taxpayers for years.

When the dollar was rallying back in May, and many experts were lauding the move as a turnaround in the making for the long-languishing U.S. currency, we warned investors not to be taken in by the market’s head fake. There were just too many underlying problems for the dollar’s rally to be sustainable. Ultimately, that rally sputtered, and the dollar reversed course and continued its decline.

This time, we again suspect that the dollar is rising too far too fast and that the spike we’ve seen in recent months may be nothing more than a flameout in the making.

However, given the relationship between the greenback and the yellow metal, this leads us to believe that gold could move higher next year if investors lose faith that the dollar merits their nearly exclusive attention right now.

Two pieces of closely related information appear to support this theory:

First, even though gold prices have tanked – a reality that under ordinary circumstances would mean more supply is available – dealers of gold bullion have experienced widespread physical shortages during the third quarter, according to the World Gold Council, a top trade association for the gold-mining industry. That, in turn, led dealers to both charge more and pay more than the spot price would indicate. Particularly strong demand was noted in China, India and the Middle East.

According to a Nov. 19 press release, the World Gold Council also noted that identifiable investment demand for gold in the third quarter was up $10.7 billion to 382 tons – double the levels of a year ago. At the same time, retail investment demand rose 121% to 232 tons, with especially for gold bars and gold coins reported in the Swiss, German and U.S. markets.

At the same time, the SPDR Gold Trust (GLD) – the largest exchange-traded fund (ETF) that invests in the yellow metal – noted that it now holds 755.06 tons of gold in trust, up 6.12 tons from the prior week. This is significant because authorized market participants like GLD have to add metal and increase their trading float when buying pressure is higher than selling pressure. This suggests that gold may be reaching the end of its downside run and that it may behave more like investors expect it to in the months ahead.

Second, we find it especially interesting that the largest of the commercial futures traders now hold the smallest net short positions they have held in several years. According to the U.S. Commodities Futures Trading Commission (CFTC), large commercial traders combined net short positions reflect only 71,116 contracts net short, one of the lowest net short positions the CFTC has reported since January 2006.

Historically, low net short positions have proven to be bullish influences. And net short levels of less than 30% total open interest have proven to be especially bullish.

The wild card here, of course, is that the markets are working through a de-leveraging process that’s far from over, meaning that normal supply and demand relationships are out of whack. Longer-term, however, everything we know about those relationships still appears to be intact.

That’s why we suggest that investors make gold a part of their investment program – if for no other reason than we are approaching levels typically associated with higher, rather than lower, returns.

But we can’t just pile in.

Short-term market conditions will transform anything other than a measured approach into a hazardous foray.

That’s why, when it comes to gold, we’ve repeatedly recited the market mantra: “Gold works over time, but not all the time.” [For insights on actual gold-investing strategies, check out the Money Morning special investment research report, “The Best Way to Use Gold to Protect Your Portfolio and Profit.” The report is free of charge.]

[Editor’s Note: Money Morning Investment Director Keith Fitz-Gerald is one of the top investment commentators in the global marketplace today. A noted columnist and a highly sought after speaker, Fitz-Gerald is also a gifted forecaster. Indeed, he’s especially distinguished himself during the current financial crisis, having told investors to expect historic levels of market volatility and having accurately predicted such crisis “aftershocks” as the big spike in energy and commodity prices that took place earlier this year. A new Money Morning report identifies five such aftershocks that are still to come, and explains how savvy investors can employ such “trigger events” as potential gateways to major profits. To read this report, which details all five of the aftershocks to expect, please click here. And don’t forget to check out Fitz-Gerald’s recently published 2009 stock market forecast, part of Money Morning’s ongoing “Outlook 2009” economic forecast series.]

=====================================================

Dare Something Worthy Today Too! Bonus! Peter Schiff

Peter Schiff Was Right!

Peter Schiff Analogies


$2000 Gold in 2009 says Peter Schiff

Share this:

  • Click to share on Reddit (Opens in new window) Reddit
  • Click to share on Facebook (Opens in new window) Facebook
  • Click to share on LinkedIn (Opens in new window) LinkedIn
  • More
  • Click to share on X (Opens in new window) X
  • Click to share on Pinterest (Opens in new window) Pinterest
  • Click to share on Tumblr (Opens in new window) Tumblr
  • Click to print (Opens in new window) Print
  • Click to email a link to a friend (Opens in new window) Email
Like Loading...

Golden Choice For Bailout Inflation Protection – Forbes.com

28 Friday Nov 2008

Posted by jschulmansr in Bollinger Bands, capitalism, commodities, Copper, Currency and Currencies, deflation, Finance, gold, hard assets, inflation, Investing, investments, Latest News, Markets, mining stocks, Moving Averages, oil, precious metals, silver, small caps, Stocks, Technical Analysis, Today, U.S. Dollar, Uncategorized

≈ 1 Comment

Tags

agricultural commodities, alternate energy, Austrian school, banking crisis, banks, bear market, Bollinger Bands, bull market, capitalism, central banks, China, Comex, commodities, communism, Copper, Currencies, currency, deflation, depression, diamonds, dollar denominated, dollar denominated investments, economic, economic trends, economy, financial, Forex, futures, futures markets, gold, gold miners, hard assets, heating oil, India, inflation, investments, market crash, Markets, mining companies, Moving Averages, natural gas, oil, palladium, physical gold, platinum, platinum miners, precious metals, price, price manipulation, prices, producers, production, protection, rare earth metals, recession, risk, run on banks, safety, Saudi Arabia, silver, silver miners, socialism, sovereign, spot, spot price, stagflation, Technical Analysis, timber, U.S. Dollar, volatility, warrants, Water

Golden Choice For Bailout Inflation Protection – Forbes.com

John Dobosz, 11.26.08, 11:50 AM EST

Gold and gold miners have taken flight in recent days as the world begins to focus on an inflationary future.

Since the problems associated with the current financial crisis began to take on a particular menace last summer, the response of our monetary institutions has involved moves that most students of economics would call inflationary, like aggressive reduction in targeted short-term lending rates and credit creation at a feverish pace.

Thanks to the deflationary forces that accompanied the unwinding of leverage in the financial system and in the flagging economy at large, the dollar actually rallied and gold suffered big time. From a post Jimmy Carter high of $1,011 in March, spot gold tumbled 30% down to $712 an ounce.

Now, however, investors seem to be awakening to the inflationary impact of the moves by the Federal Reserve and the Treasury Department. Over the past three weeks, gold has staged a rally, and over just the past week, it has looked more like a lift-off. Spot gold was above $830 for much of this holiday-shortened trading week, a gain of more than 15% from lows earlier this month, with most of that coming just since Thursday.

Moving higher more rapidly than gold bullion itself are shares of gold miners. The Philadelphia Gold and Silver Mining Index (XAU) added nearly 43% in just the past three days. This could indicate simply that the miners were more deeply oversold, or, if it persists, it could mean that investors are looking for escalating gold prices down the line. Either way, it looks like gold and the miners are staging a decent rally that could last until the first quarter of next year, according to Curt Hesler, editor of Professional Timing Service.

Hesler has several mining stocks that he likes for playing the new buoyancy in gold shares, from blue chips like Goldcorp (nyse: (GG) – news – people ) to smaller names like Yamana Gold (nyse: (AUY) – news – people ) and the tiny like US Gold Corp. (amex: (UXG) – news – people ). For smaller investors, perhaps it’s best to buy a basket of miners and jump on the train.

A great way to get into gold miners is through the Fidelity Select Gold (FSAGX) fund, a diversified grab bag that holds a small amount of gold bullion and a long roster of mining companies. Its biggest holdings are in Barrick Gold (nyse: (ABX) – news – people ), Goldcorp and Newmont Mining (nyse: (NEM) – news – people ) and Agnico Eagle (nyse: (AEM) – news – people ).

The expense ratio of FSAGX is one of the things to like most about this fund. At 0.81% it’s nearly half the 1.47% charged by most precious metals funds. Another nice feature is that it trades throughout the day, and you can get in and out when you like and even use limit orders when buying.

Lately the fund has been volatile, but it’s going in the right direction for the bulls. It’s up 40% in the past month. Of course, prior to that, it lost half of its value from late September through late October, overshooting even the steep correction in gold. Many advisers recommend an allocation of 5% to 10% in your portfolio to inflation hedges, like gold.

Click here to sign up to receive Stock of the Week next Monday morning.

Share this:

  • Click to share on Reddit (Opens in new window) Reddit
  • Click to share on Facebook (Opens in new window) Facebook
  • Click to share on LinkedIn (Opens in new window) LinkedIn
  • More
  • Click to share on X (Opens in new window) X
  • Click to share on Pinterest (Opens in new window) Pinterest
  • Click to share on Tumblr (Opens in new window) Tumblr
  • Click to print (Opens in new window) Print
  • Click to email a link to a friend (Opens in new window) Email
Like Loading...

Ten investing rules that will help you weather this stormy market – MarketWatch

28 Friday Nov 2008

Posted by jschulmansr in capitalism, commodities, Currency and Currencies, deflation, Finance, Fundamental Analysis, gold, inflation, Investing, investments, Latest News, Markets, mining stocks, Moving Averages, precious metals, small caps, Stocks, Technical Analysis, Today, U.S. Dollar, Uncategorized

≈ Comments Off on Ten investing rules that will help you weather this stormy market – MarketWatch

Tags

10 Rules of Investing, agricultural commodities, alternate energy, Austrian school, banking crisis, banks, bear market, Bollinger Bands, bull market, capitalism, central banks, China, Comex, commodities, communism, Copper, Currencies, currency, deflation, depression, diamonds, dollar denominated, dollar denominated investments, economic, economic trends, economy, financial, Forex, futures, futures markets, gold, gold miners, hard assets, heating oil, India, inflation, investments, market crash, Markets, mining companies, Moving Averages, natural gas, oil, palladium, physical gold, platinum, platinum miners, precious metals, price, price manipulation, prices, producers, production, protection, rare earth metals, recession, risk, run on banks, safety, Saudi Arabia, silver, silver miners, socialism, sovereign, spot, spot price, stagflation, Technical Analysis, timber, U.S. Dollar, volatility, warrants, Water

Ten investing rules that will help you weather this stormy market – MarketWatch

By Jonathan Burton, MarketWatch

LIFE SAVINGS

Learn a lesson — before you get one

Ten rules to remember about investing in the stock market

Especially now. Investment rules are tailor-made for tough times, allowing you to stick to a plan just when you need it most. Indeed, a rulebook is important in any market climate, but it tends to get tossed when stocks are soaring. That’s why sage investors warn people not to confuse a bull market with brains.
So with the economy looking more and more like the oil-shocked, stagflation-strapped 1970s, and stocks recoiling from rising unemployment, record energy prices and falling home values, it makes sense to dust off the old playbook and see how it applies today.
One of the most relevant lists of rules, from a legendary Wall Street veteran, is also among the least known. Beginning in the late 1950s, Bob Farrell pioneered technical analysis, which rates a stock not only on a company’s financial strength or business line but also on the strong patterns and line charts reflected in the shares’ trading history. Farrell also broke new ground using investor sentiment figures to better understand how markets and individual stocks might move.
Over several decades at brokerage giant Merrill Lynch & Co., Farrell had a front-row seat to the go-go markets of the late 1960s, mid-1980s and late 1990s, the brutal bear market of 1973-74, and October 1987’s crash. Out of those and other experiences came Farrell’s 10 “Market Rules to Remember.”
These days, Farrell lives in Florida, and efforts to contact him were unsuccessful. Still, the following rules he advocated resonate during volatile markets such as this:
1. Markets tend to return to the mean over time…
By “return to the mean,” Farrell means that when stocks go too far in one direction, they come back. If that sounds elementary, then remember that both euphoric and pessimistic markets can cloud people’s heads.
“It’s so easy to get caught up in the heat of the moment and not have perspective,” says Bob Doll, global chief investment officer for equities at money manager BlackRock Inc. “Those that have a plan and stick to it tend to be more successful.”
2. Excesses in one direction will lead to an opposite excess in the other direction…
Think of the market as a constant dieter who struggles to stay within a desired weight range but can’t always hit the mark.
“In the 1990s when we were advancing by 20% per year, we were heading for disappointment,” says Sam Stovall, chief investment strategist at Standard & Poor’s Inc. “Sooner or later, you pay it back.”
3. There are no new eras — excesses are never permanent…
This harkens to the first two rules. Many investors try to find the latest hot sector, and soon a fever builds that “this time it’s different.” Of course, it never really is. When that sector cools, individual shareholders are usually among the last to know and are forced to sell at lower prices.
“It’s so hard to switch and time the changes from one sector to another,” says John Buckingham, editor of The Prudent Speculator newsletter. “Find a strategy that you believe in and stay put.”
4. Exponential rapidly rising or falling markets usually go further than you think, but they do not correct by going sideways…
This is Farrell’s way of saying that a popular sector can stay hot for a long while, but will fall hard when a correction comes. Chinese stocks not long ago were market darlings posting parabolic gains, but investors who came late to this party have been sorry.
5. The public buys the most at the top and the least at the bottom…
Sure, and if they didn’t, contrarian-minded investors would have nothing to crow about. Accordingly, many market technicians use sentiment indicators to gauge investor pessimism or optimism, then recommend that investors head in the opposite direction.
Some closely watched indicators have been mixed lately. At Investors Intelligence, an investment service that measures the mood of more than 100 investment newsletter writers, bullish sentiment rose last week to 44.8% from 37.9% the week before. Bearish sentiment slipped to 31.1% from 32.2%. Meanwhile, the American Association of Individual Investors survey was less positive, with bearish sentiment at 45.8% and bulls at 31.4% .
Learn a lesson — before you get one!
6. Fear and greed are stronger than long-term resolve…
Investors can be their own worst enemy, particularly when emotions take hold.
Stock market gains “make us exuberant; they enhance well-being and promote optimism,” says Meir Statman, a finance professor at Santa Clara University in California who studies investor behavior. “Losses bring sadness, disgust, fear, regret. Fear increases the sense of risk and some react by shunning stocks.”
After grim trading days like Friday’s nearly 400-point tumble, coming after months of downward pressure on stocks, it’s easy to think you’re the patsy at this card table. To counter those insecure feelings, practice self-control and keep long-range portfolio goals in perspective. That will help you to be proactive instead of reactive.
“It’s critical for investors to understand how they’re cut,” says the Prudent Speculator’s Buckingham. “If you can’t handle a 15% or 20% downturn, you need to rethink how you invest.”
7. Markets are strongest when they are broad and weakest when they narrow to a handful of blue-chip names…
Markets and individual sectors can move in powerful waves that take all boats up or down in their wake. There’s strength in numbers, and such broad momentum is hard to stop, Farrell observes. In these conditions you either lead, follow or get out of the way.
When momentum channels into a small number of stocks, it means that many worthy companies are being overlooked and investors essentially are crowding one side of the boat. That’s what happened with the “Nifty 50” stocks of the early 1970s, when much of the U.S. market’s gains came from the 50 biggest companies on the New York Stock Exchange. As their price-to-earnings ratios climbed to unsustainable levels, these “one-decision” stocks eventually sunk.
Chart of SPX
8. Bear markets have three stages — sharp down, reflexive rebound and a drawn-out fundamental downtrend…
Is this a bear market? That depends on where you draw the starting line. With Friday’s close, the S&P 500 Index (SPX):
(SPX) 896.24, +8.56, +1.0%) is down 13.1% since its October 9 peak. Not the 20%-plus decline that typically marks a bear, but a vicious encounter nonetheless.
Where are we now? A chart of the S&P 500 shows a couple of sharp downs and subsequent rebounds in the past six months, with a tighter trading range since April. It remains to be seen if we can avoid a tortured period of the kind seen from 2000 to 2002, when sporadic rallies couldn’t snap a slow, protracted decline.
9. When all the experts and forecasts agree — something else is going to happen…
As Stovall, the S&P investment strategist, puts it: “If everybody’s optimistic, who is left to buy? If everybody’s pessimistic, who’s left to sell?”
Going against the herd as Farrell repeatedly suggests can be very profitable, especially for patient buyers who raise cash from frothy markets and reinvest it when sentiment is darkest.
10. Bull markets are more fun than bear markets (unless you are shorting the markets)…
No kidding!
DARE SOMETHING WORTHY TODAY TOO! Bonus: Top Performing Precious Metals Mutual Funds
TOP PERFORMING PRECIOUS METALS FUNDS
FUND 1-Month
Return
1-Year
Return
3-Year
Return
ProFunds Precious Metals (PMPIX)

42.6%

-68.8

-21.6%

Fidelity Select Gold (FSAGX)

35.4

-42.4

0.5

American Century Global Gold (BGEIX)

34.8

-48.5

-4.2

OCM Gold Fund (OCMGX)

34.1

-45.6

1.4

Evergreen Precious Metals (EKWBX)
32.5

-43.5

2.4

Franklin Gold and Precious Metals (FKRCX)

32.0

-50.6

-2.6

Van Eck Intl Investors Gold (INIVX)

31.9

-49.4

2.3

USAA Precious Metals & Minerals (USAGX)

31.6

-47.4

3.0

GAMCO Gold AAA (GOLDX)

31.6

-48.6

-1.4

DWS Gold & Precious Metals (SCGDX)

31.1

-49.8

-3.5


Through 11/24/08. Source: Morningstar.com


Share this:

  • Click to share on Reddit (Opens in new window) Reddit
  • Click to share on Facebook (Opens in new window) Facebook
  • Click to share on LinkedIn (Opens in new window) LinkedIn
  • More
  • Click to share on X (Opens in new window) X
  • Click to share on Pinterest (Opens in new window) Pinterest
  • Click to share on Tumblr (Opens in new window) Tumblr
  • Click to print (Opens in new window) Print
  • Click to email a link to a friend (Opens in new window) Email
Like Loading...

Simple Moving Averages Make Trends Stand Out

17 Monday Nov 2008

Posted by jschulmansr in Bollinger Bands, commodities, Copper, Currency and Currencies, deflation, Finance, gold, hard assets, inflation, Investing, investments, Latest News, Markets, mining stocks, Moving Averages, oil, precious metals, silver, Technical Analysis, Today, U.S. Dollar, Uncategorized, uranium, Water

≈ Comments Off on Simple Moving Averages Make Trends Stand Out

Tags

agricultural commodities, alternate energy, Austrian school, banking crisis, banks, bear market, bear stearns, Bollinger Bands, bull market, capitalism, central banks, China, Comex, commodities, communism, Copper, Currencies, currency, deflation, depression, diamonds, dollar denominated, dollar denominated investments, economic, economic trends, economy, financial, Forex, futures, futures markets, gold, gold miners, hard assets, heating oil, India, inflation, investments, market crash, Markets, mining companies, Moving Averages, natural gas, oil, palladium, physical gold, platinum, platinum miners, precious metals, price, price manipulation, prices, producers, production, protection, rare earth metals, recession, risk, run on banks, safety, silver, silver miners, socialism, sovereign, spot, spot price, stagflation, Technical Analysis, timber, U.S. Dollar, volatility, Water

Simple Moving Averages Make Trends Stand Out

By: John Devcic of BK TRADER FX    The 5 Things That Move The Currency Market

Moving averages are one of the most popular and often-used technical indicators. The moving average is easy to calculate and, once plotted on a chart, is a powerful visual trend-spotting tool. You will often hear about three types of moving average: simple, exponential and linear. The best place to start is by understanding the most basic: the simple moving average (SMA). Let’s take a look at this indicator and how it can help traders follow trends toward greater profits.

Trendlines
There can be no complete understanding of moving averages without an understanding of trends. A trend is simply a price that is continuing to move in a certain direction. There are only three real trends that a security can follow:

  • An uptrend, or bullish trend, means that the price is moving higher. 
  • A downtrend, or bearish trend, means the price is moving lower.  
  • A sideways trend, where the price is moving sideways.

The important thing to remember about trends is that prices rarely move in a straight line. Therefore, moving-average lines are used to help a trader more easily identify the direction of the trend. (For more advanced reading on this topic, see The Basics Of Bollinger Bands and Moving Average Envelopes: Refining A Popular Trading Tool.)

Moving Average Construction
The textbook definition of a moving average is an average price for a security using a specified time period. Let’s take the very popular 50-day moving average as an example. A 50-day moving average is calculated by taking the closing prices for the last 50 days of any security and adding them together. The result from the addition calculation is then divided by the number of periods, in this case 50. In order to continue to calculate the moving average on a daily basis, replace the oldest number with the most recent closing price and do the same math.

No matter how long or short of a moving average you are looking to plot, the basic calculations remain the same. The change will be in the number of closing prices you use. So, for example, a 200-day moving average is the closing price for 200 days summed together and then divided by 200. You will see all kinds of moving averages, from two-day moving averages to 250-day moving averages.

It is important to remember that you must have a certain number of closing prices to calculate the moving average. If a security is brand new or only a month old, you will not be able to do a 50-day moving average because you will not have a sufficient number of data points.

Also, it is important to note that we’ve chosen to use closing prices in the calculations, but moving averages can be calculated using monthly prices, weekly prices, opening prices or even intraday prices. (For more, see our Moving Averages tutorial.)

Figure 1: A simple moving average in Google Inc.
Source: StockCharts.com

Figure 1 is an example of a simple moving average on a stock chart of Google Inc. (Nasdaq:GOOG). The blue line represents a 50-day moving average. In the example above, you can see that the trend has been moving lower since late 2007. The price of Google shares fell below the 50-day moving average in January of 2008 and continued downward.

When the price crosses below a moving average, it can be used as a simple trading signal. A move below the moving average (as shown above) suggests that the bears are in control of the price action and that the asset will likely move lower. Conversely, a cross above a moving average suggests that the bulls are in control and that the price may be getting ready to make a move higher. (Read more in Track Stock Prices With Trendlines.)

Other Ways to Use Moving Averages           
Moving averages are used by many traders to not only identify a current trend but also as an entry and exit strategy. One of the simplest strategies relies on the crossing of two or more moving averages. The basic signal is given when the short-term average crosses above or below the longer term moving average. Two or more moving averages allow you to see a longer term trend compared to a shorter term moving average; it is also an easy method for determining whether the trend is gaining strength or if it is about to reverse. (For more on this method, read A Primer On The MACD.)

Figure 2: A long-term and shorter term moving average in Google Inc.
Source: StockCharts.com

Figure 2 uses two moving averages, one long-term (50-day, shown by the blue line) and the other shorter term (15-day, shown by the red line). This is the same Google chart shown in Figure 1, but with the addition of the two moving averages to illustrate the difference between the two lengths.

You’ll notice that the 50-day moving average is slower to adjust to price changes, because it uses more data points in its calculation. On the other hand, the 15-day moving average is quick to respond to price changes, because each value has a greater weighting in the calculation due to the relatively short time horizon. In this case, by using a cross strategy, you would watch for the 15-day average to cross below the 50-day moving average as an entry for a short position.

Figure 3: A three-month
Source: StockCharts.com

The above is a three-month chart of United States Oil (AMEX:USO) with two simple moving averages. The red line is the shorter, 15-day moving average, while the blue line represents the longer, 50-day moving average. Most traders will use the cross of the short-term moving average above the longer-term moving average to initiate a long position and identify the start of a bullish trend. (Learn more about applying this strategy in Trading The MACD Divergence.)

Support and Resistance
Support and resistance, or ceilings and floors, refer to the same thing in technical analysis.

  • Support is established when a price is trending downward. There is a point at which the selling pressure subsides and buyers are willing to step in. In other words, a floor is established.  
  • Resistance happens when a price is trending upward. There comes a point when the buying strength diminishes and the sellers step in. This would establish a ceiling. (For more explanation, read Support & Resistance Basics.)

In either case, a moving average may be able to signal an early support or resistance level. For example, if a security is drifting lower in an established uptrend, then it wouldn’t be surprising to see the stock find support at a long-term 200-day moving average. On the other hand, if the price is trending lower, many traders will watch for the stock to bounce off the resistance of major moving averages (50-day, 100-day, 200-day SMAs). (For more on using support and resistance to identify trends, read Trend-Spotting With The Accumulation/Distribution Line.)

Conclusion
Moving averages are powerful tools. A simple moving average is easy to calculate, which allows it to be employed fairly quickly and easily. A moving average’s greatest strength is its ability to help a trader identify a current trend or spot a possible trend reversal. Moving averages can also identify a level of support or resistance for the security, or act as a simple entry or exit signal. How you choose to use moving averages is entirely up to you.

For further reading on moving averages, check out Simple Moving Averages And Volume Rate-Of-Change and Basics Of Weighted Moving Averages.

by John Devcic, (Contact Author | Biography)

John Devcic is a freelance writer, market historian and private speculator. After investing in a mutual fund right out of high school and losing his initial investment of $350, Devcic began to believe he could do better with his money then the so-called experts could. Over the years a healthy and sometimes unhealthy obsession with how the markets work and how they worked in the past has made Devcic a true market historian. He reminds himself at all times that the market – while ever-changing – always seems to repeat itself.

Share this:

  • Click to share on Reddit (Opens in new window) Reddit
  • Click to share on Facebook (Opens in new window) Facebook
  • Click to share on LinkedIn (Opens in new window) LinkedIn
  • More
  • Click to share on X (Opens in new window) X
  • Click to share on Pinterest (Opens in new window) Pinterest
  • Click to share on Tumblr (Opens in new window) Tumblr
  • Click to print (Opens in new window) Print
  • Click to email a link to a friend (Opens in new window) Email
Like Loading...
Newer posts →

Authors

  • jschulmansr's avatar jschulmansr
    • Free Crypto!
    • Free Crypto Currency
    • This is Blessed!
    • Trump Rally Charleston
    • Trump Rally Charleston

Blog at WordPress.com.

Privacy & Cookies: This site uses cookies. By continuing to use this website, you agree to their use.
To find out more, including how to control cookies, see here: Cookie Policy
  • Subscribe Subscribed
    • Dare Something Worthy Today Too!
    • Already have a WordPress.com account? Log in now.
    • Dare Something Worthy Today Too!
    • Subscribe Subscribed
    • Sign up
    • Log in
    • Report this content
    • View site in Reader
    • Manage subscriptions
    • Collapse this bar
 

Loading Comments...
 

    %d